
Trade Management: How to minimize risks and maximize rewards in your trading
If you are actively trading, you probably know that entering a trade is very often relatively easy compared to getting out of it.
Either if it is a position in significant profit and you are driven by the greed of making more or the trade against you, you have a hard time ripping the bandaid off.
This article will go through different factors that you should consider while getting in and out of the trades and hopefully will help you in your trading.
You can consider this to be a second part of the article about Risk Management, so make sure to read that if you haven’t already.
If you like this article, read the rest of the blog or join the Tradingriot Bootcamp for a comprehensive video course, access to private discord and regular updates.
For those who are looking for a new place for trading crypto, make sure to check out Woo. If you register using this link and open your first trade, you will get a Tier 1 fee upgrade for the first 30 days, and we will split commissions 50/50, which means you will get 20% of all your commissions back for a lifetime. On top of that, you will receive a 20% discount for Tradingriot Bootcamp and 100% free access to Tradingriot Blueprint.
Table of Contents
Trade management
As I already mentioned, getting into the trade is often the most straightforward part, and the ability to get out of position separates those who make money in trading and those who don’t.
You can nail down a perfect trade entry with an almost non-maximum adverse excursion (MAE), meaning the trade will go only your way right from the entrance. However, if you cannot manage your trades, you can still either lose money or close trade too early because of fear of losing potential profits.
For this article, we assume you are trading with hard stop loss and take profit.
Is it possible to trade without them?
Yes, but if you trade without a stop loss, you are playing quite a dangerous game, and things can go south quickly.
Trading without a stop is definitely for seasonal traders, who usually scale into their positions and know well what they are doing.
There are two main advantages to using a hard invalidation for every trade you take.
First, when you focus on lower timeframes, you usually open bigger sizes thanks to leverage, as you only want to capture a small price %.
It is just a matter of time before you open a trade that will spike very hard against you right after you open it.

Suddenly you are sitting at a significant unrealised loss hoping the market goes back to your entry so you can at least get out for break-even.
This is where those skilled traders not using a stop-loss must take a hit on the chin and cut the position.
Inexperienced traders often start to scale in, risking way more than they originally planned. Especially during the high-impact news market, they can go one direction and end up liquidating their whole account.
There are situations where the stop loss is not so significant. Still, they often rely on more fundamental beliefs connected with investing or using strategies such as dollar-cost averaging, essentially the type of trade where you have absolute confidence in an asset and want to build a position over a more extended period, and your trade invalidation is only when this fundamental belief is no longer valid.
The second reason I am always a proponent of using a hard invalidation is that you will be able to tell right away how much money you will lose if the trade goes against you and how much you make if it hits your profit.
Taking profit level is not so important to set as many trends following strategies work based on trail stops rather than having one predetermined level.

Although this is a highly simplified way of looking at the market, if you take a look at the chart above your thought the process should look something like this:
“ETH looks good here to test upside resistance. If it breaks below the previous low, I am wrong on this trade idea. Therefore, I no longer want to be in a trade. If the work goes against me, I have a stop loss in place and will lose a maximum of $1000.
If I am correct, ETH will go 2.2 times my risk. Therefore, I will make $2200.”
Even if you don’t go with a fixed take profit level and decide to trail your stop loss based on price action, moving averages or anything else, you are coming into the trade with a fixed idea, and the most important thing is that you know where you no longer want to be in position.
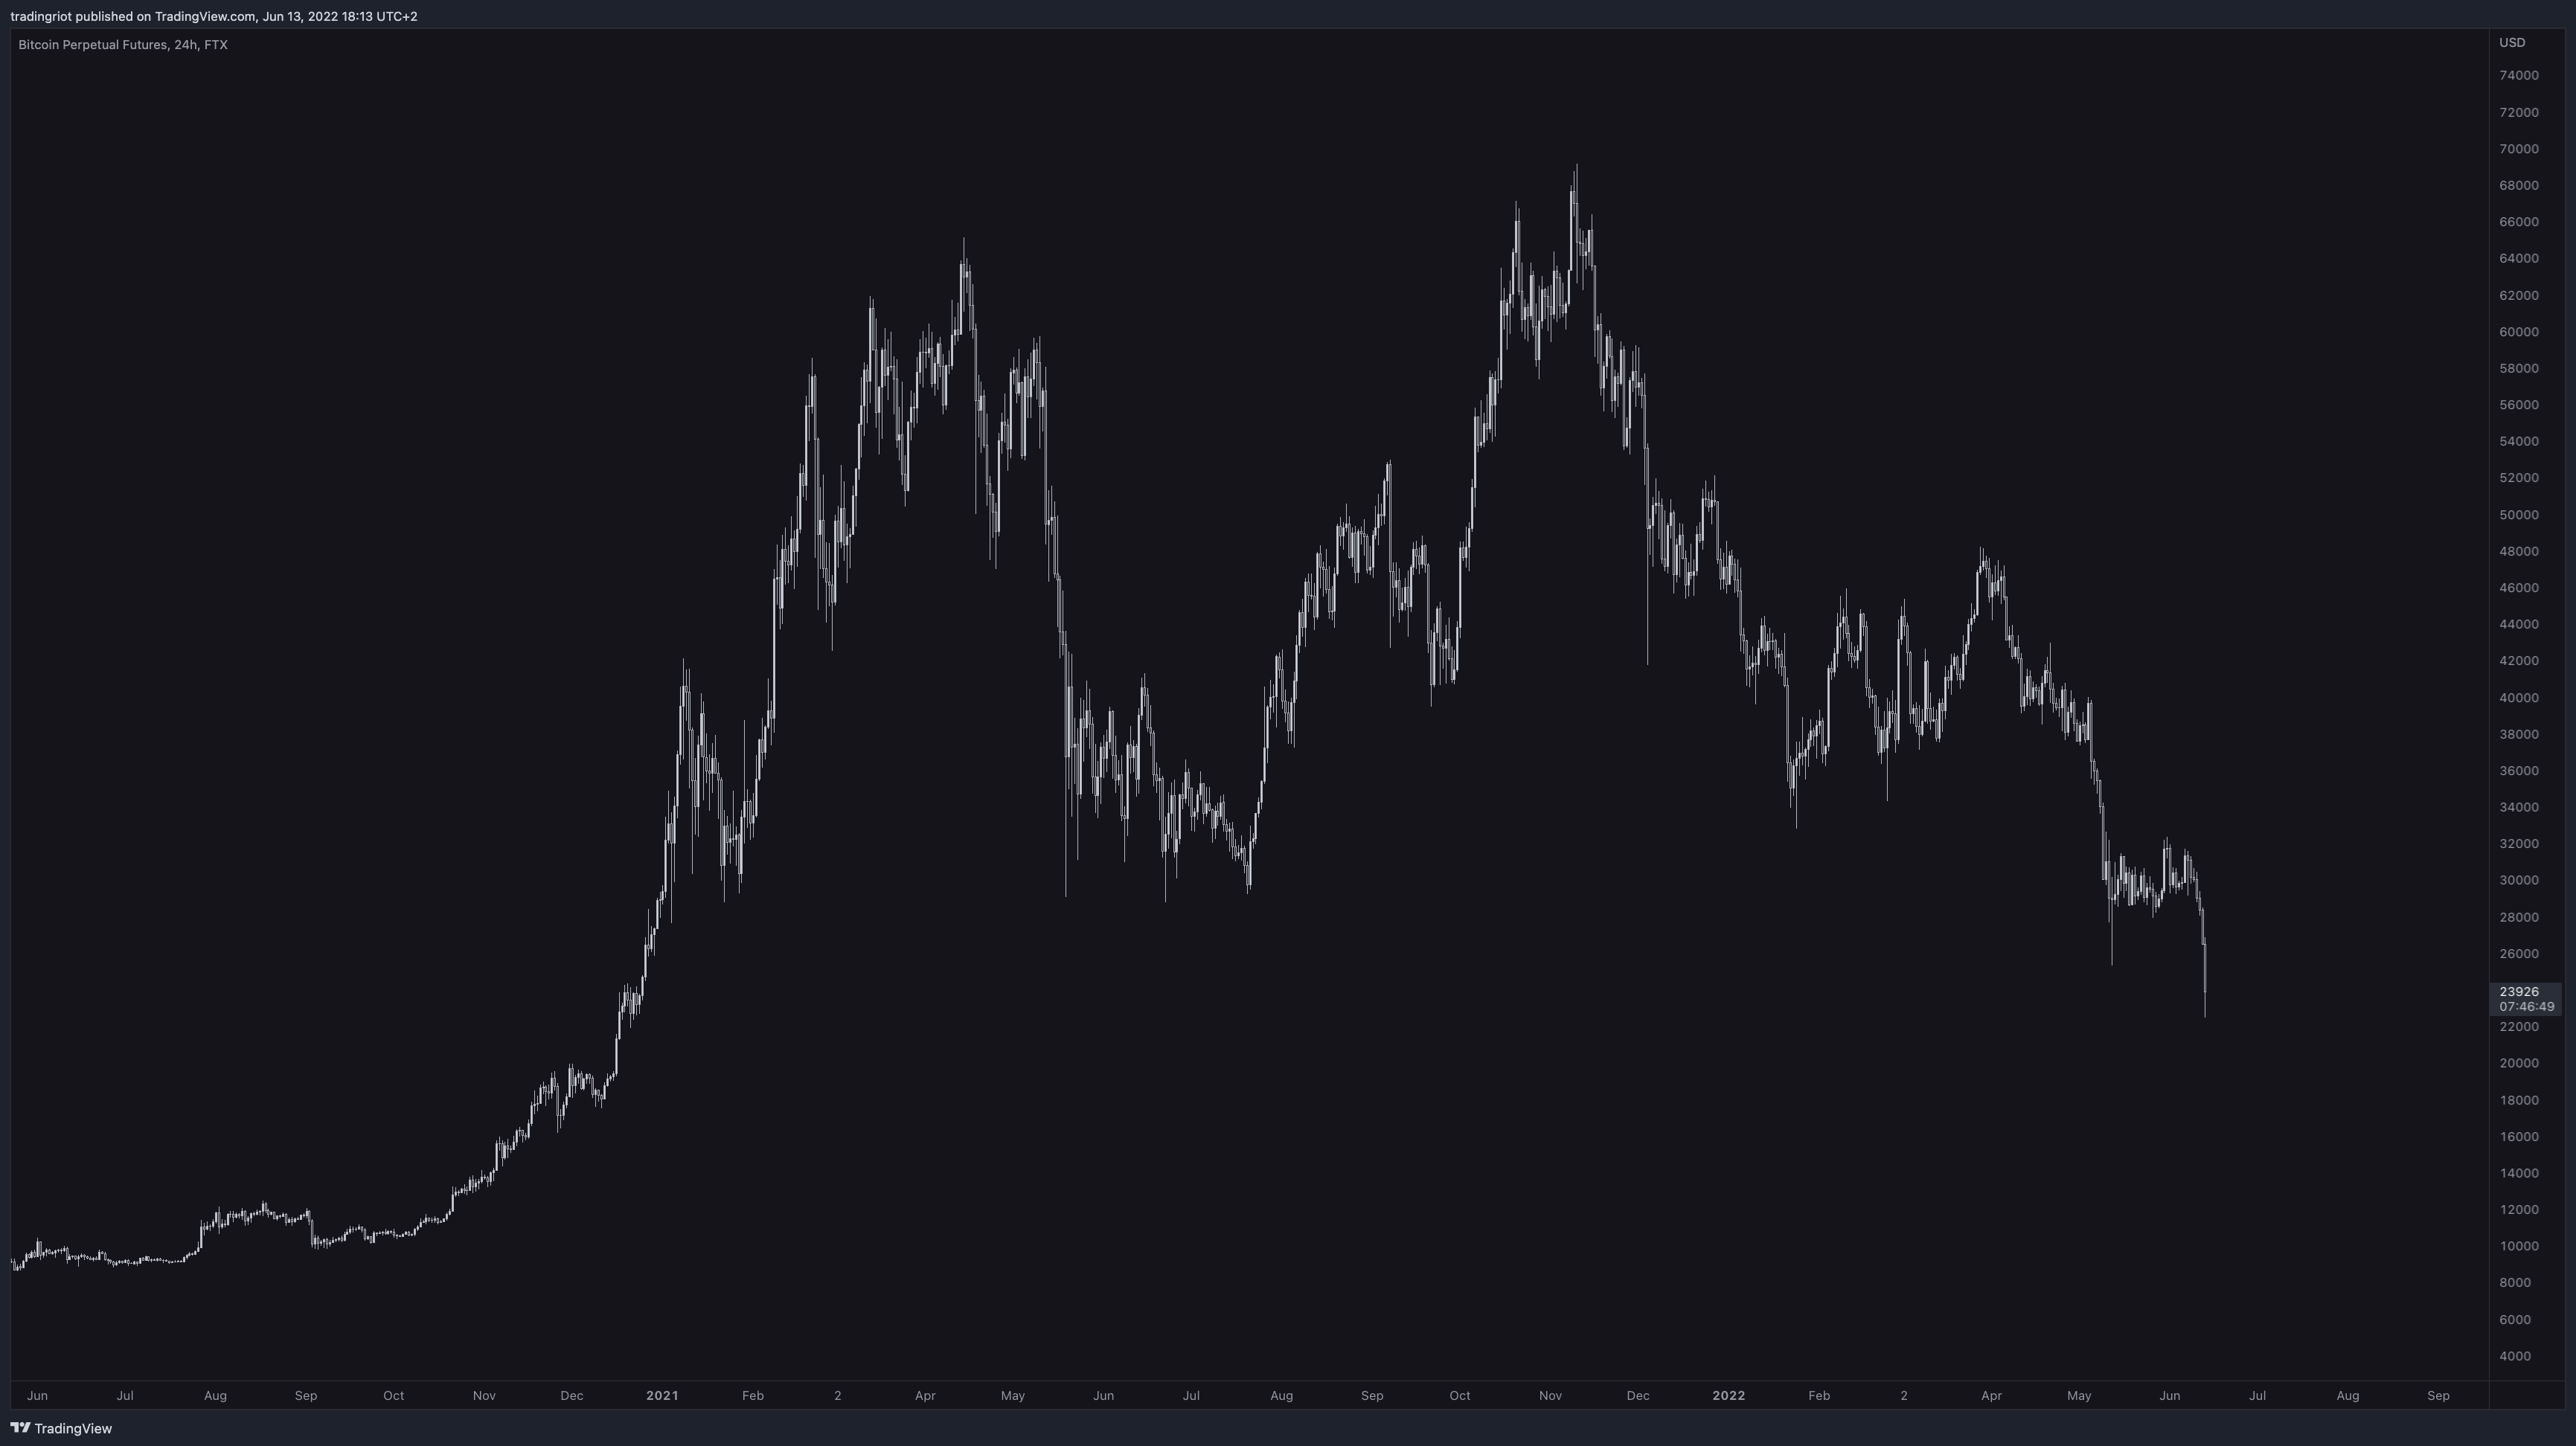
In November 2021, there was overall consensus on Twitter that Bitcoin is the best thing that ever existed, and it is on its way to 75k, 100k, 250k and so on.
When it comes to crypto, the conventional wisdom tends to be to invest your money in the spot market only since the overall market is volatile enough that you don’t need to use leveraged products.
This often leads inexperienced people to view crypto as an investment and start buying without any invalidation in mind.
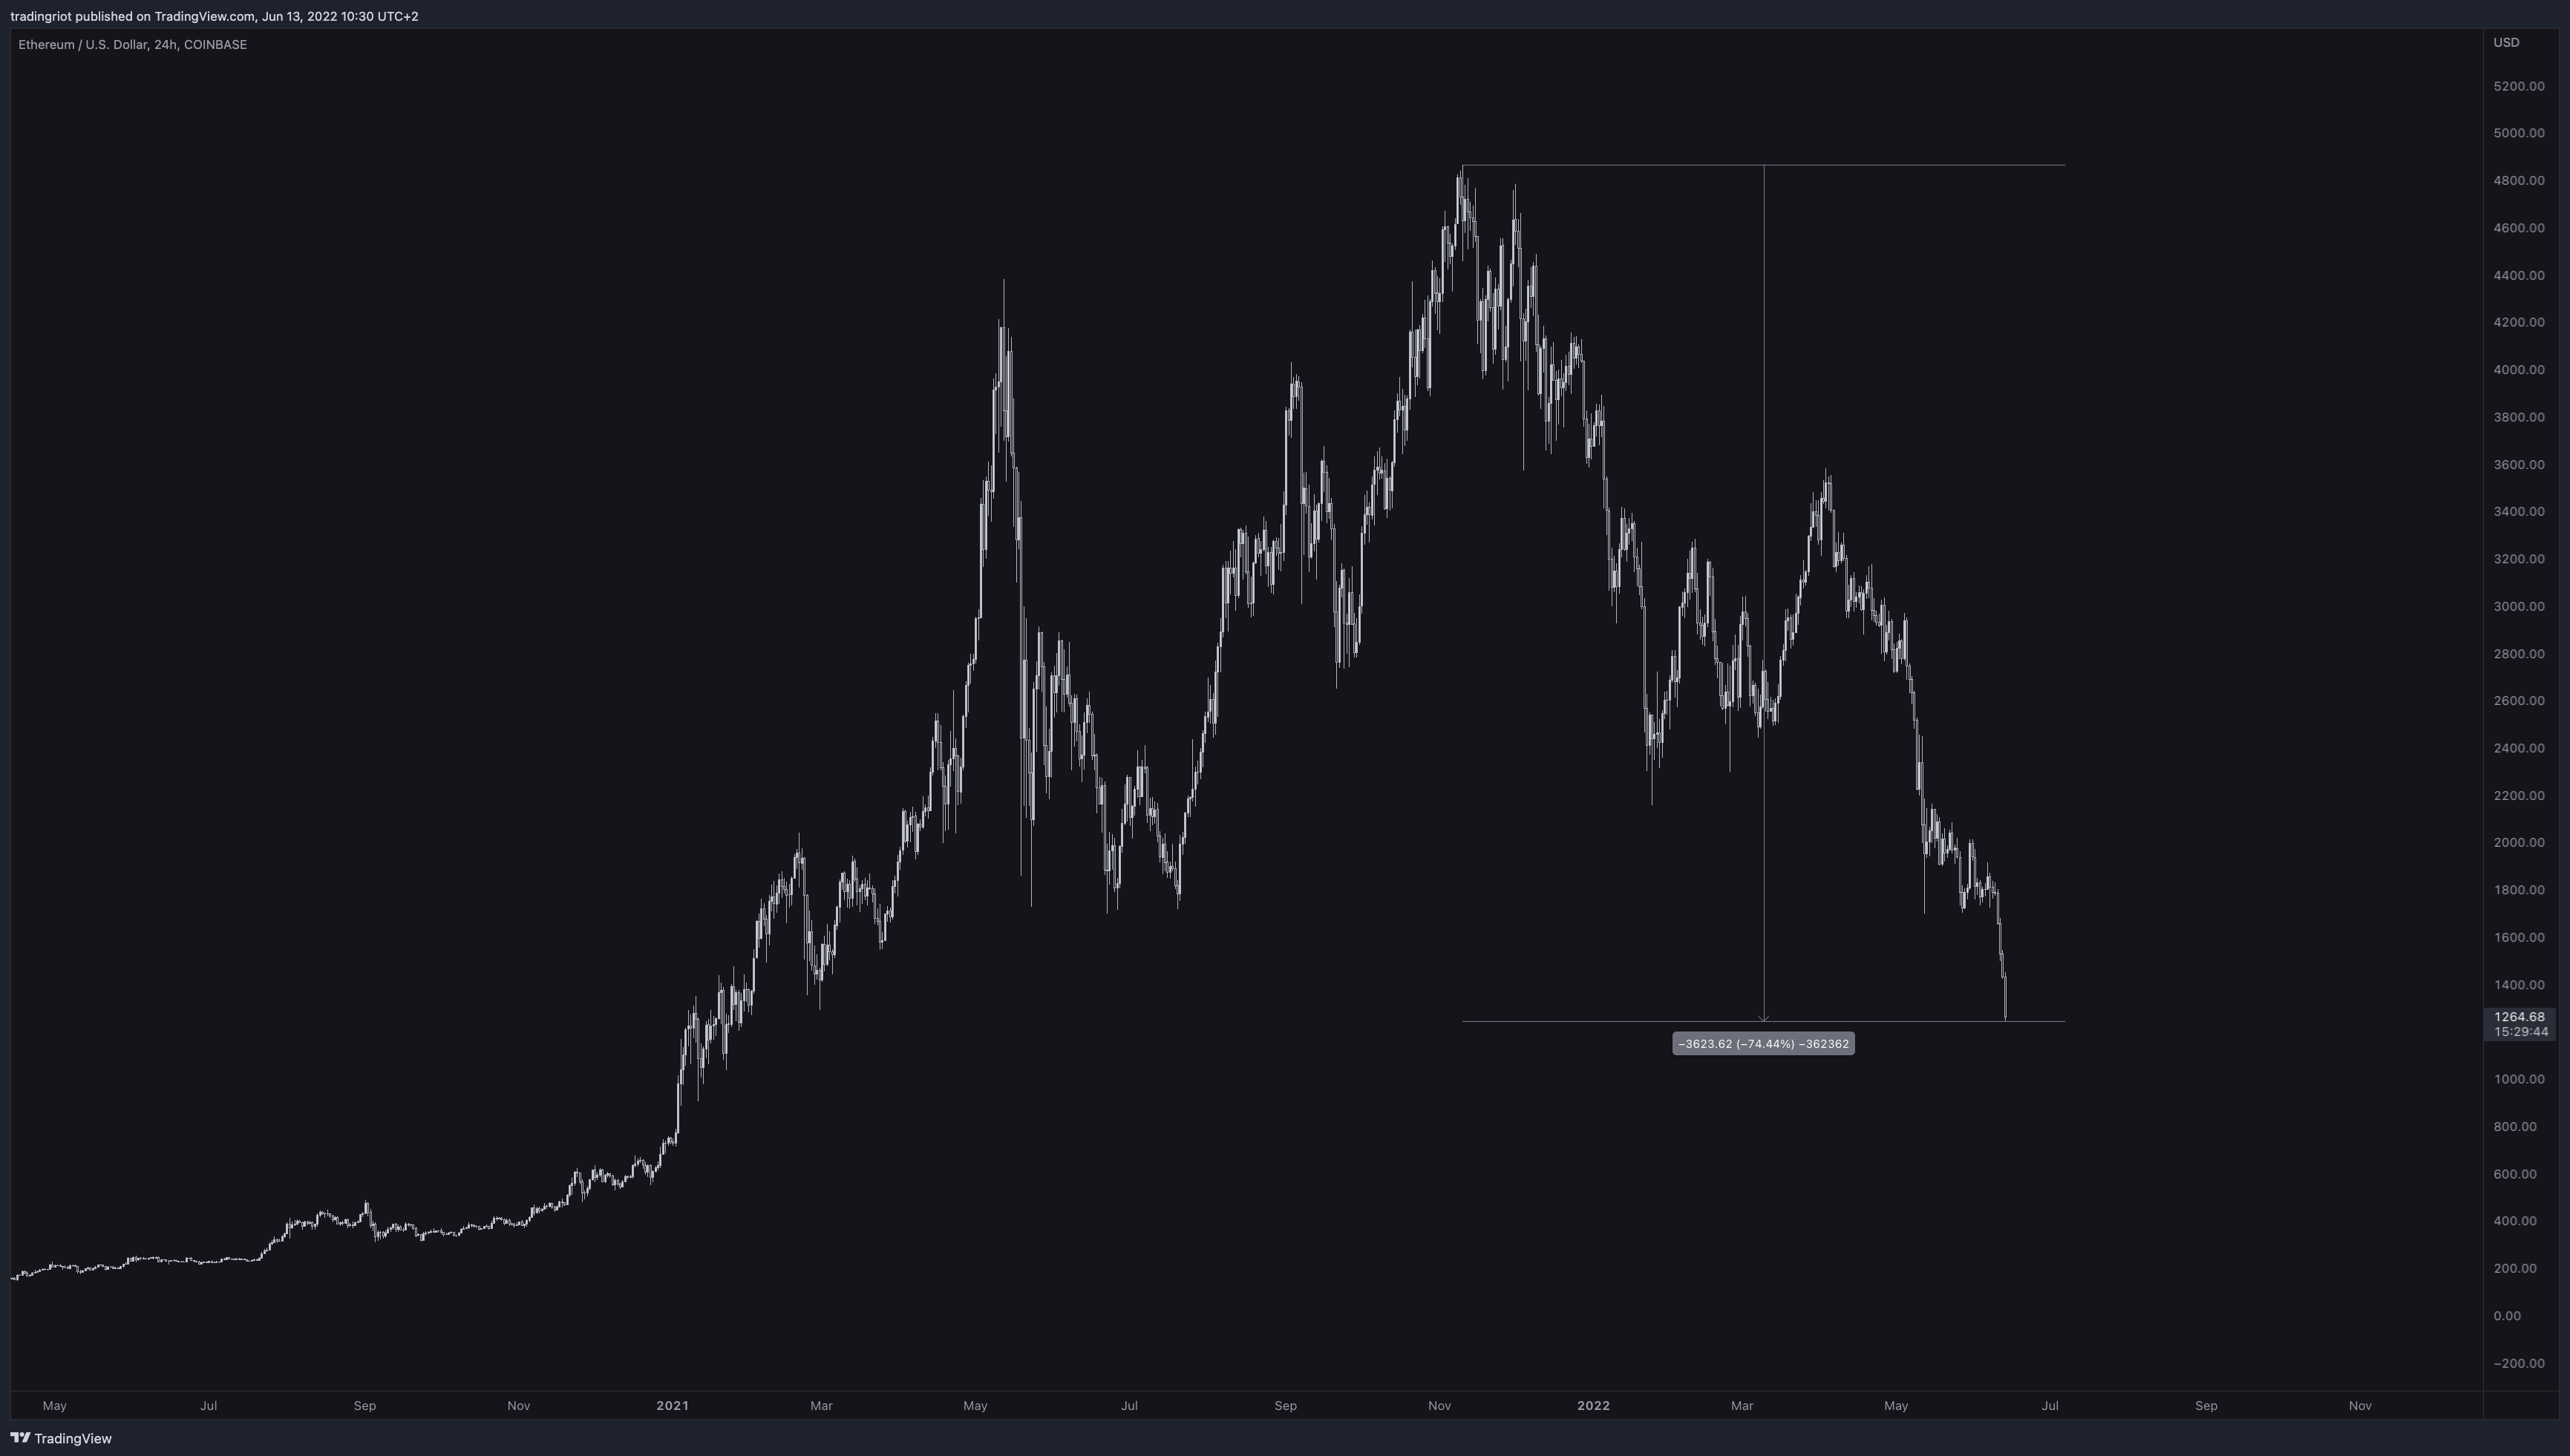
As writing this article, Ethereum is down approximately 75% from its all-time high.
Even if you avoided leverage trading and did not get liquidated, your investment of $10,000 is now worth $2500, and it might take several years from here for you to see any profit, if ever.

Of course, to not just bash crypto, above you can see the Netflix chart, which doesn’t look much better.
When it comes to the markets, people tend to think they know everything, but the longer you stay in any position, you are exposed to more and more uncertainty from all the geopolitical events and news coming your way.
Therefore managing your risk and downside should always be your main goal in trading.
Even if you are wrong on your trading idea, it is always better to bail out from losing a trade to holding and hoping for the best.

Correlations
Another part of conventional wisdom is that you need to diversify.
This is essentially the same, no matter the market you trade.
Crypto, stocks, metals, and forex havest inter-market correlations.
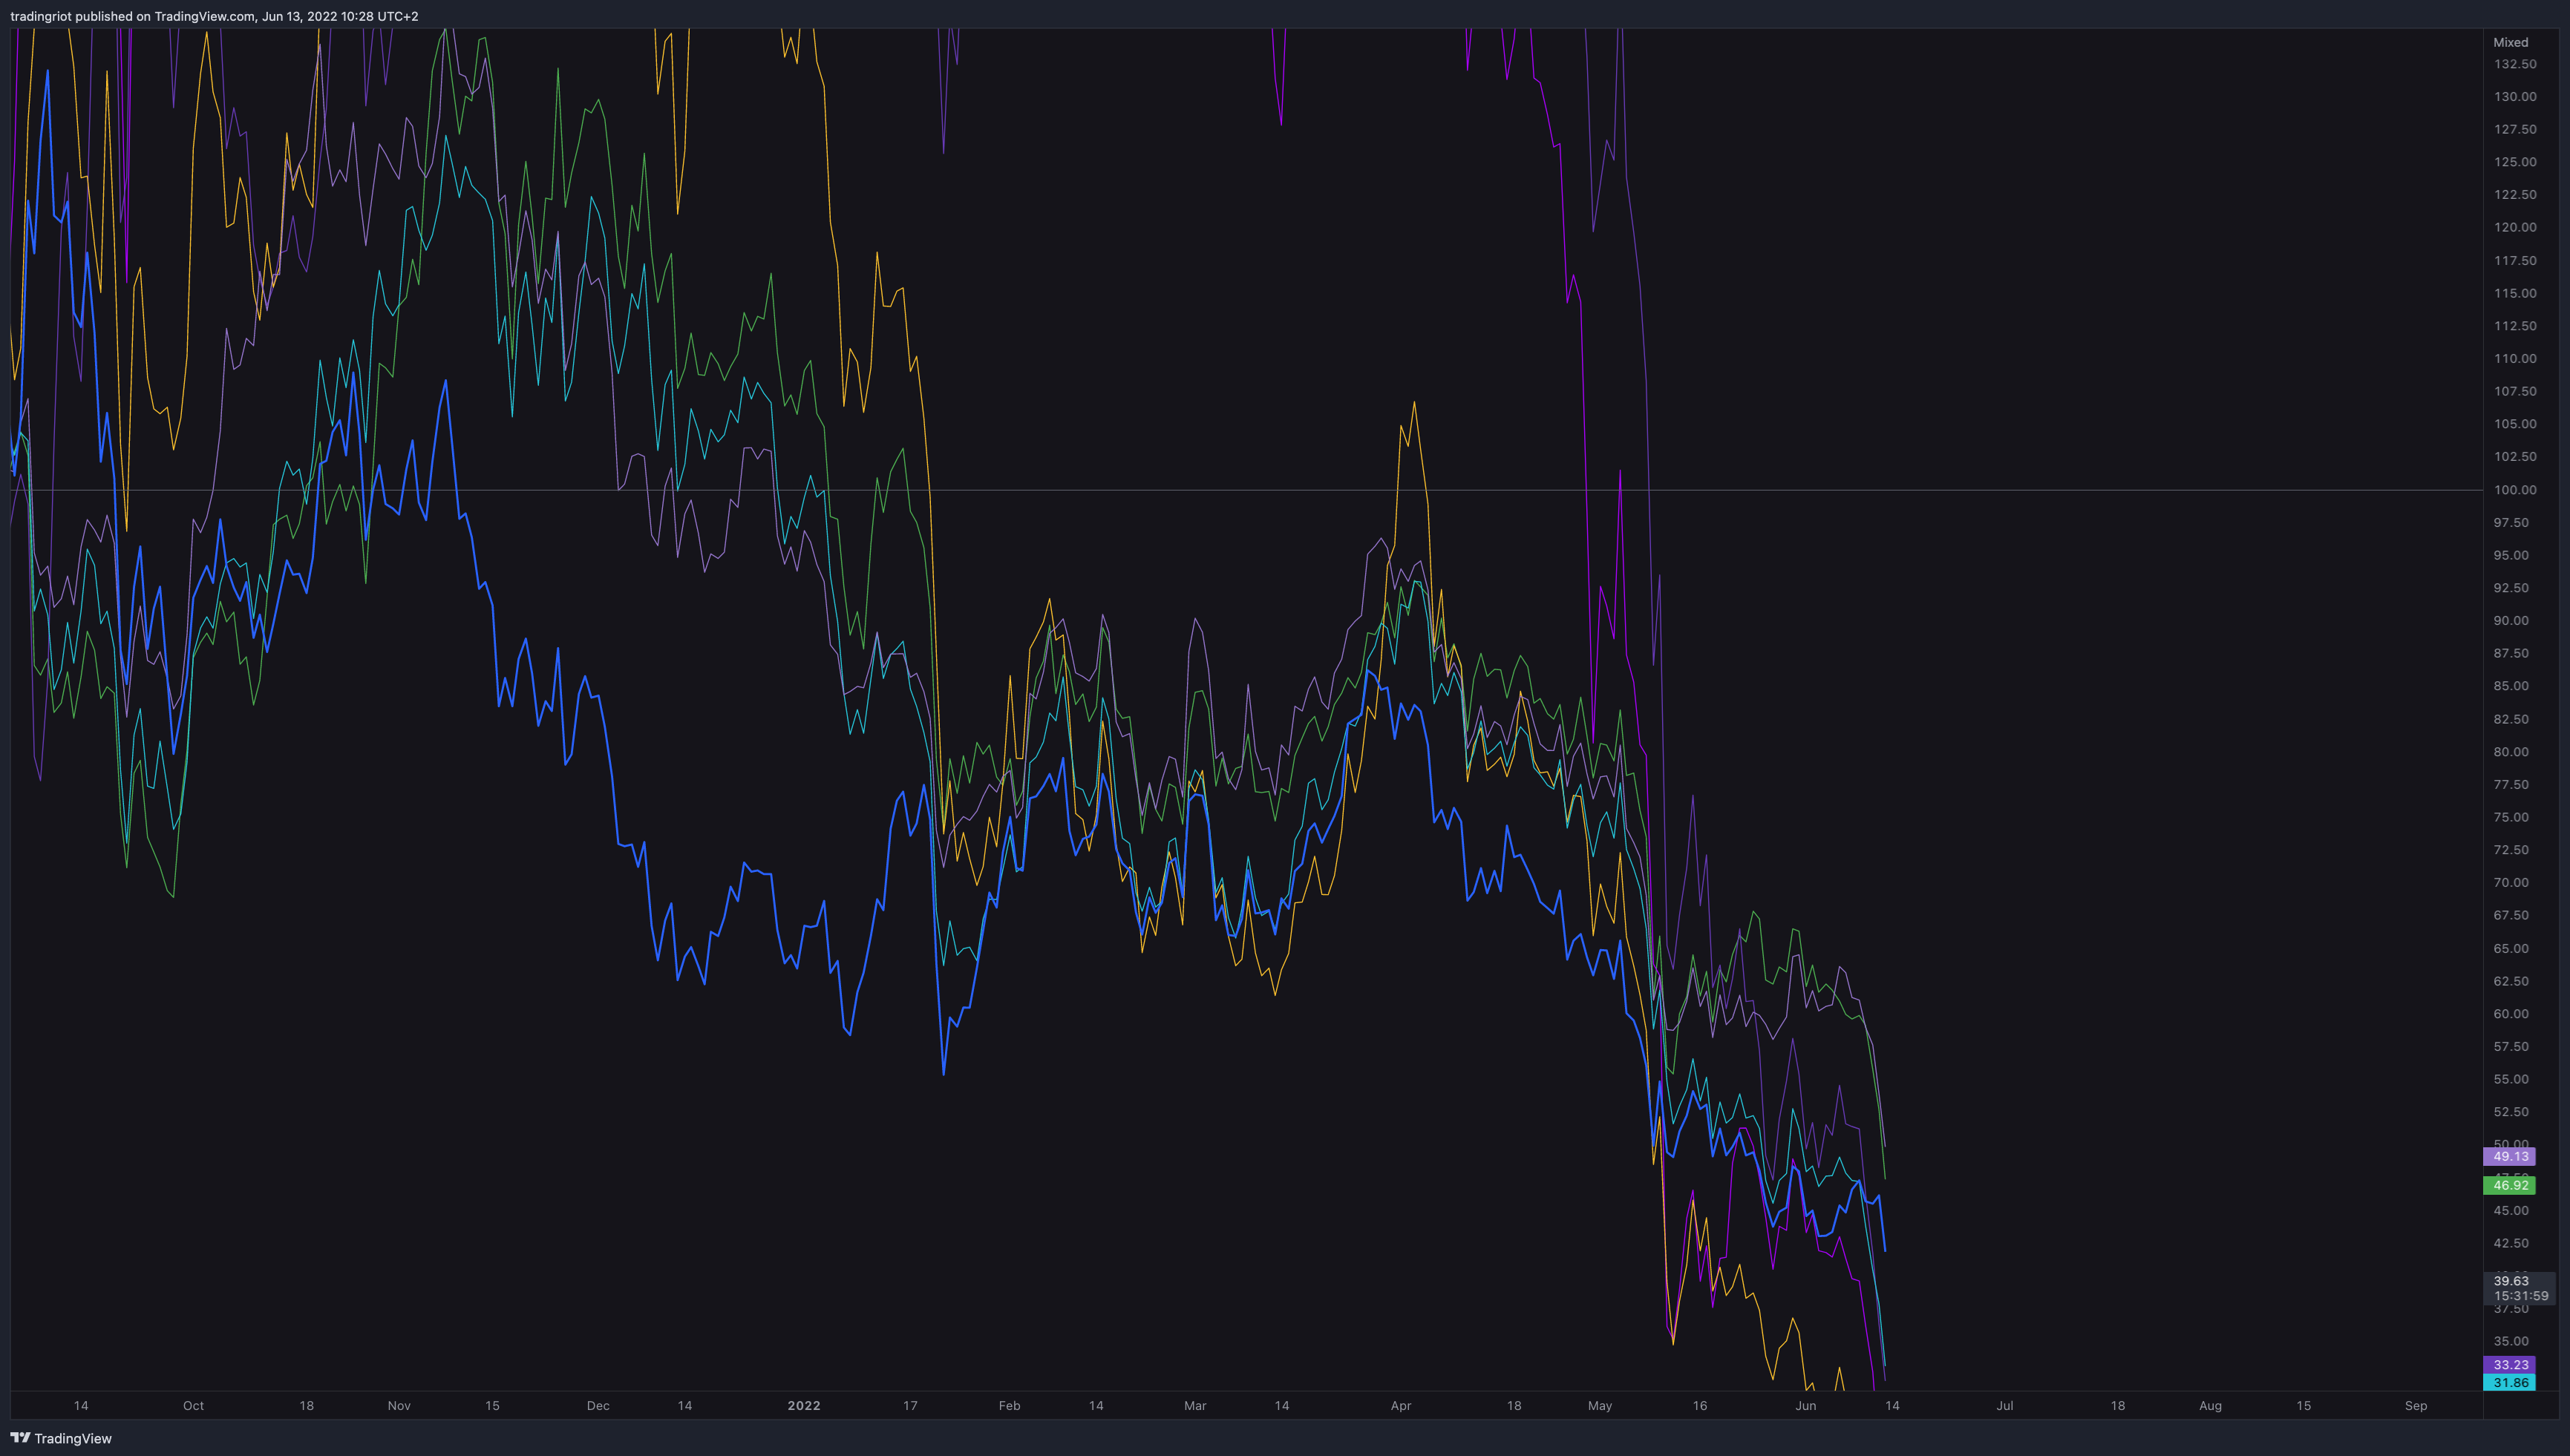
If you look at the chart above, different coloured lines represent other crypto coins.
Without seeing their names, you cannot tell what you are looking at, only because they all follow very similar paths.
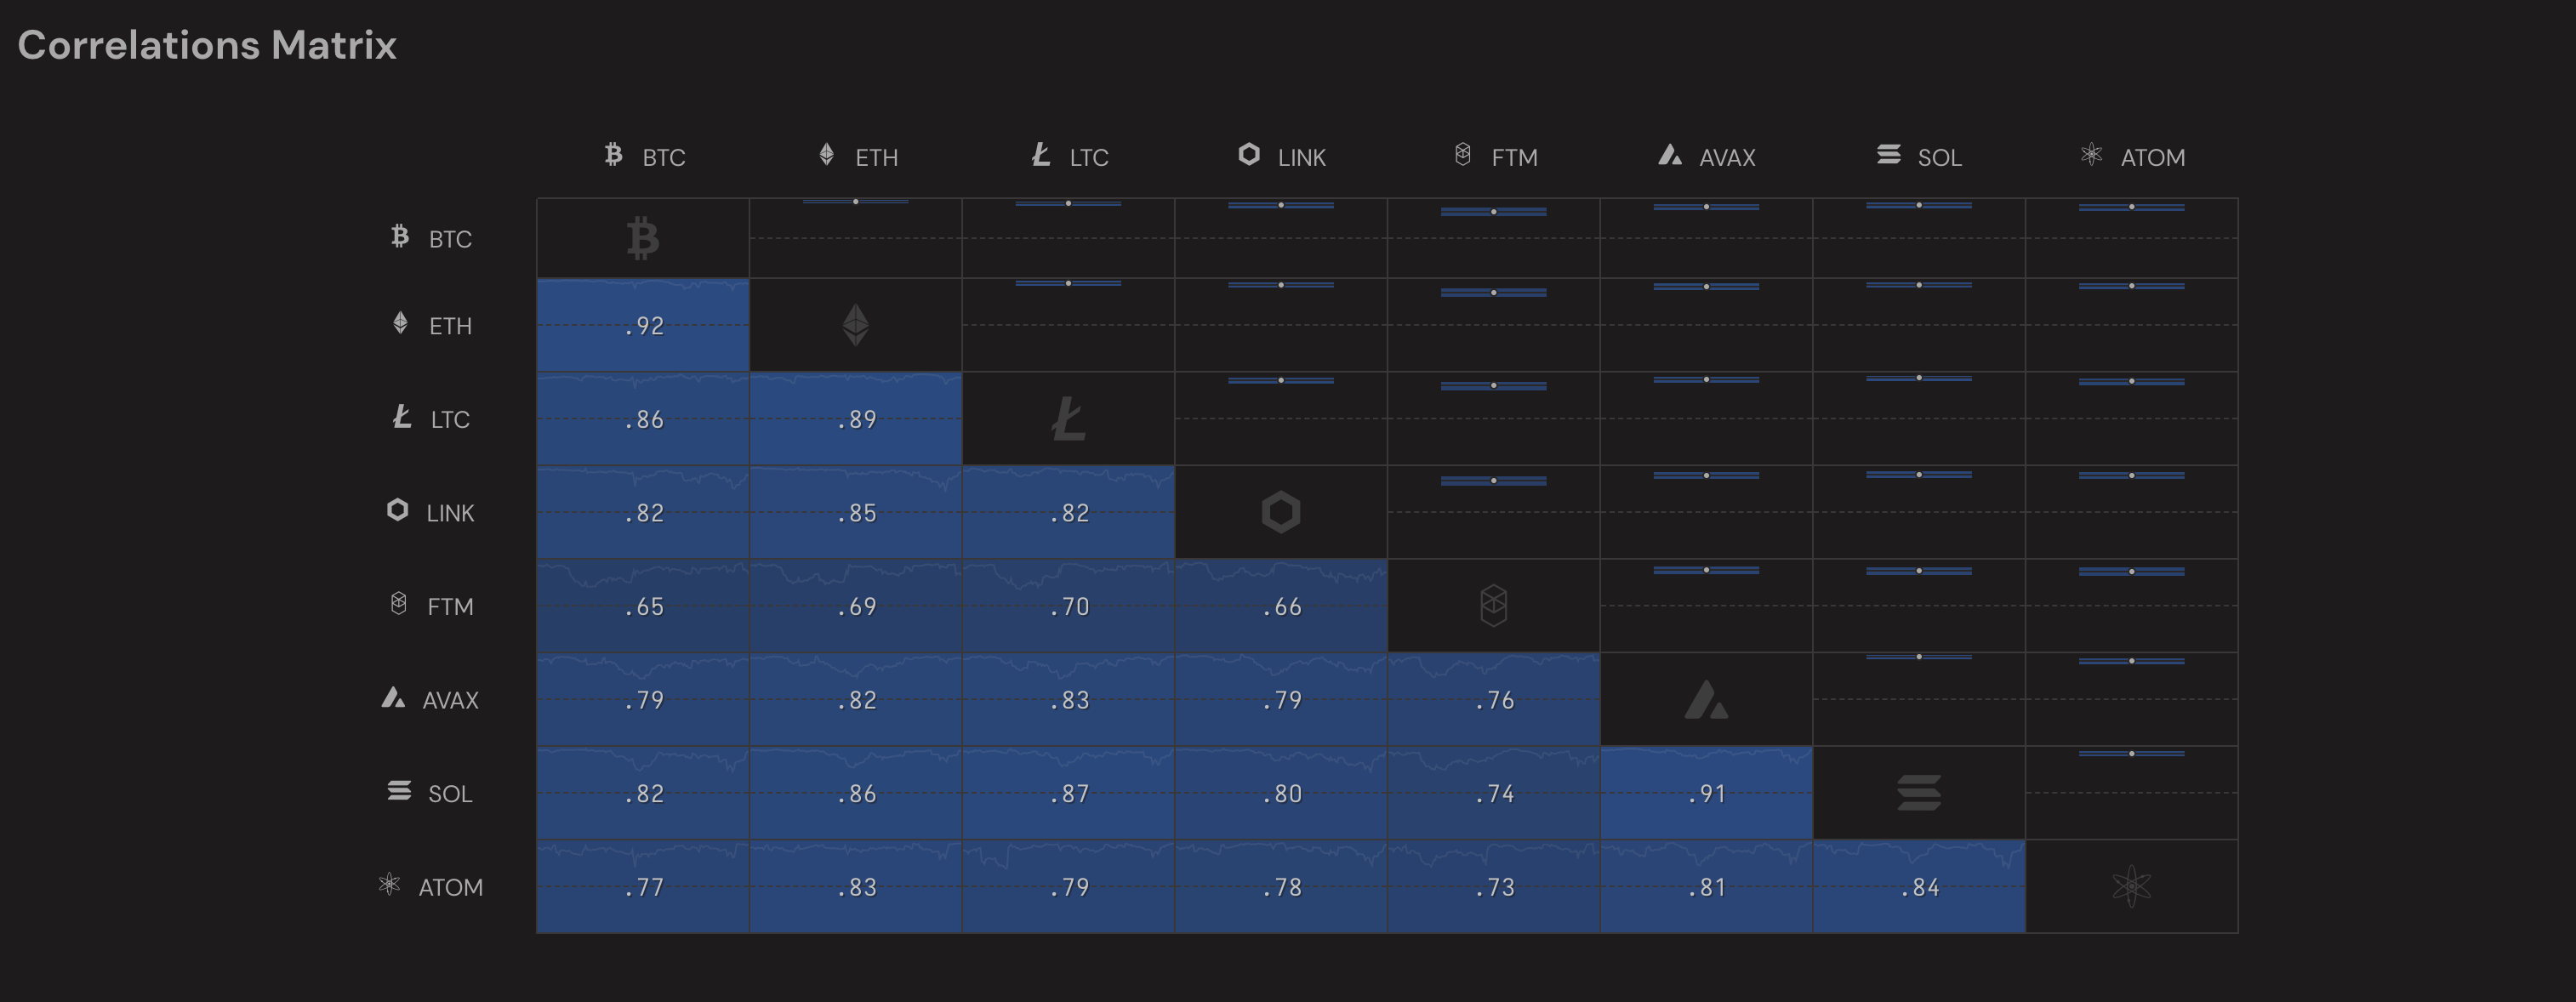
As you can see on the correlation matrix, correlations in crypto are always nearing the one, which means almost 100% correlation.
So if you “diversify” into different projects, you are still just trading the one market with the only difference in beta, which means the % change due to available liquidity in the market.
In theory, if you buy Bitcoin and Solana and Bitcoin rises 50%, Solana might rise 100%.
This is not because Sol is better in any form; it just means there is lower liquidity in the market. Therefore, it is easier to move it higher.
The same goes for the downside; Bitcoin dropping 10% will result in Altcoins going down twice or more.
Once again, it is due to available liquidity in the market.
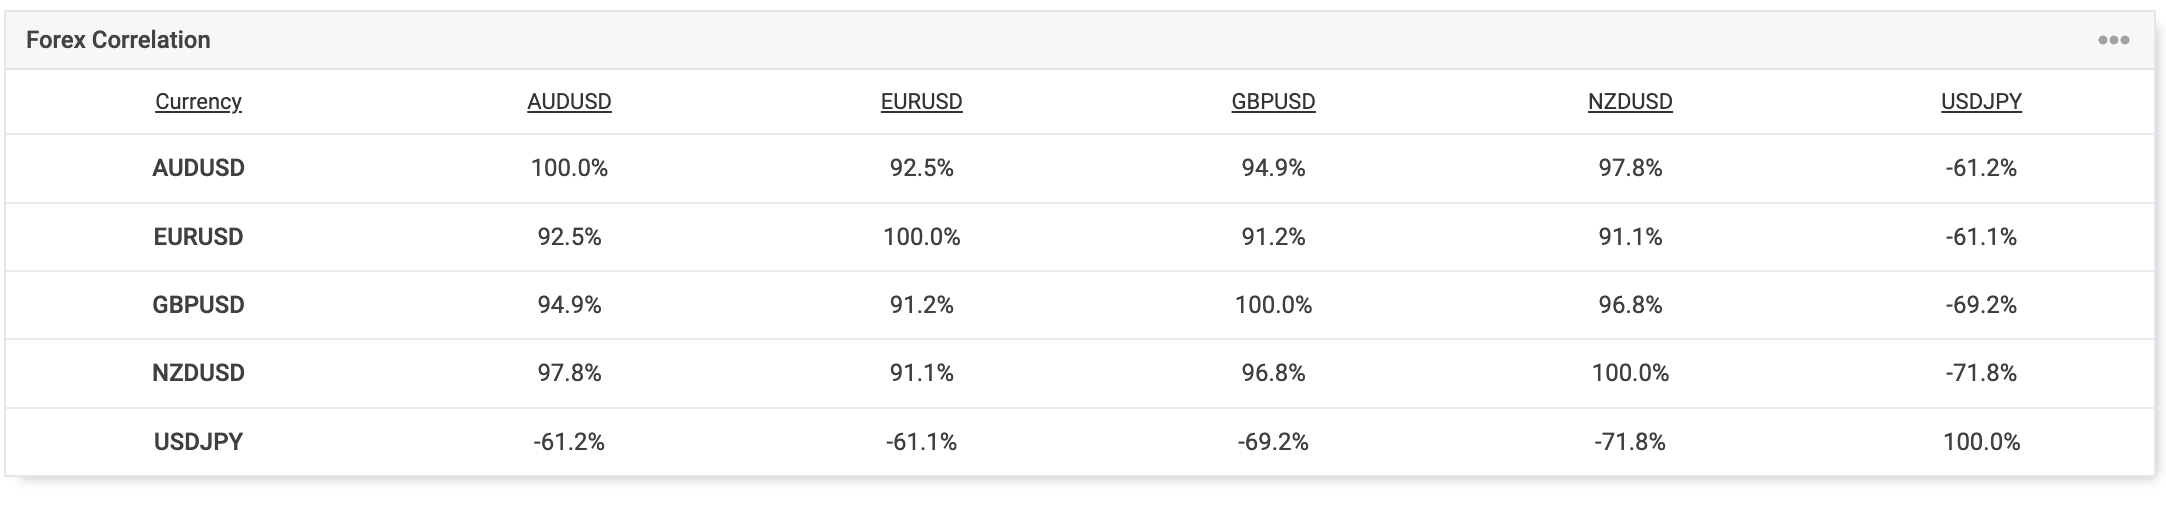
Of course, this is not the only case in crypto; if you look at Forex majors, you can see they are all traded against the US Dollar.
The correlation between EURUSD and GBPUSD is almost 100%.
If you go long on both of these markets, you are expressing the opinion that the US dollar will be weaker; if there is any news that results in strength in US Dollar, there is a high likelihood that both of these positions will end up going against you.
Understanding correlation in markets you are trading is key to managing your risks so you won’t lose more money than anticipated.
Trade expectations and timeframes
One common mistake people tend to make is coming into the trades with wrong expectations when it comes to holding periods.
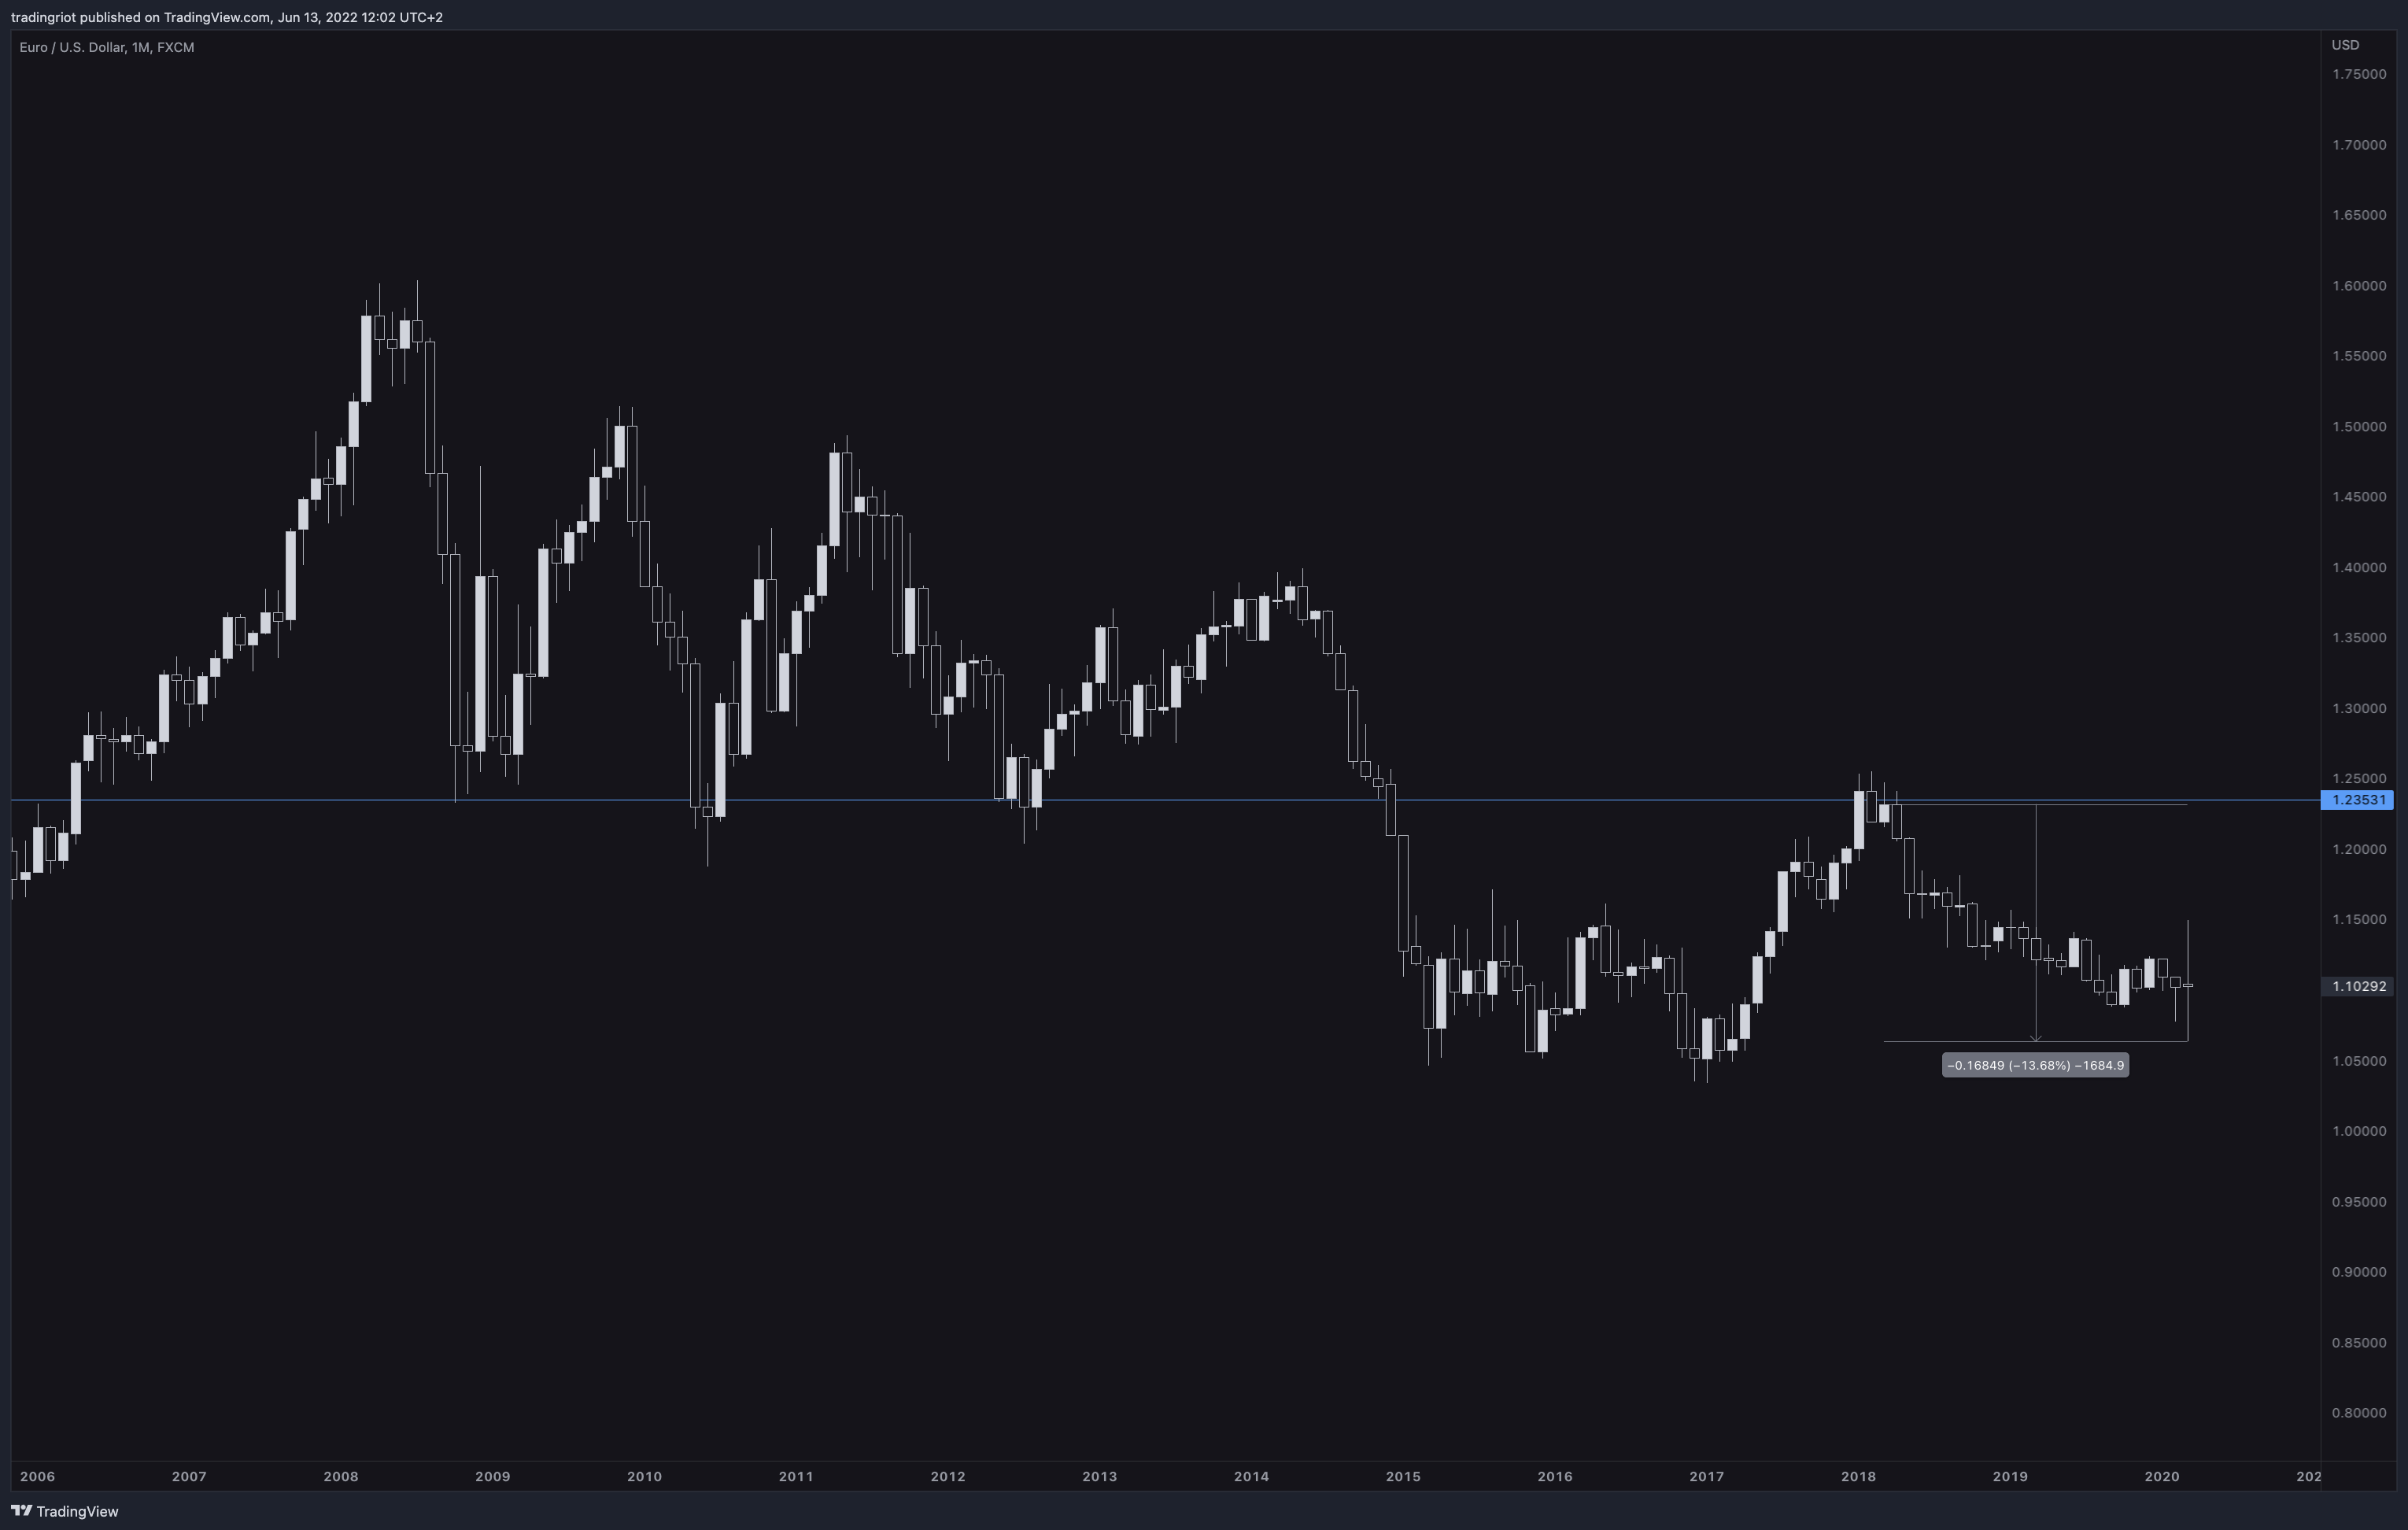
Above, you can see a chart of EUR/USD that sold off after testing the level of resistance which was previously strong support.
In hindsight, this looks very straightforward, but since this is a monthly chart, it took four months before the move
Most traders who would take notice of this monthly level would execute the short position, but after a few days of the price not selling off, they would close the trade.
This is because they come to trade with wrong expectations.
You need to understand that price is fractal; the same behaviour on the monthly chart will happen the same way on weekly, daily, 4-hour, and 1-minute charts.
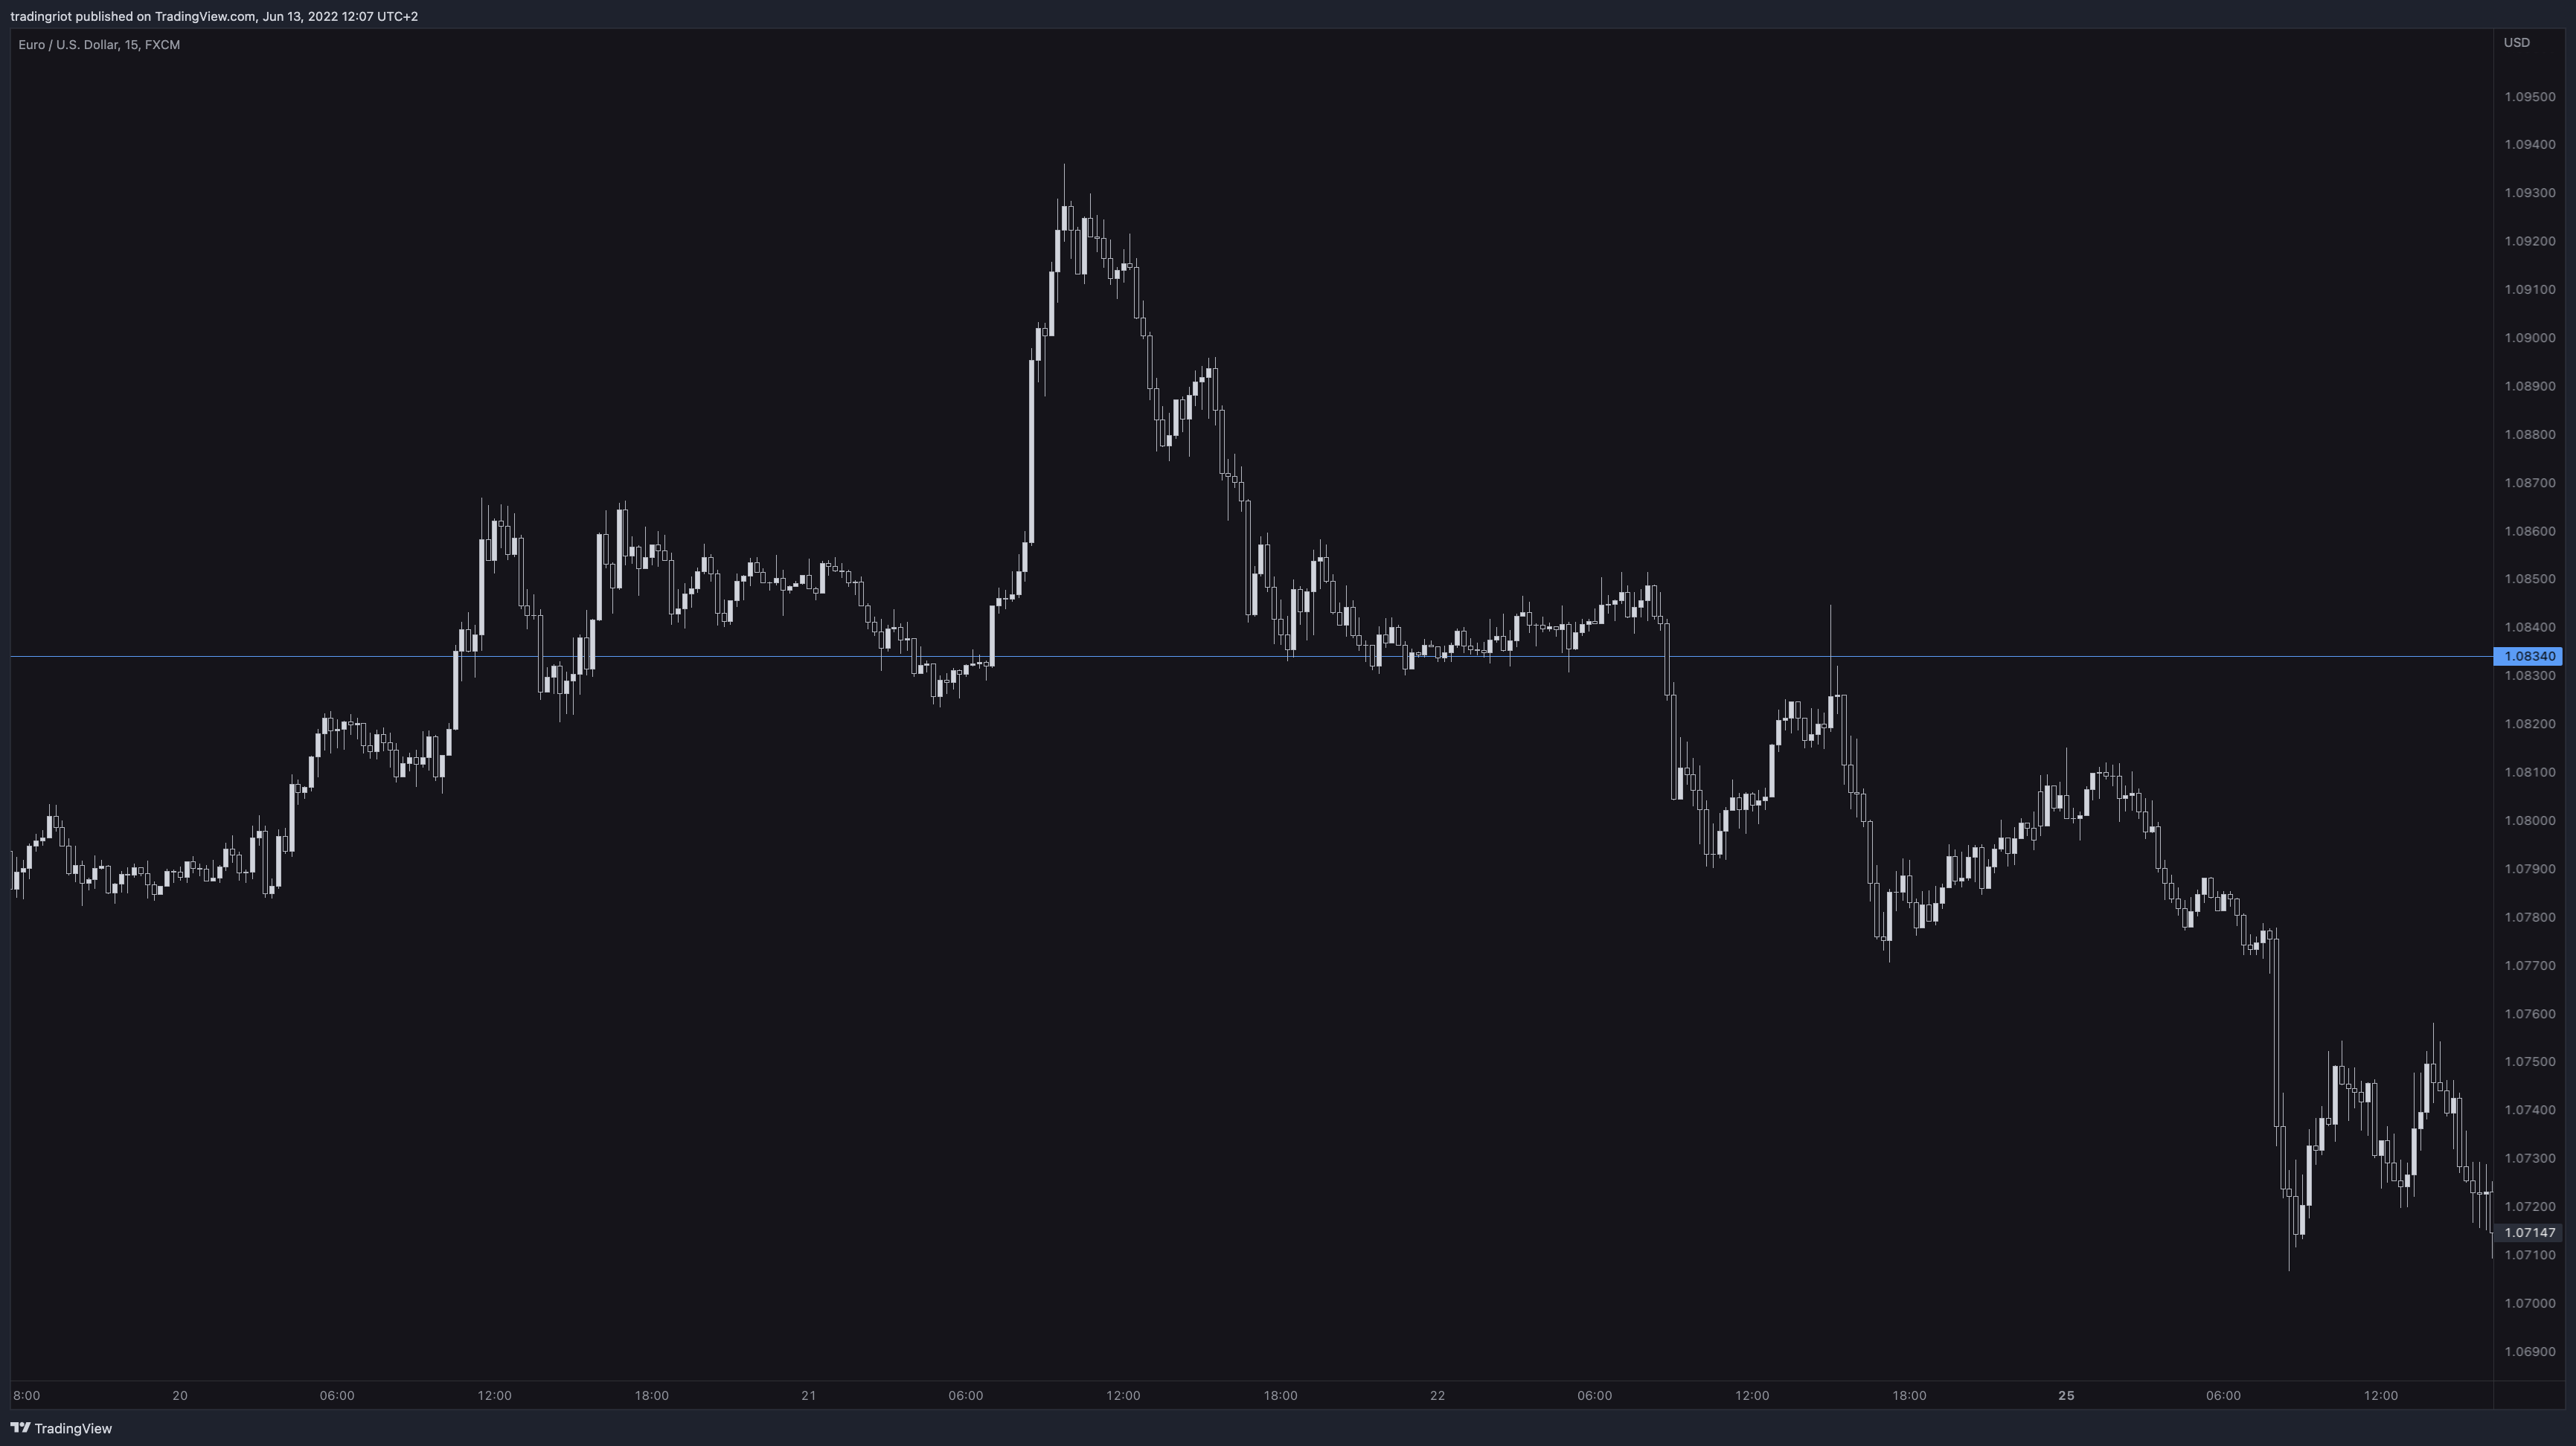
Above, you can see a 15-minute chart of EUR/USD with very similar behaviour to the monthly chart, support turned resistance, and the market sold off.
If I didn’t tell you what timeframe you are looking at, you wouldn’t know if it’s a 15-minute, 5-minute, 7-minute or 8-hour chart.
The main difference between higher and lower timeframes is market movers.
On lower timeframes, markets are, on the most days, moved by speculators and prominent players; therefore, it is more important to emphasise things such as price action, orderflow and so on.
This is beyond the scope of this article, but I cover these things in-depth inside the Tradingriot Bootcamp.
On the other hand, the higher timeframes are driven by fundamentals and macroeconomic events.
Plan to hold the trade for an extended period. Besides levels, you should have a thorough understanding of underlying fundamentals, either if it’s the economic growth of Canada or the upcoming Bitcoin halving.
But no matter what timeframe you trade, you always need to know when to get out from the trade if it goes against you.
Opening a trade on the 5-minute chart should also be managed on the 5-minute chart; if you open a trade based on a daily chart, you should also order it on the daily chart.
Many people emphasise specific timeframes, but it doesn’t matter that much, and I explained why in the Price action article.
The important thing is finding what works for you and sticking to it.
Suppose you open a trade on a daily chart after a small profit. In that case, you get scared by something you see on the 15-minute chart is equally bad as opening a trade on the 1-minute chart and immediately going to the 4-hour chart and trying to run the trade into unrealistic targets.
Hedging
As I already mentioned, a lot of conventional wisdom in crypto will tell you to stay away from leverage and derivatives at all costs.
When used correctly, derivatives can be excellent products not only for directional trading but also for hedging.
If you don’t know what hedging is, it opens a new position to offset potential losses in already existing trade.
At the moment, crypto is having a hard time in the depths of a bear market and trading at around $24,000.
Some traders might think this is an excellent spot to buy bitcoin, and since they execute the trade in the spot market, they don’t bother to put any stop-loss or protect their capital.
Let’s see if you can be a little smarter about the situation.
You have bought 1 BTC for $24,000, and you want to protect your trade without using a hard stop-loss so that you won’t get wicked out in volatility.
What you can do is a long 1BTC put option that expires at the end of the year, meaning your position is protected for the upcoming six months.
Lets look at two scenarios where Bitcoin moved 50% from $24,000 in these six months.
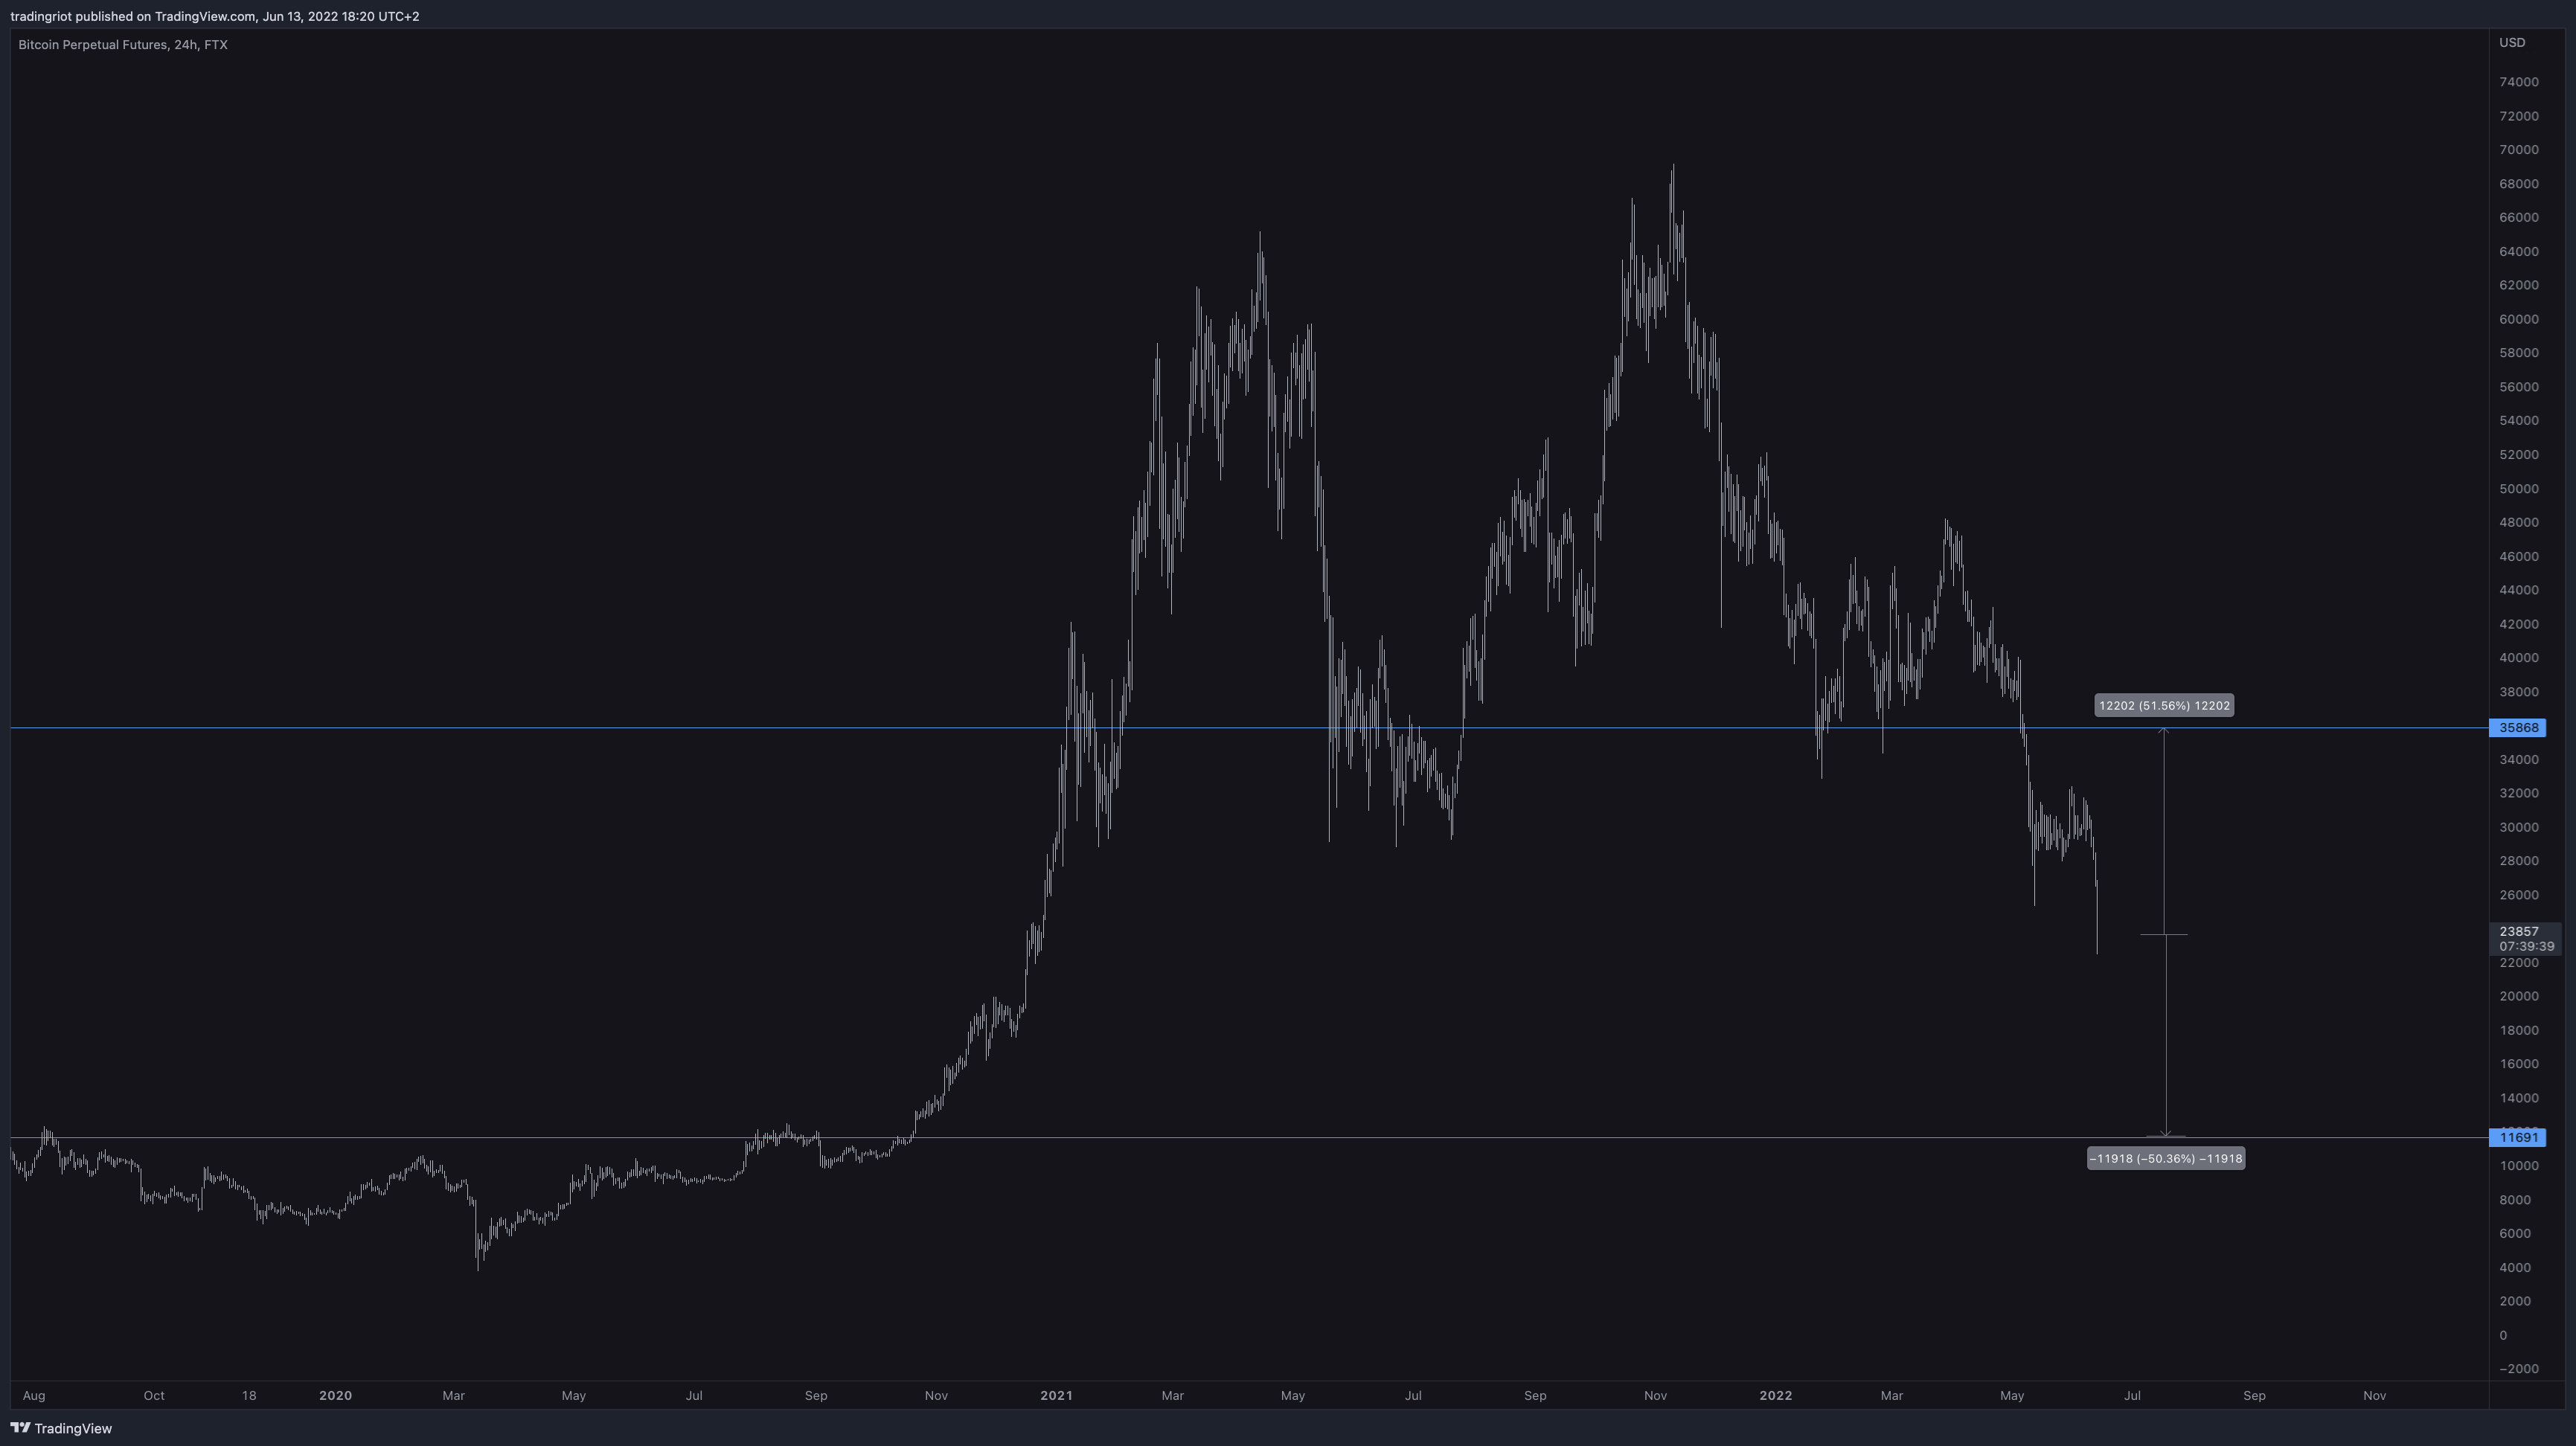
In the first example, Bitcoin is trading at $12,000 at the end of the year, meaning you were wrong on your original idea of buying 1BTC at 24k.
But, buying a put option means you are making money as long as the underlying goes lower.
For more information about options, visit the article about derivatives.

Although you were wrong on the original trade idea, Bitcoin decreased 50%, and you lost $12,000 on your 1BTC purc; the option made $9,450, meaning your overall loss is $2500.
That’s much better than losing $12,000.

If Bitcoin reaches $36,000, your put option realises a loss of approximately $7,500.
This will put your overall profit to $4500 instead of $12,000.
Of course, making $4500 instead of $12,000 is not great, but compared to the situation when the price goes against you, and you are just glad you are hedged when a trade goes your way, traders tend to close the options much sooner or decrease the size.
Options are excellent products for hedging, and this way, the simples example I could provide.
Vertical and horizontal option spreads are viral hedging strategies. If you want to explore more about them, there are plenty of resources online, or you can see this free medium series by Romano about Options.
Position management
It is relatively easy to open a trade; you just click a few buttons and suddenly are in a trade.
The real work starts when you are in a trade.
Whenever you are in trade, your main priority should be protecting your downside.
The edge in any trading system doesn’t rely on the outcome of trade but large series of works.
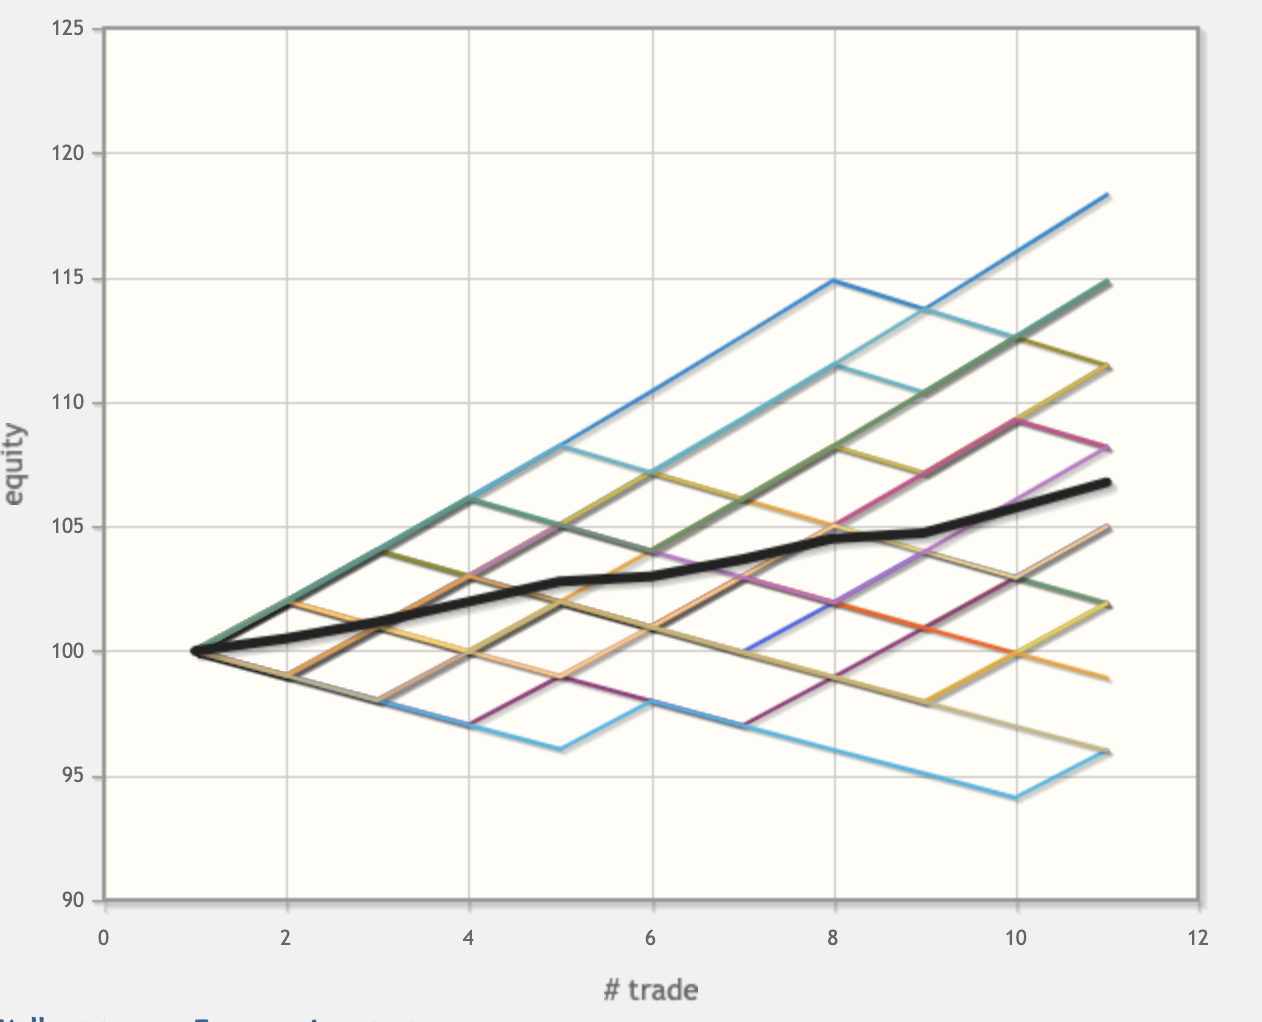
Once again, this is easily demonstrated on the equity curve simulator.
If we take a simple strategy with a 50% win rate and 2:1 reward-to-risk ratio, you can notice that the equity after ten trades is reasonably random.
Some simulations end up in profits, some in a loss.
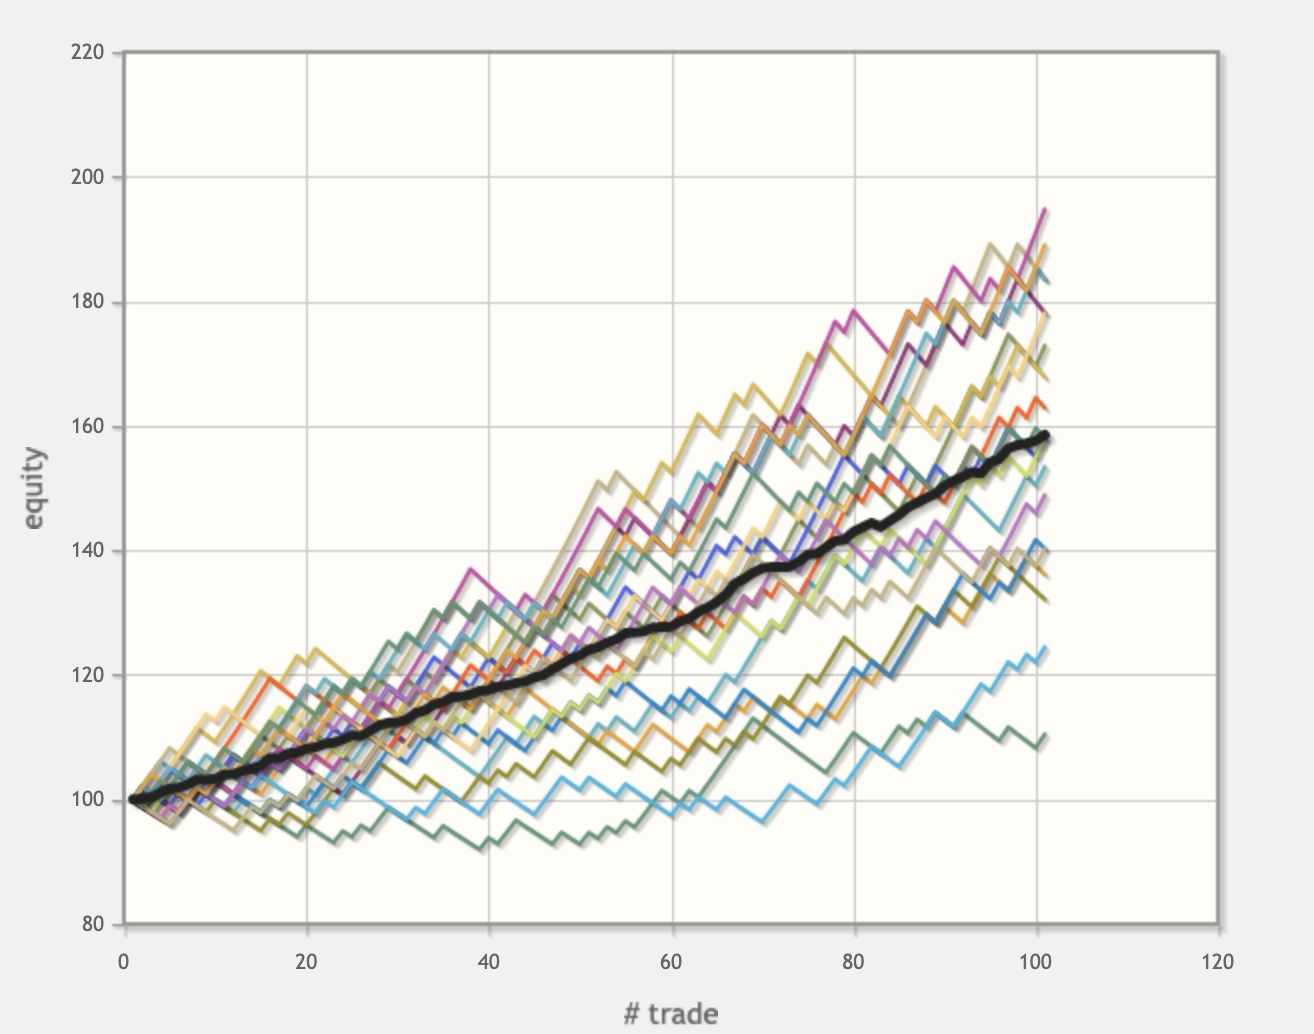
If we plot the same strategy over 100 trades, the results are very different, and all equity simulations result in profit.
As I mentioned, trading with a stop-loss is not mandatory but highly recommended for most people.
In an article about Risk Management, I covered the essential things about trade management, such as using a stop-loss, evolving R, breakevens and taking partial profits.
As I don’t like to repeat things on this blog, I highly recommend you to read the article here.
Something I haven’t covered is pyramiding.
Pyramiding
Pyramiding is the process of increasing the size of successful trades.
It has to be well thought through, but you can increase your winning in trending environments when done correctly.
The key to proper pyramiding is not to increase the risk of your overall position and only use profits as your additional risk.

If we look at this Bitcoin trade, for example, you can see that the Reward to risk on this trade is 6:1.
If you risk $1000 and the trade hits your target, you will make $6000.
Let’s now have a look at how pyramiding can affect this position.
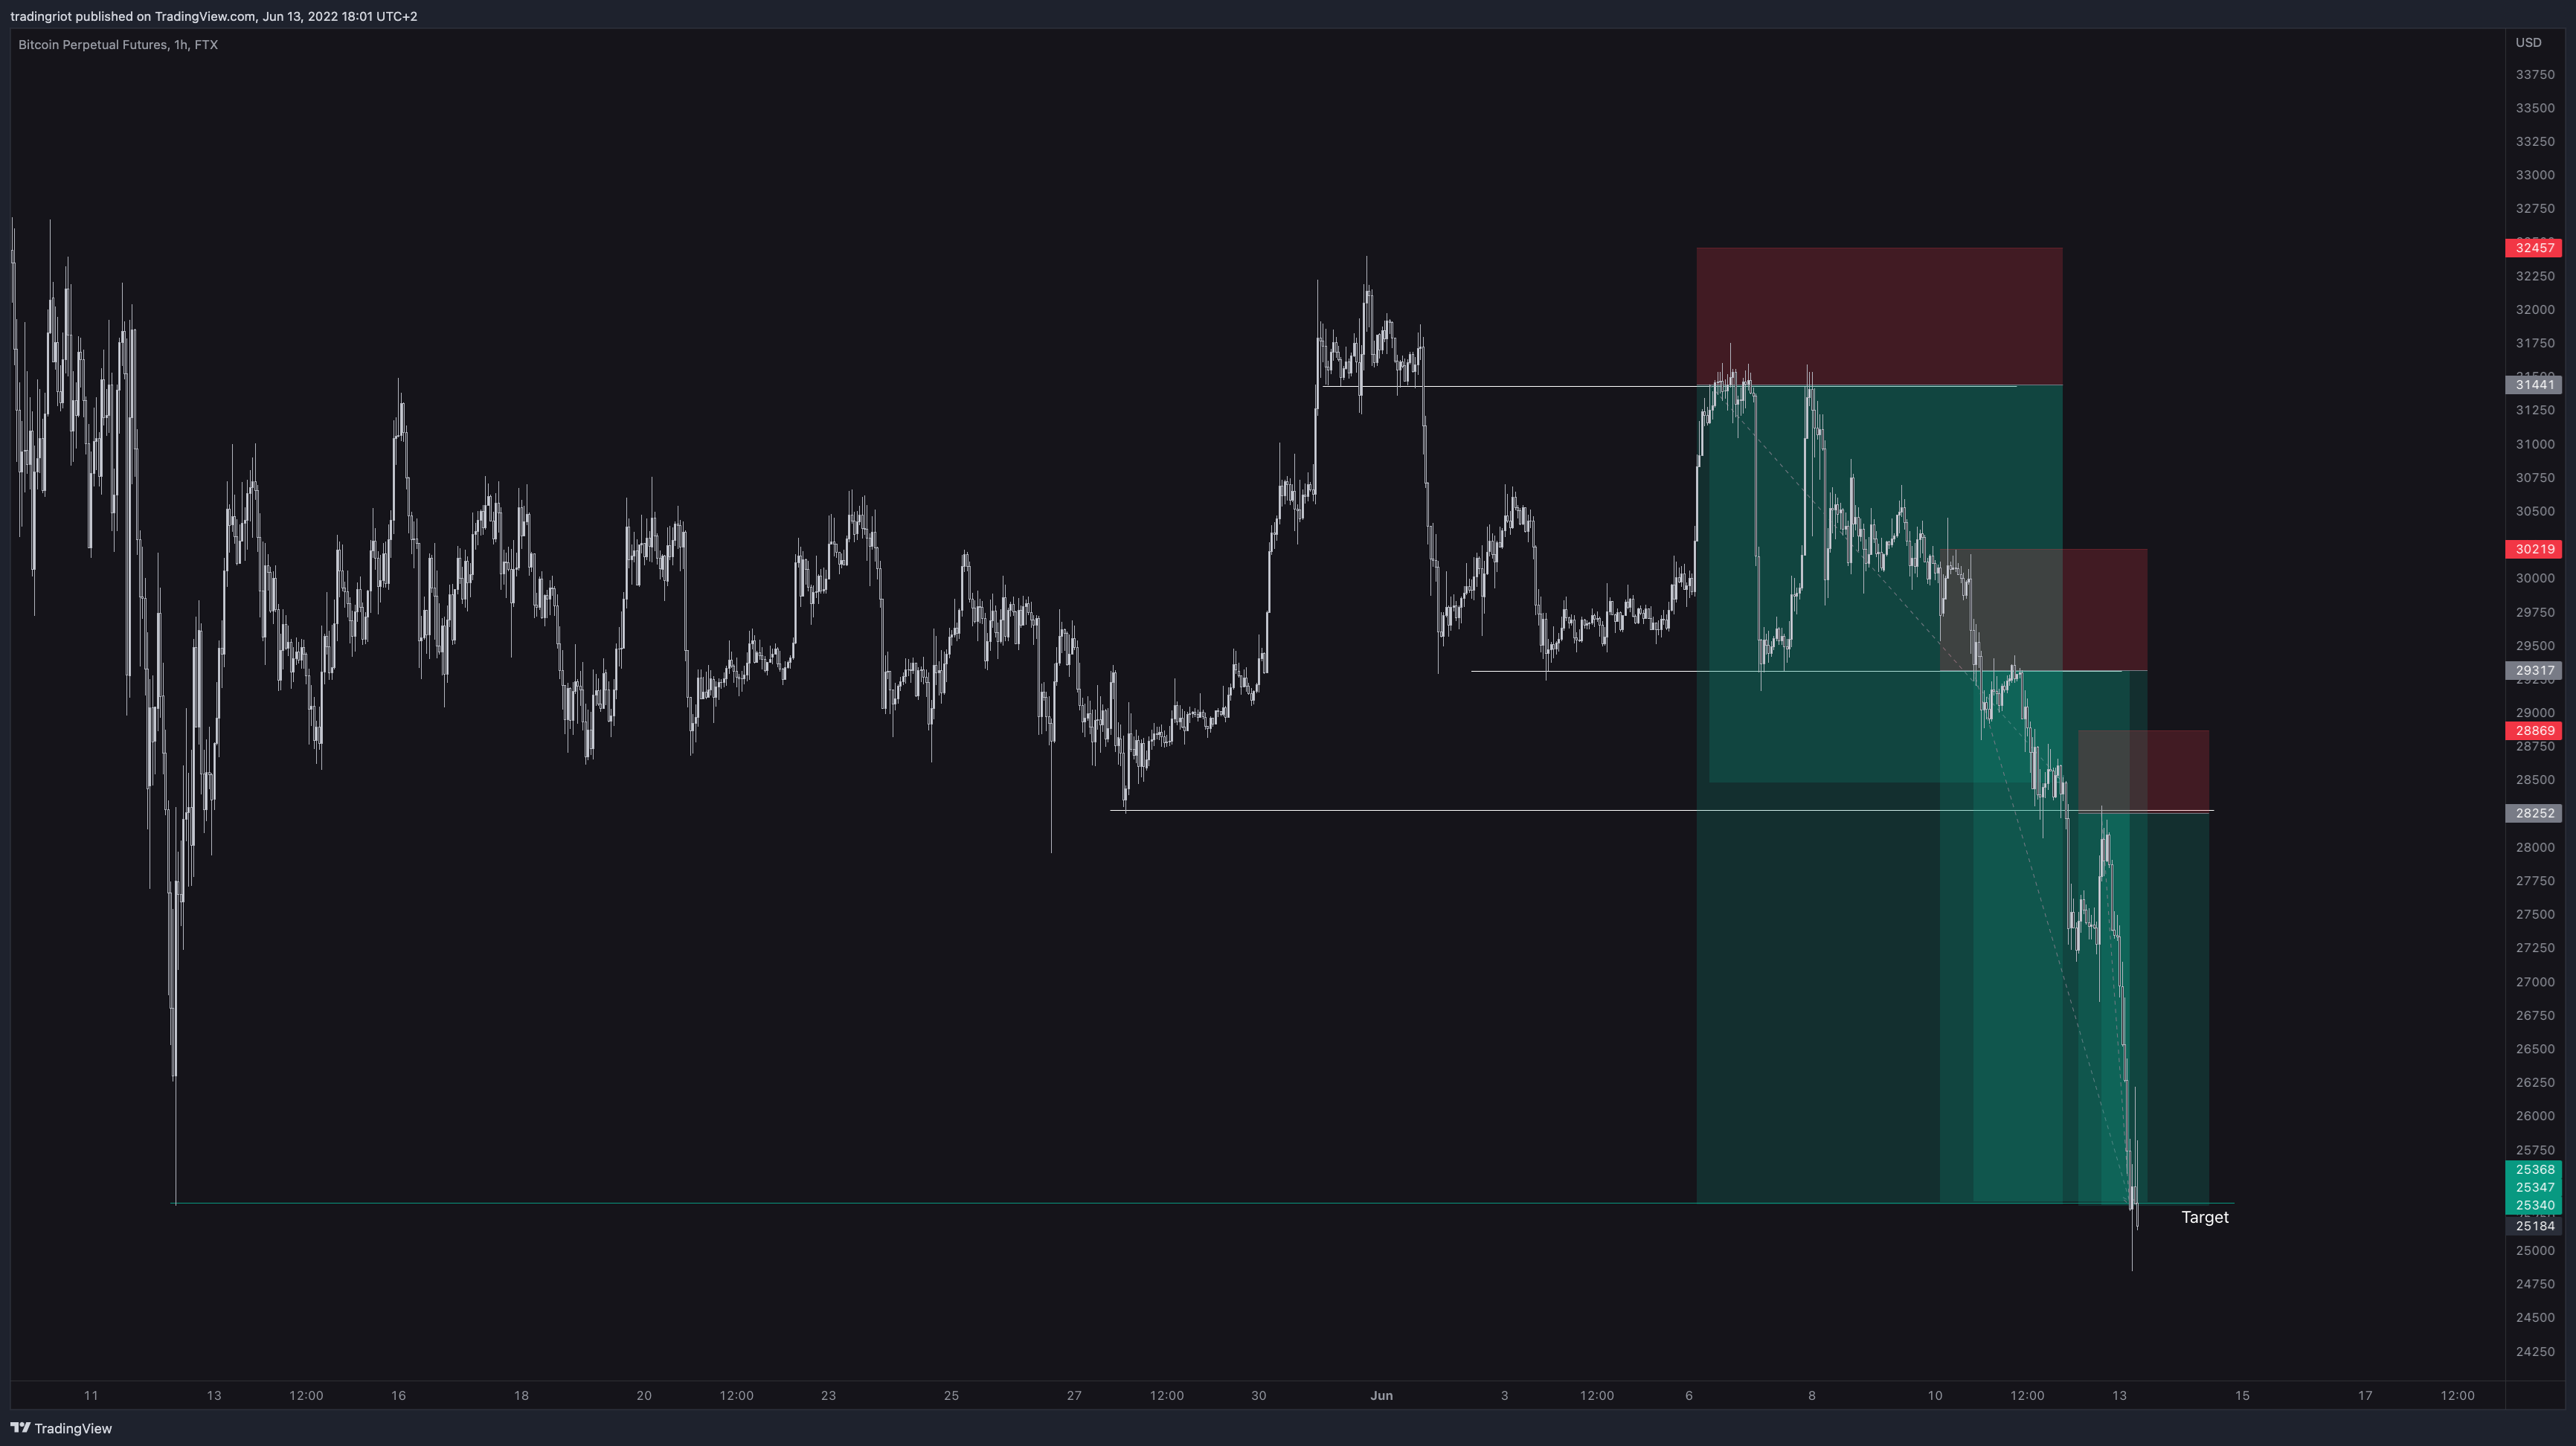
After the trade flips the first level of support and resistance, you are in profit of 2R, or in other words, $2000.
You can now add to your position and trail your stop-loss to a new invalidation level marked on the chart.
If the market hits your stop-loss, you will lose $2000 from unrealised PnL.
As trade goes your way, you are in another 1R profit, therefore another $2000.
You will again open a new trade on the retest, risking $4000 from uPnL.
When trade hits the target, the final position realises 4.5R or, in other words, $18,000.
That is a huge difference compared to the original profit of $6000.
Of course, this was a perfect scenario where everything goes your way.
In many cases, the market would hit your stop, and you would lose all your potential profits; you cannot pyramid every trade.
Pyramiding should only be done on trades with high conviction backed by your trading journal and experience.
Also, as already mentioned, when you are pyramiding, you should never risk more than your original unit of risk.
Conclusion
Many people come to financial markets seeing the quick gains and easy part to fortune; they will very quickly find out how wrong they are.
Managing your trades and protecting your capital should always be your utmost priority when speculating in financial markets.
Always cover your risks while having realistic expectations for every position.
If you can manage your trades correctly, you will grow your account steadily but also be able to catch a big winner when conditions are right.