
Understanding Liquidity in Trading – is someone hunting your stops?
Regarding trading buzzwords, the word “liquidity” is very popular to throw around.
Most price action trading strategies nowadays put high emphasis on concepts of liquidity and constant attempts of markets “hunting stops” of retail traders in order to initiate larger moves.
Is this really the case? Is there really someone sitting behind the curtain hunting your stop-loss and can you gain a trading edge from using different tools that display “liquidity” in markets?
This is what we are going to find out in this article where I cover everything you need to know about liquidity and how to implement some of the popular concepts in your trading.
If you like this article, read the rest of the blog or join the Tradingriot Bootcamp for a comprehensive video course, access to private discord, and regular updates.
For those who are looking for a new place for trading crypto, make sure to check out Woo. If you register using this link and open your first trade, you will get a Tier 1 fee upgrade for the first 30 days, and we will split commissions 50/50, which means you will get 20% of all your commissions back for a lifetime. On top of that, you will receive a 20% discount for Tradingriot Bootcamp and 100% free access to Tradingriot Blueprint.
Table of Contents
What is liquidity?
Although you very often hear liquidity described as “stop losses of other traders” this is actually not a very accurate description of what liquidity actually is.
I will talk about stops later on, but at its core, liquidity simply represents resting limit orders in any given market.

The picture above shows available liquidity for BTCUSDT on Binance.
For simplicity and better understanding, I increased grouping to $50 for each price point.
As you can see from the image there are 70.827BTC willing to buy at 28900 and 16.608 BTC willing to sell at 28950.
You can think about these levels as floors and ceilings below and above price as markets won’t be able to advance higher or lower by $50 as long as someone is going to either buy into those 16.608 BTC at the offer or sell into those 70.827 BTC at the bid.
In the order book (often also called ladder, or depth of market (DOM)), you can only see limit orders.
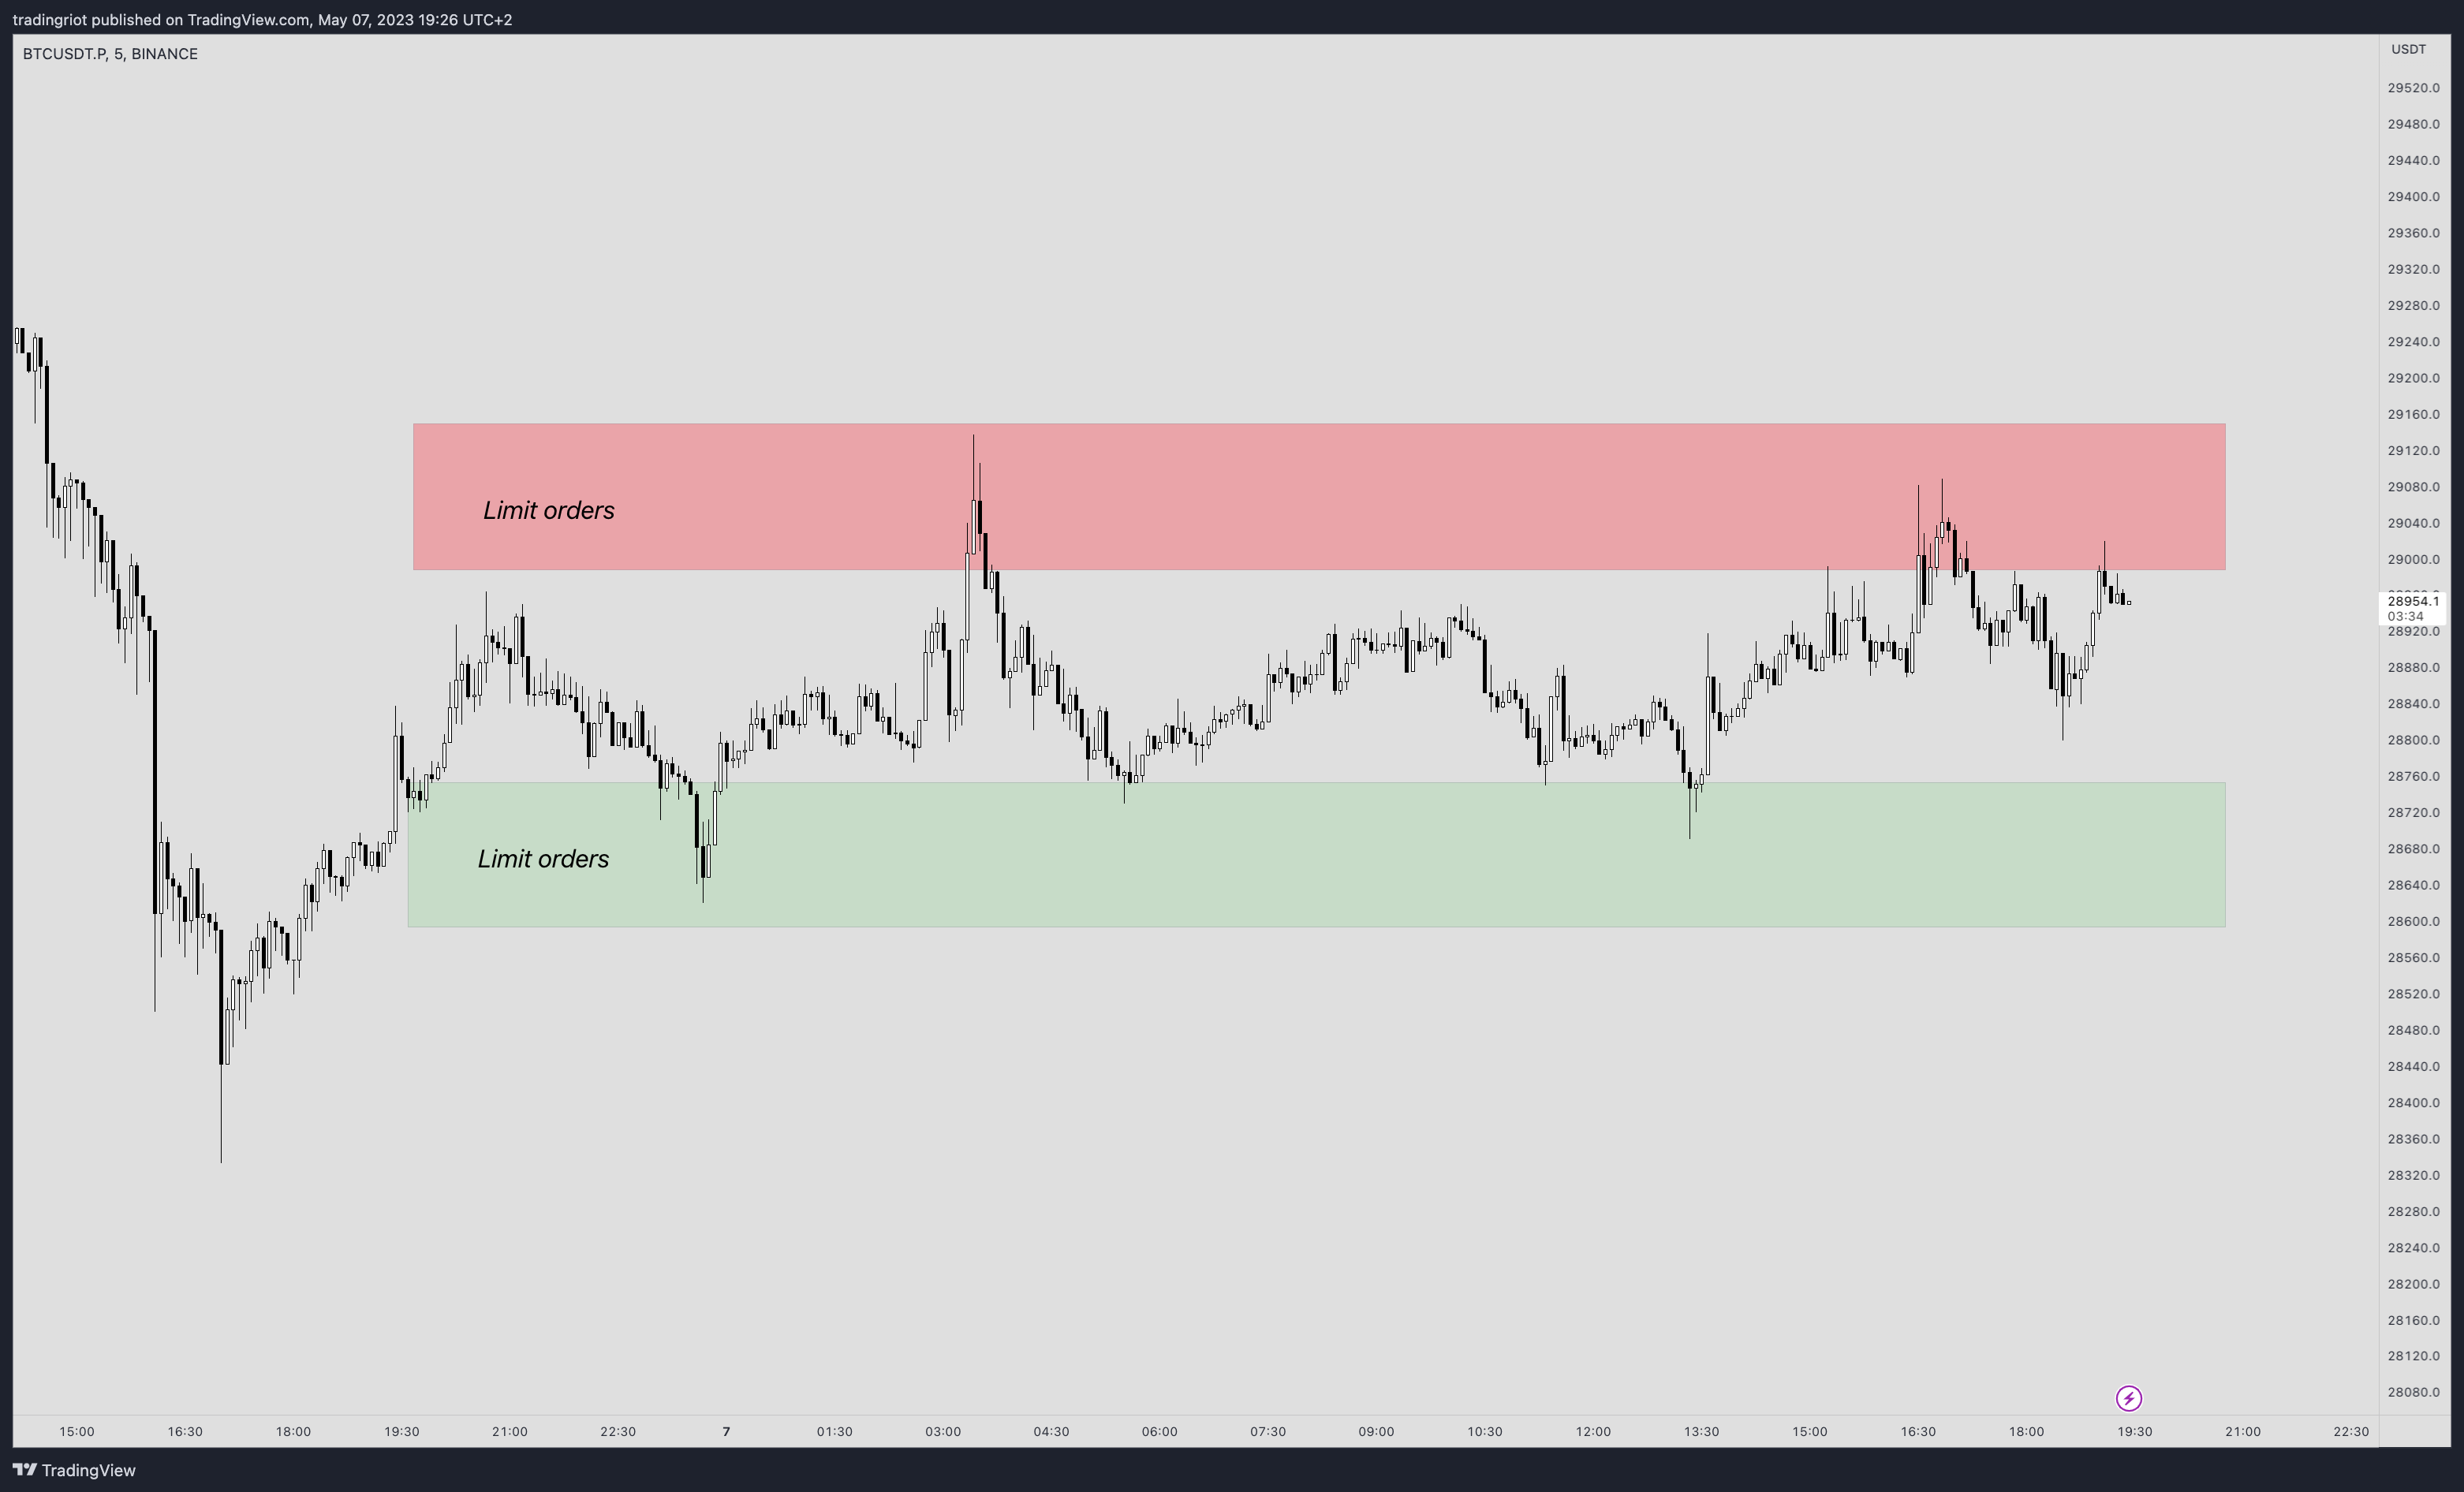
In other words, if I want to enter the new position and place a limit order in the order book, or if I want to exit the existing position via a limit order for profit.
What you cannot see are stop orders (stop-losses) or liquidation prices as these are executed via market orders as default on all exchanges.
Looking at the order books and heatmaps is a popular way for a lot of traders as they try to see if there is a large supply or demand coming to the market.
What a lot of traders do is look at significant orders resting under or above price and think about them as “whales” creating support or resistance.
This can be very tricky in practice as you should ask yourself a question why someone with a large size would want to let everyone know their intention.
Many times these large outstanding orders are spoof orders, which are meant to create a false narrative about supply/demand coming into markets just to be pulled when price reach close proximity of the orders.
What often ends up happening is that those who put the large orders in the market in the first place, were filling the opposite side of the trade as a lot of smaller traders were providing liquidity in an attempt to front-run the large order.
Although sometimes large order is genuine, large orders are very often executed OTC, or just spread into smaller limit orders across more prices.
You might have experienced an iceberg order which is a large filled position out of nowhere that is caused by spreading a lot of small limit orders into near proximity by one entity.
So is there any reason to pay attention to available liquidity in markets?
I would say yes, but it will highly differ based on the market you trade.
If you trade forex and CFDs, these markets are traded over the counter and liquidity is gained from liquidity providers which are firms specializing in providing liquidity.
In this case, there is no way for you to see the depth of the market and everything in regards to liquidity will be just pure speculation.
For classic futures traded on CME or Eurex, you can see available liquidity for any exchange just by looking at DOM.
Futures markets are much less liquid and fast-paced than they used to be just a few years ago and it is harder and harder to gain an edge from watching DOM alone due to the large amount of HFT (high-frequency trading) firms participating in the markets.
That being said I think looking at DOM can still provide you with some decent edge, but it will take a long time and a large amount of focus to develop.
Crypto is very interesting in this regard because of how much data and tools are available.
It is still a very thin and fast-paced market so looking at DOM on single price points won’t give you much, same as trying to base your decision on outstanding orders as I previously mentioned they are often not genuine.
One of the things I found interesting is looking at how order books are skewed to either the bid or offer side mostly on spot exchanges.
Although once again these pending orders are just the “advertisement” if the supply or demand comes from more participants at the same time, the chances of it being genuine increase.
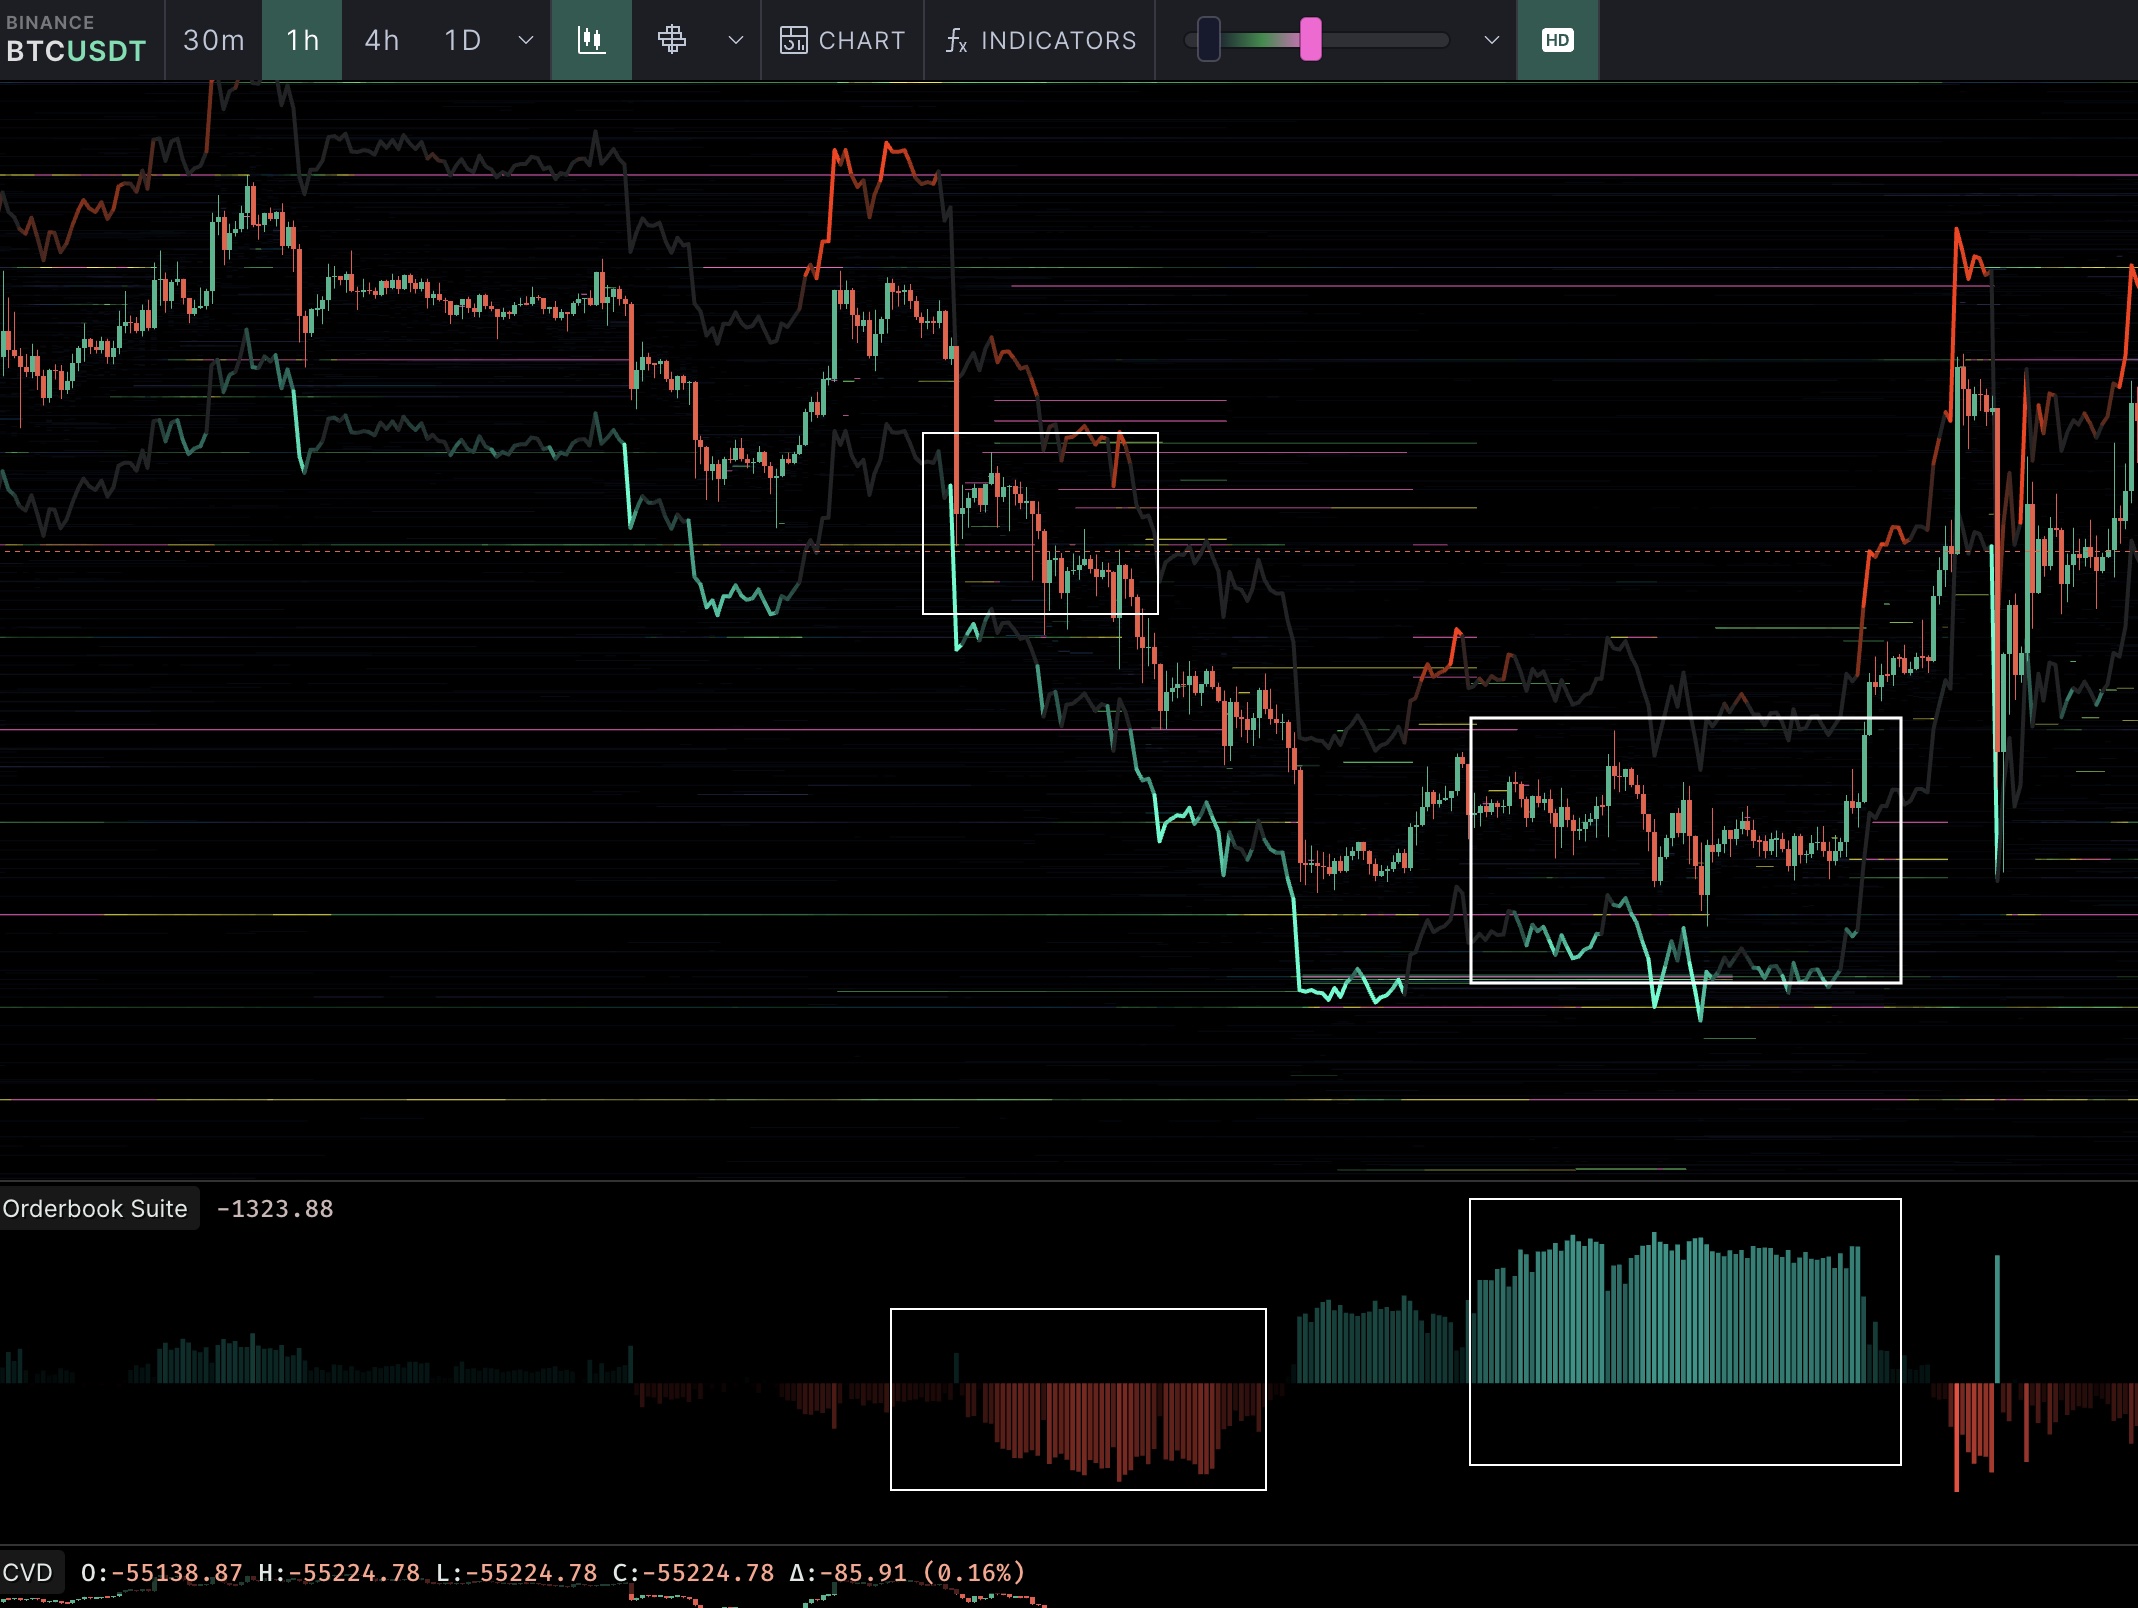
Below you can see BTCUSDT on Binance and how price action reacted when the order book got significantly skewed to one side.
How does liquidity determine the volatility in different markets
The main thing that liquidity does is it determines how much is given market going to move.
We can look at BTC and ETH or ES and NQ as an example.
These markets are very highly correlated meaning that in most cases when one moves to the upside or downside, the second one is doing exactly the same.
The only difference is the magnitude of how much they will move % wise.
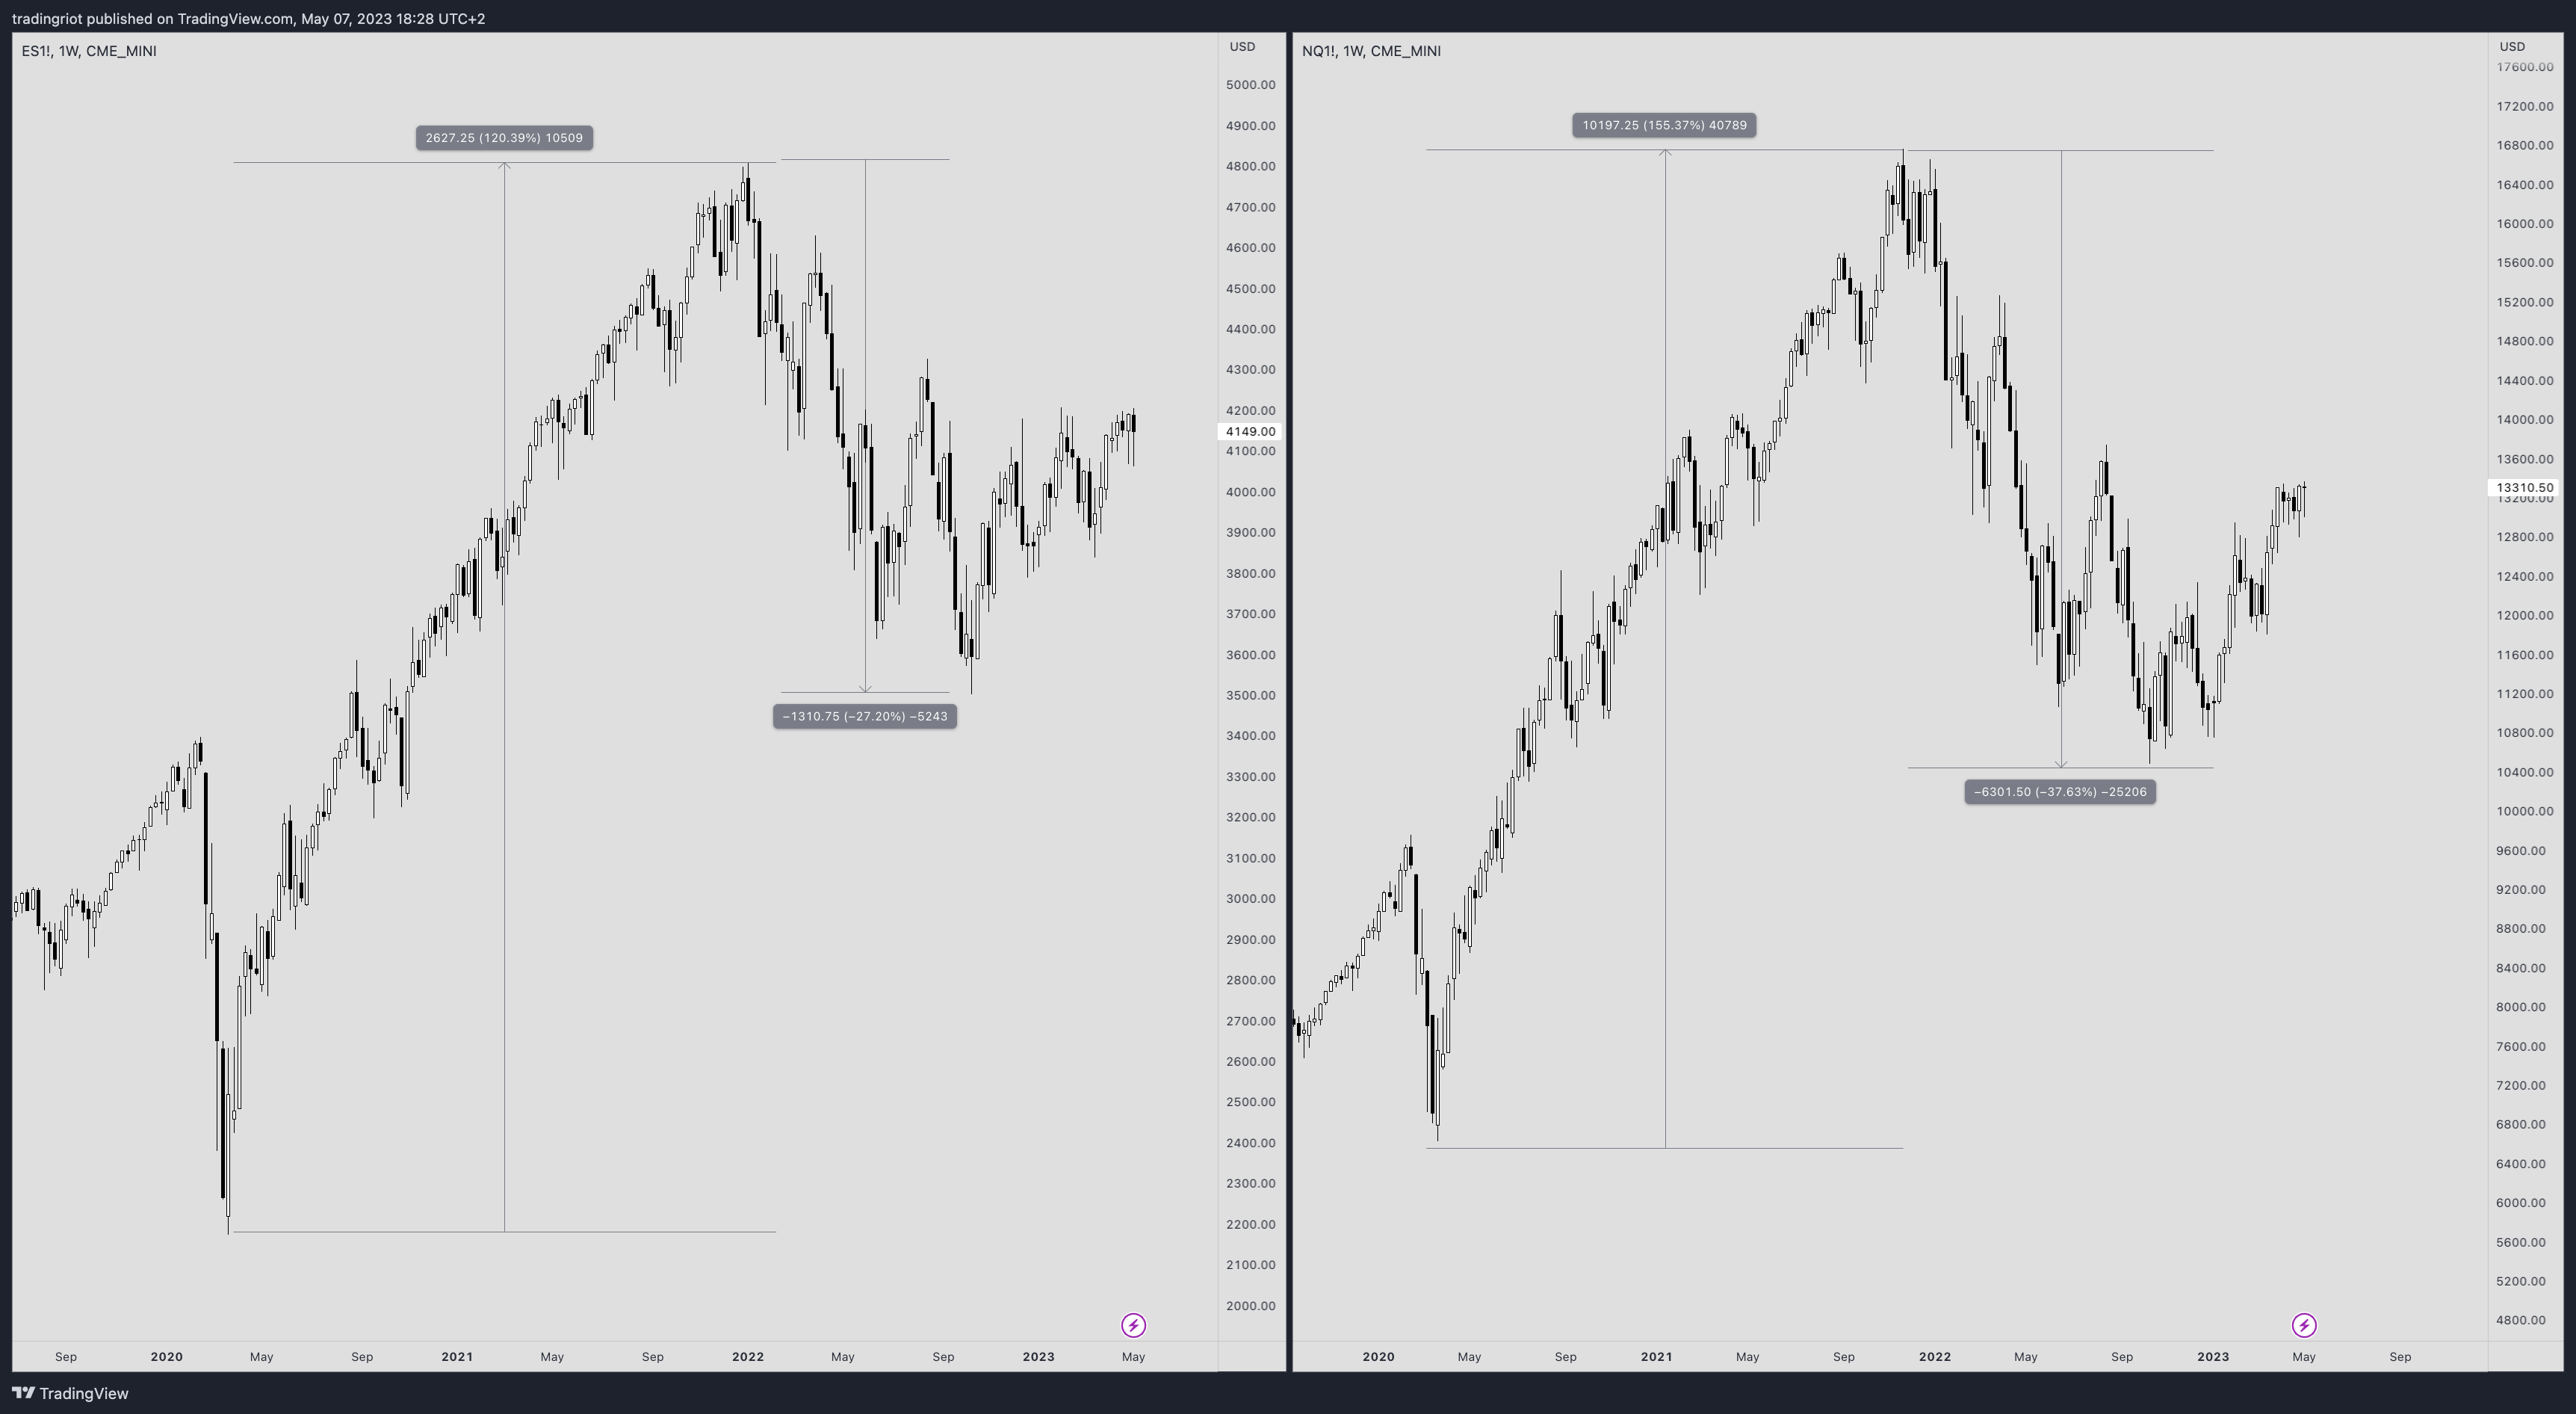
The image above shows ES and NQ on a weekly timeframe.
As you can see, after March 2020 covid crash, ES rallied 120% followed by a 27% correction.
At the same time, NQ rallied 150% followed by a 37% correction.
There is not a huge difference between ES and NQ from the fundamental point of view as they both track the US stock market, the main difference is the fact that ES is a much more liquid market.
In other words, it takes a much bigger effort to move ES compared to NQ.
It is then up to you if want to trade a thicker market that moves less (has lower volatility) or a thinner market that moves more (has higher volatility).
Price action and liquidity pools
You have likely heard about liquidity pools and different price action strategies that are focusing on hunting liquidity (stops).
This is a little funny as I already mentioned the stop orders are not technically liquidity as these orders are not visible to anyone.
This makes it in regards of price action more of a buzzword to make trading look more interesting and magical.
With that being said, you have probably seen many times markets trade past certain swing points just to completely reverse.
The truth behind these moves is not hidden in some secret manipulation, but rather in core essence of the markets and the behavior of traders.
All markets work in two-sided auctions, in other words for every buyer there has to be a seller and vice versa.
Although moves past certain swing points trigger some stop-losses as they tend to accumulate in the same areas, what you will often find is that these moves trigger just a larger amount of participation than usual from both mean-reverting and trend-following traders.
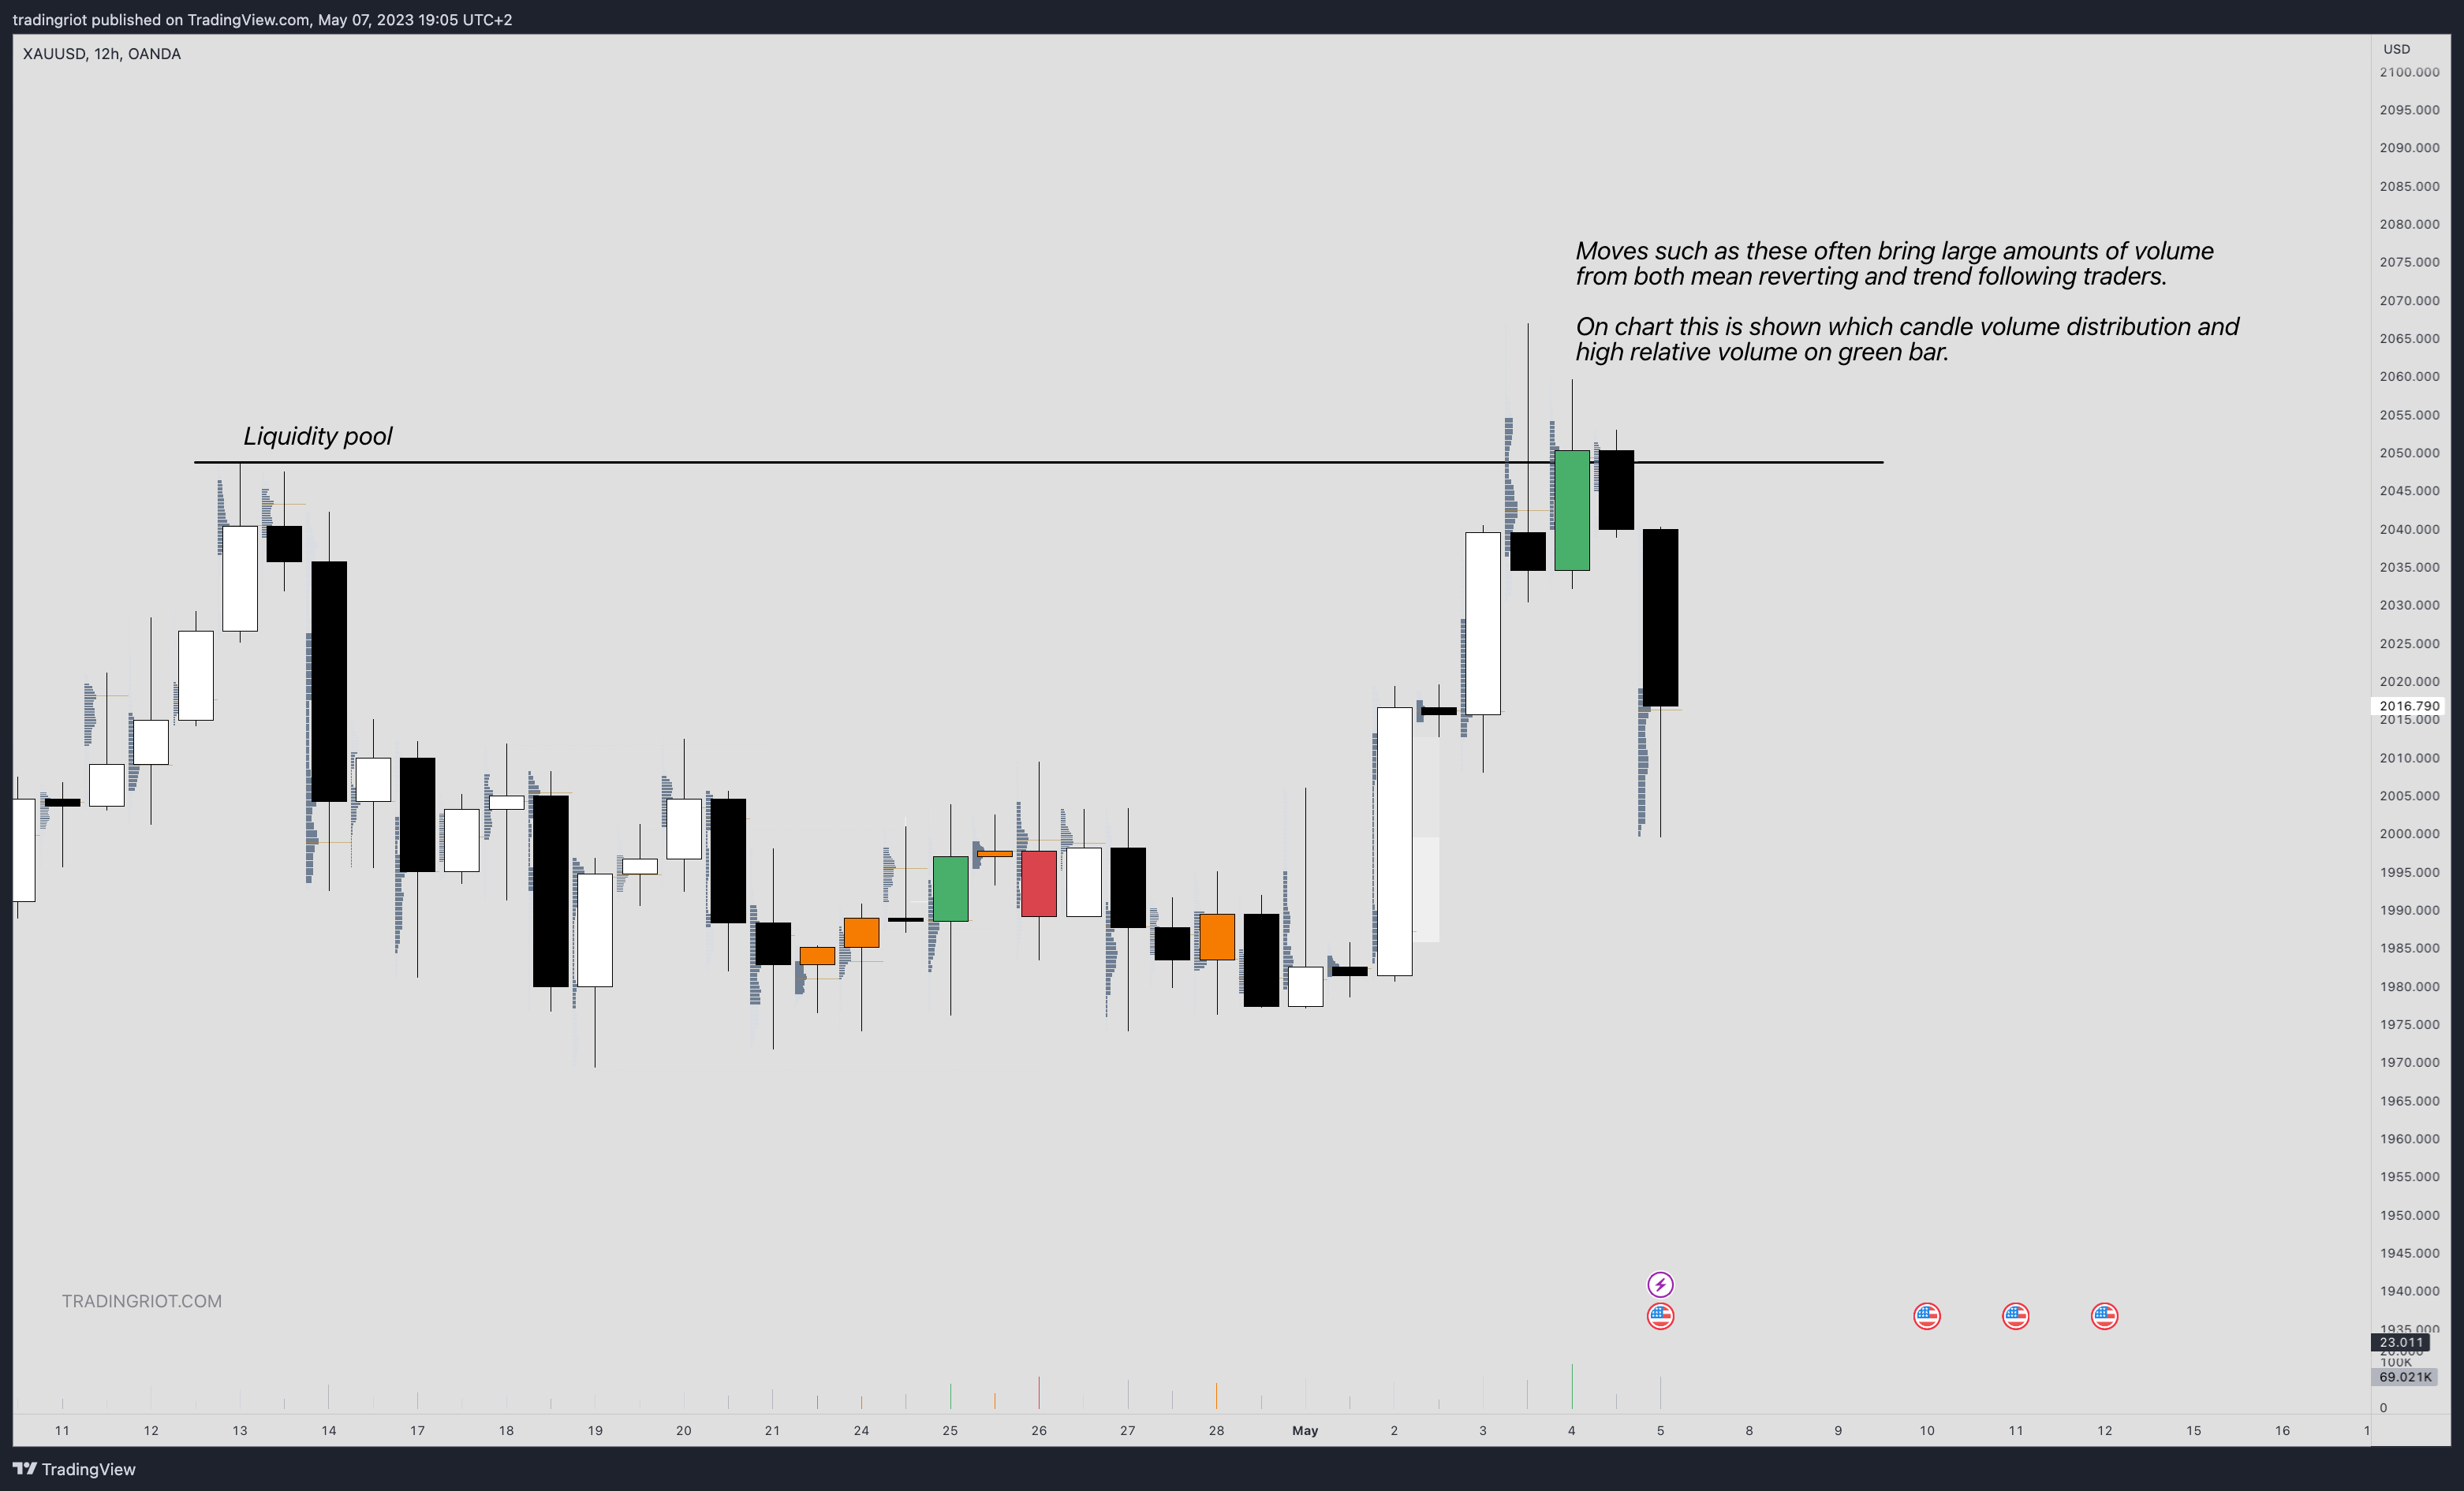
Markets very often tend to range rather than a trend, but retail traders tend to feel FOMO during the quick moves and very often try to participate in hopes of capturing large trends in price.
This provides a great opportunity for large traders to fill their, in this case, shorts and trade the mean reversion side.
If markets would be all about just “hunting stops” these moves would be often rather hectic as a large number of stops triggered at the same price points cause markets to slip several points at a time.
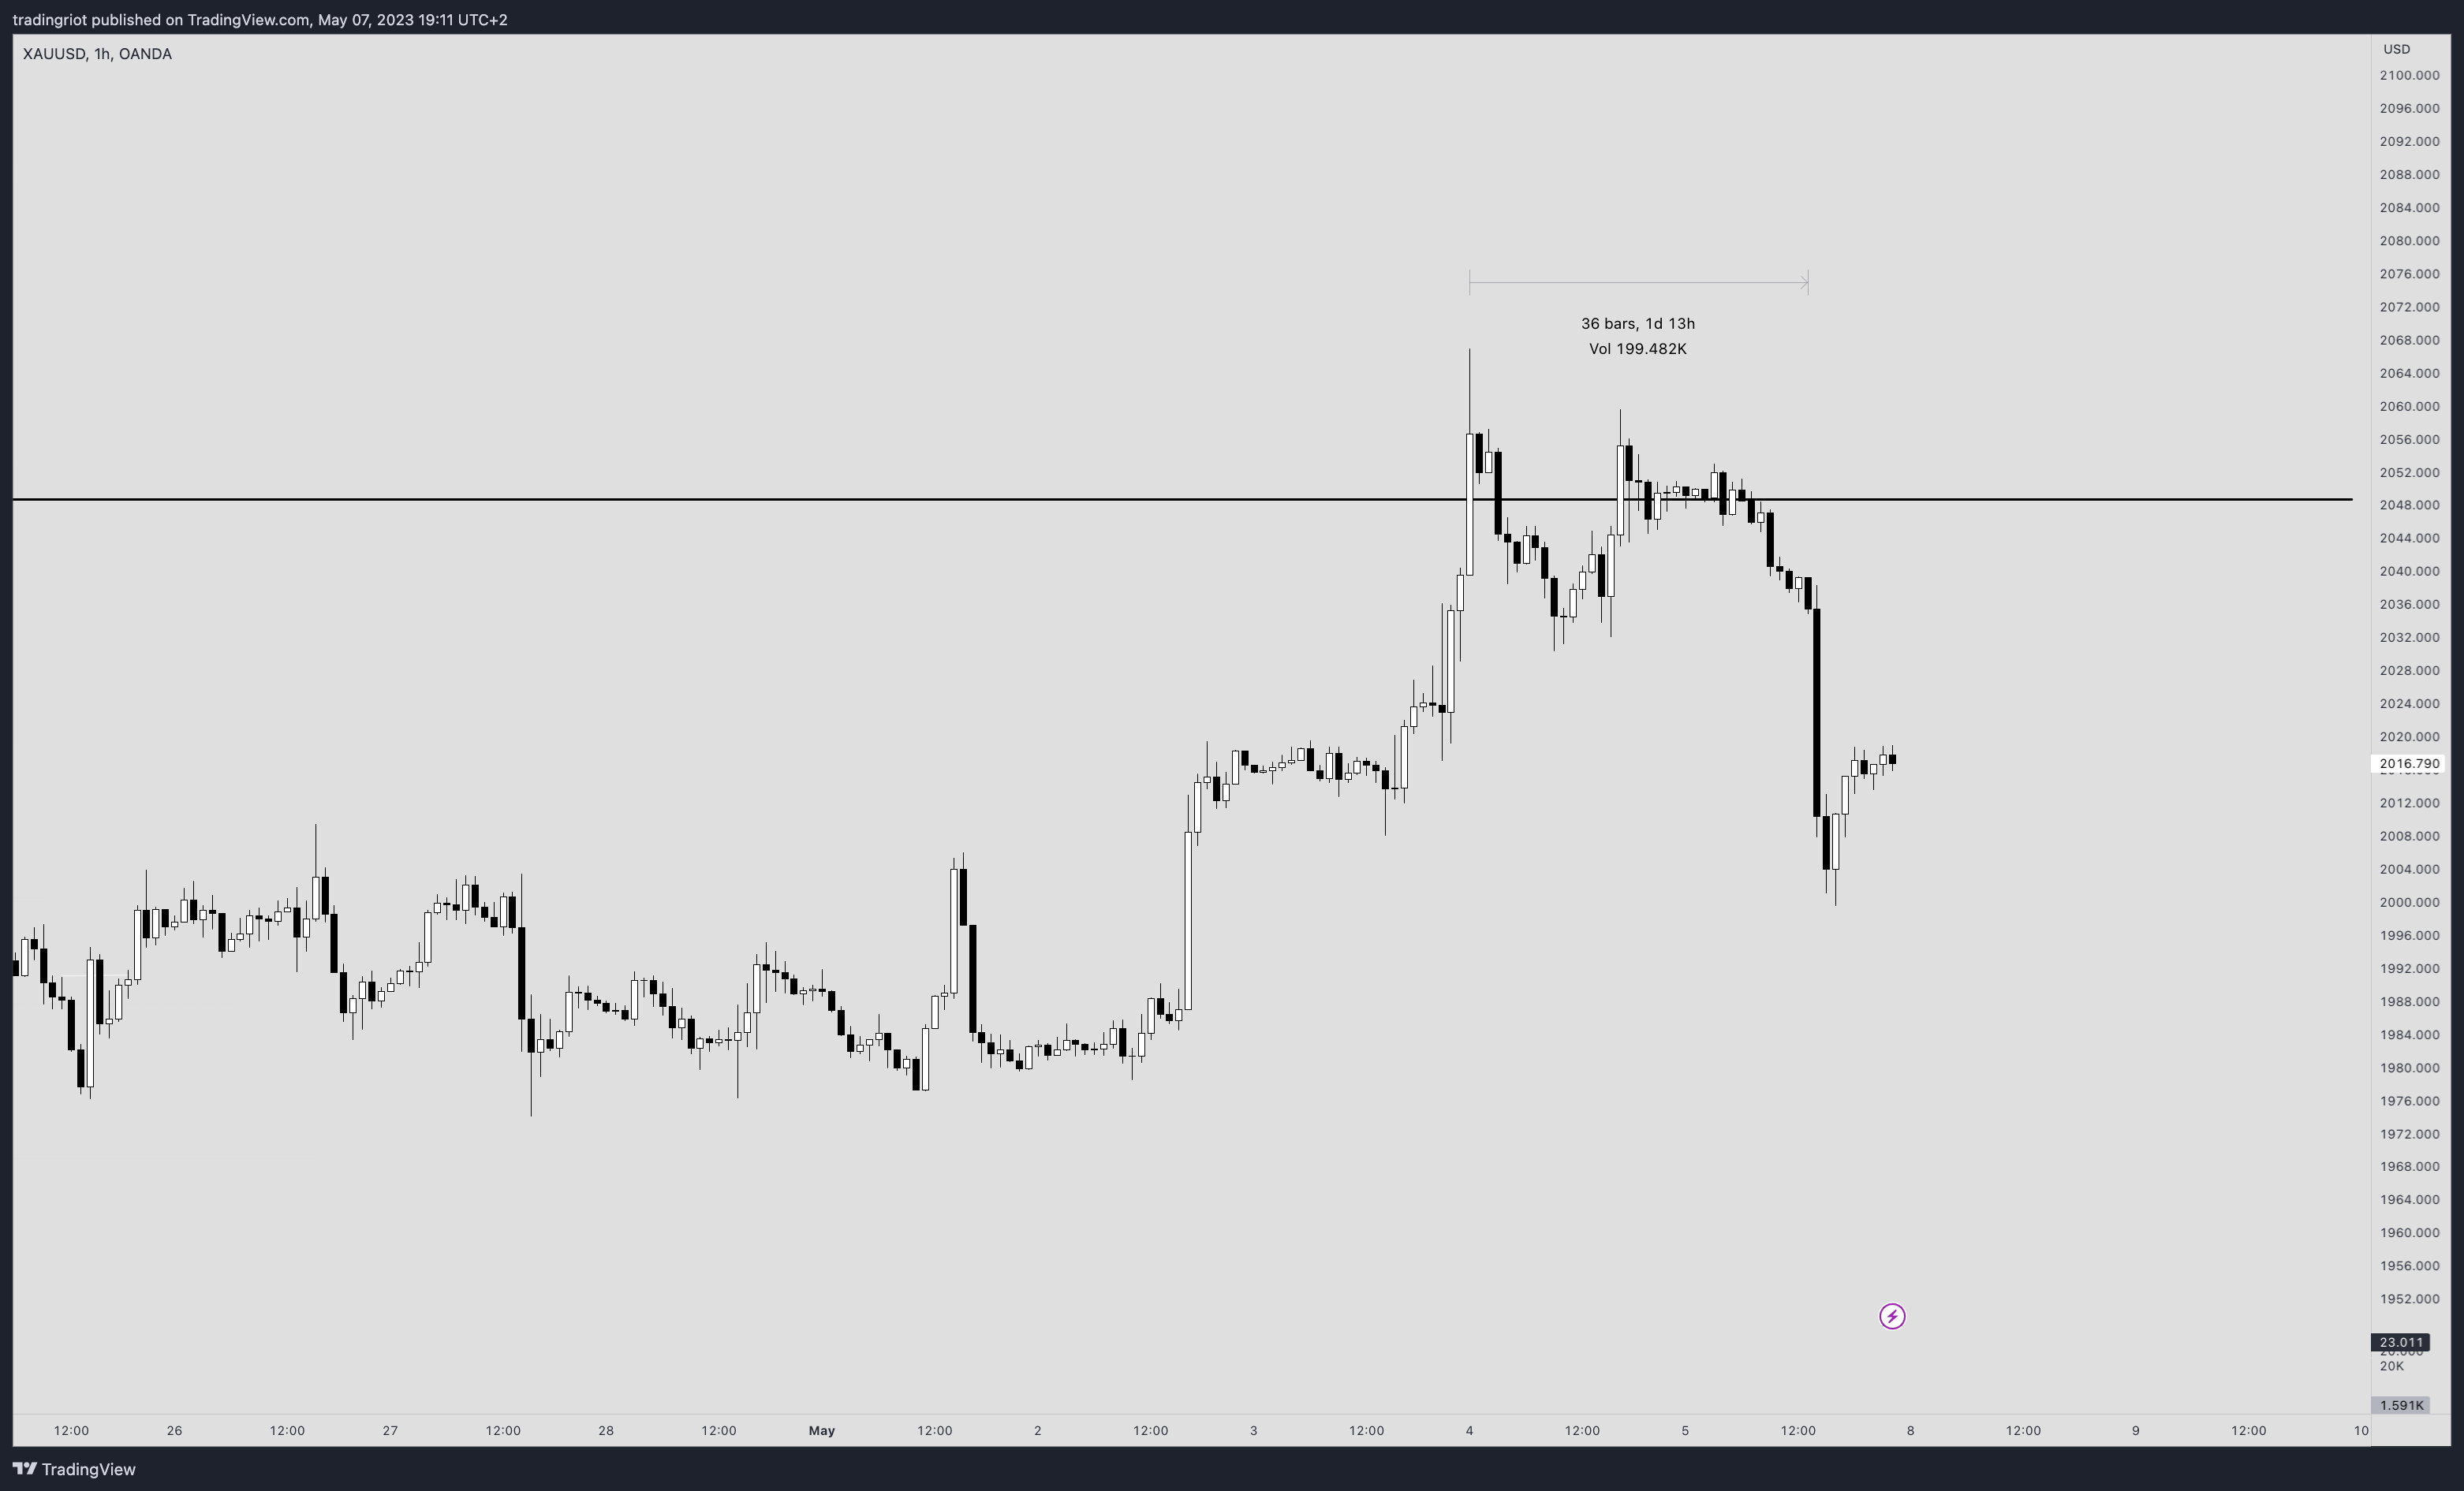
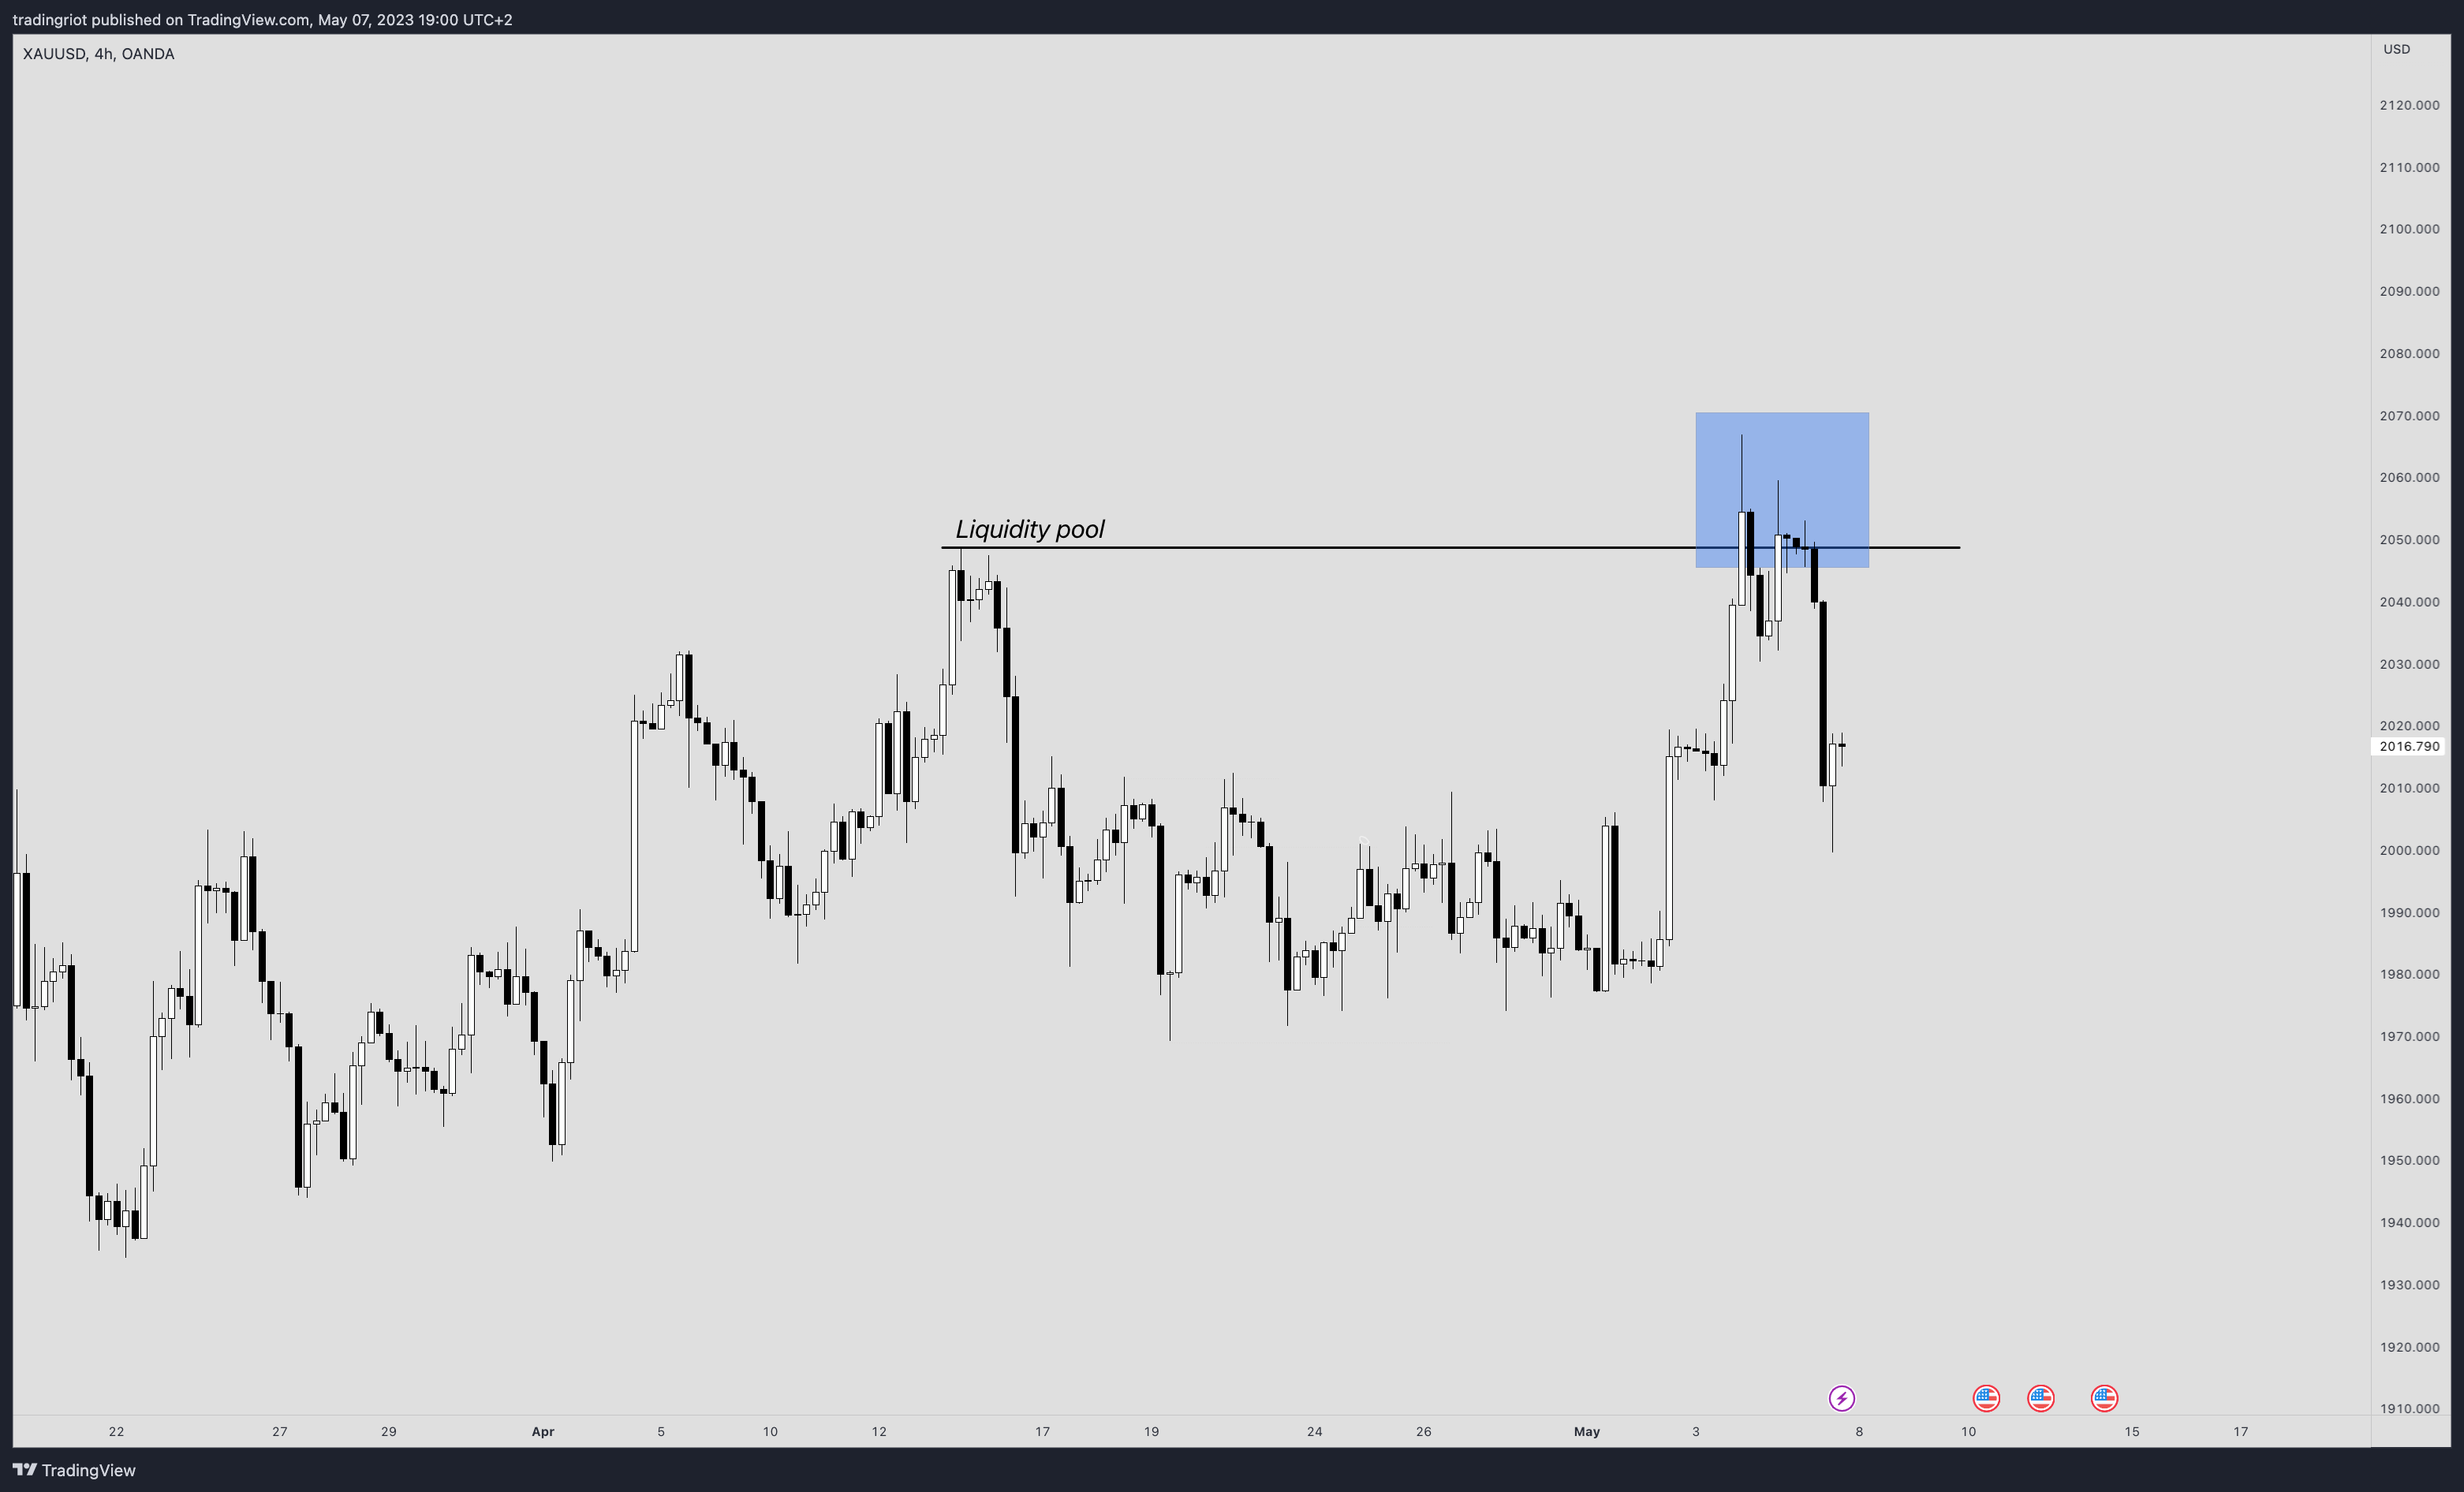
Just ask yourself if this move in Gold was just a quick stop hunt before going back down, why would the market spend over a day in the same area before selling off?
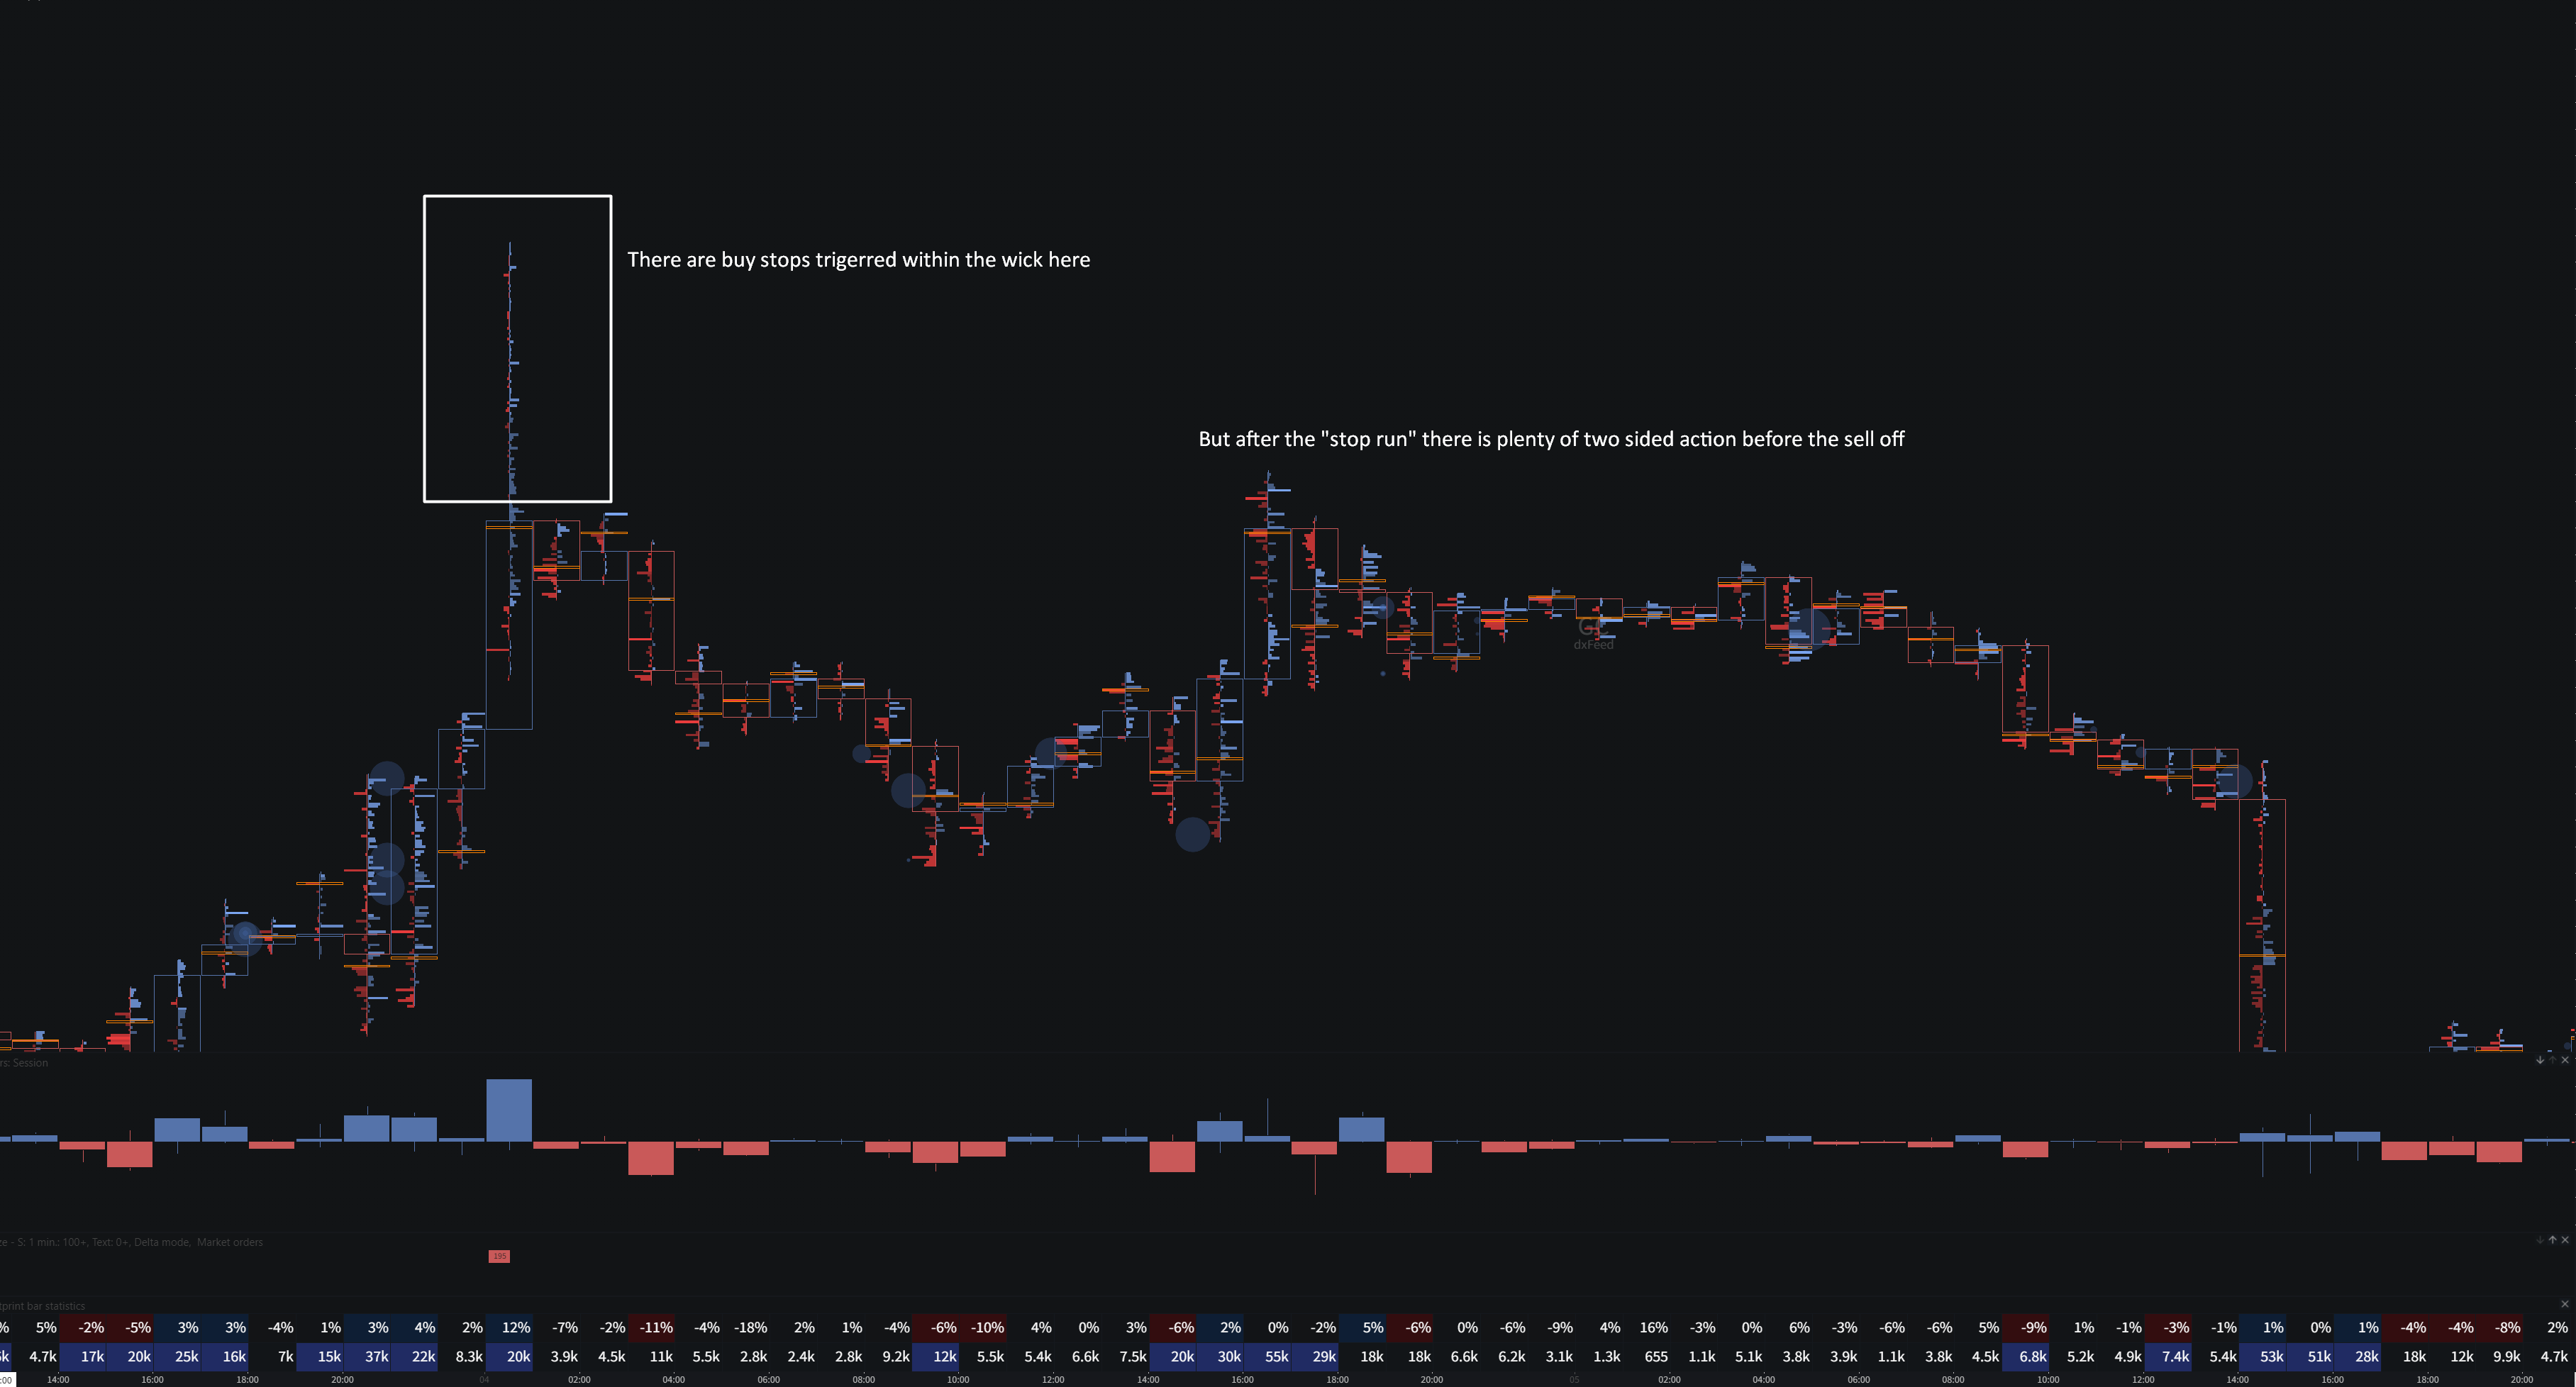
Although without a doubt some stops got triggered at the high, what came next was this two-sided auction between buyers and sellers that got resolved to the downside during the macroeconomic release.
Are market makers hunting your stops?
Another buzzword that goes along with liquidity is market makers.
These are often described as evil entities chasing your stops.
I covered this topic in more detail previously on the blog, so I will keep it short and simple here.
Market making is delta neutral strategy that solely relies on providing liquidity to any given market.
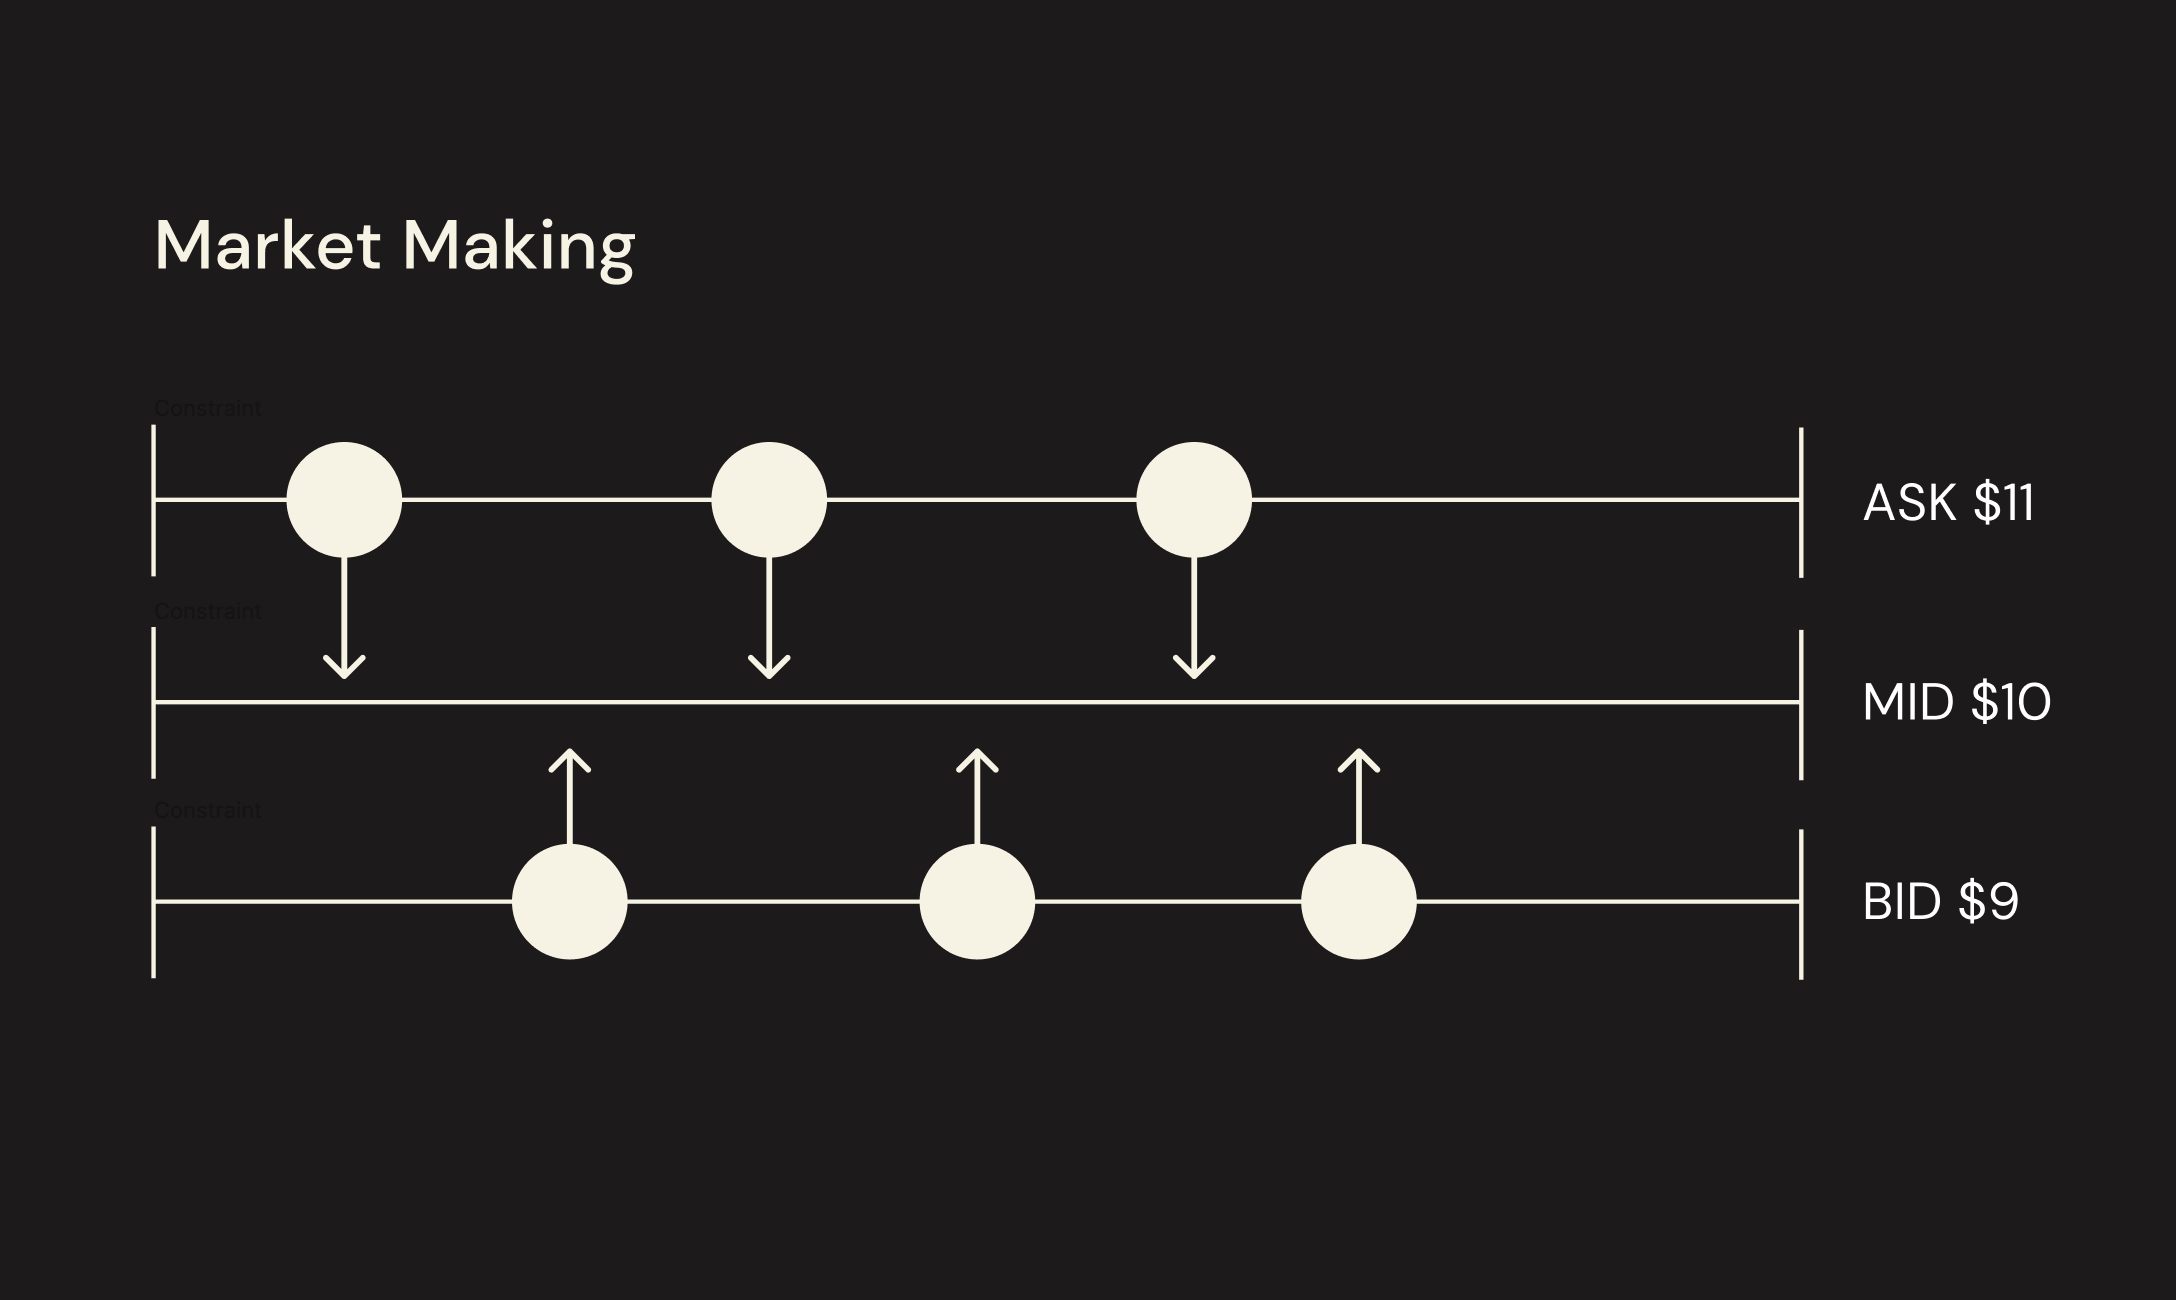
Market makers quote both bid and offer at the same time and their main goal is to not have directional exposure to the market, they don’t make money by trying to capture where markets are going to go next, but by capturing the spread between bid and the ask.
Because of that the sharp “stop-hunts” are actually the least favorable scenario for market makers as they often end up having the directional exposure in the underlying asset.
The image above shows the ideal scenario where market makers provide liquidity in lower volatility environments and make money on both sides of the market.
Does this mean there is no manipulation in financial markets? Of course not.
Every market whether if its forex, crypto, or futures has its fair share of manipulation and it is always done by different actors.
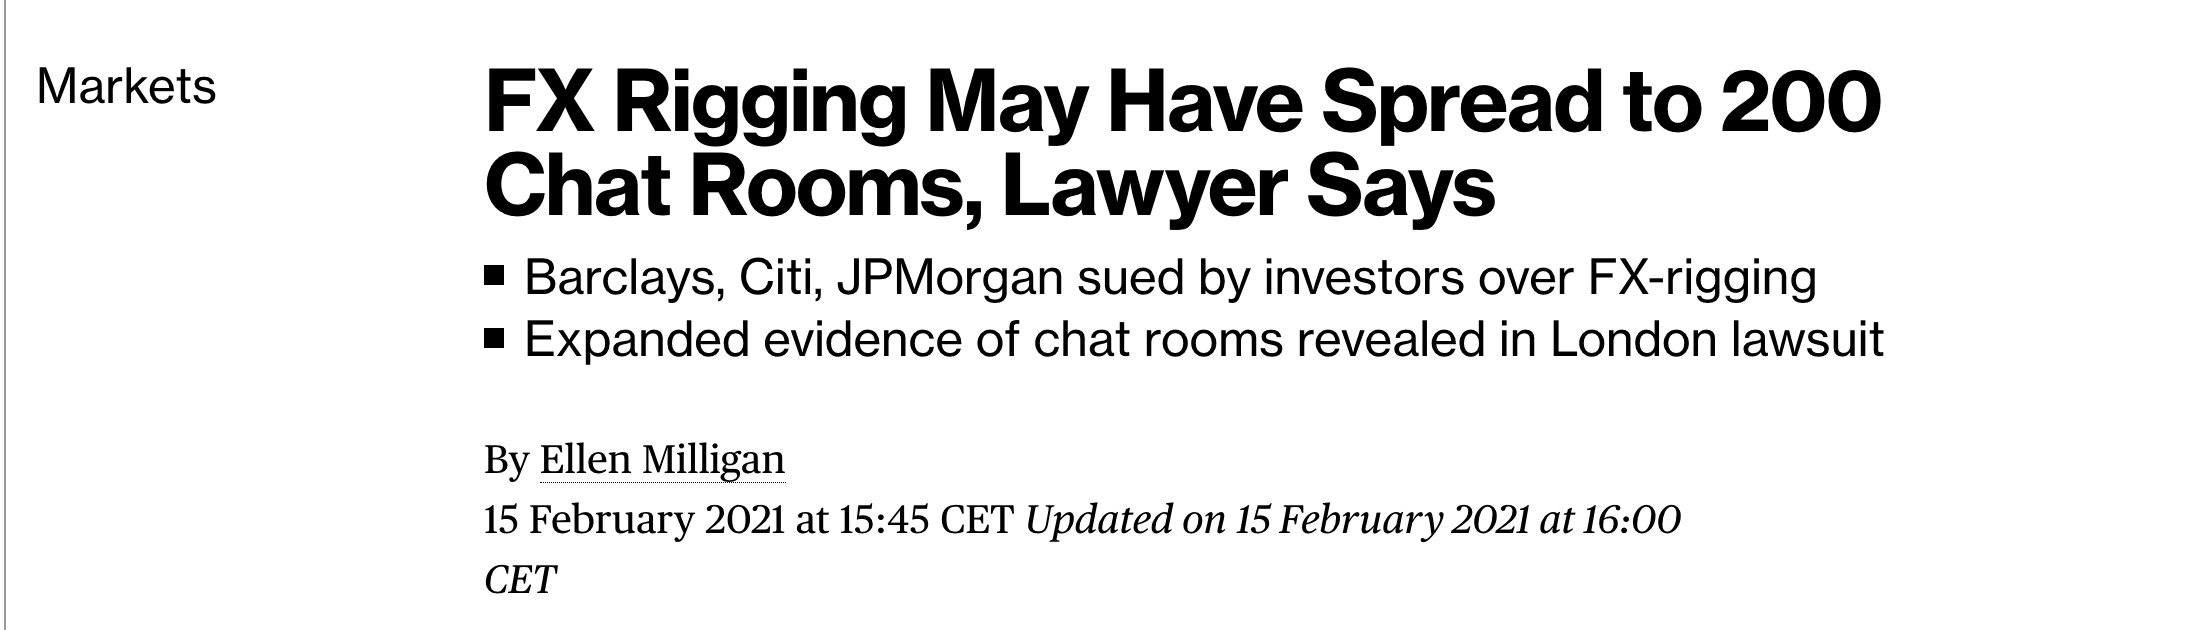
There are many cases of manipulation in Forex by large banks.
In crypto things get even worse and the overall market is much less liquid and therefore easier to manipulate there are many cases of firms creating a false demand for coins only to dump them on retail later on.
With that being said, thinking that someone is hunting your 1 contract with your stop loss placed above a swing high on a 5-minute timeframe is more than silly.
Liquidations and seeing stops
In crypto, you can always see your liquidation price.
This is a price point where the exchange will automatically close your position as you do not have enough margin to maintain the position opened.
Liquidation prices, same as stop losses, are not available to see in the order books.
The only way for you to see liquidations or large amounts of stops getting hit is after the facts in these called liquidation cascades.
These are characterized by sharp moves in price action and large decreases of open interest (positions getting forcefully closed) and in some software like Coinalyze which you can see on the chart below, liquidations are also plotted as indicator (below the open interest).

Without naming any, there are some software in crypto that sell users access to liquidation heatmaps that basically plot levels of liquidations on your chart.

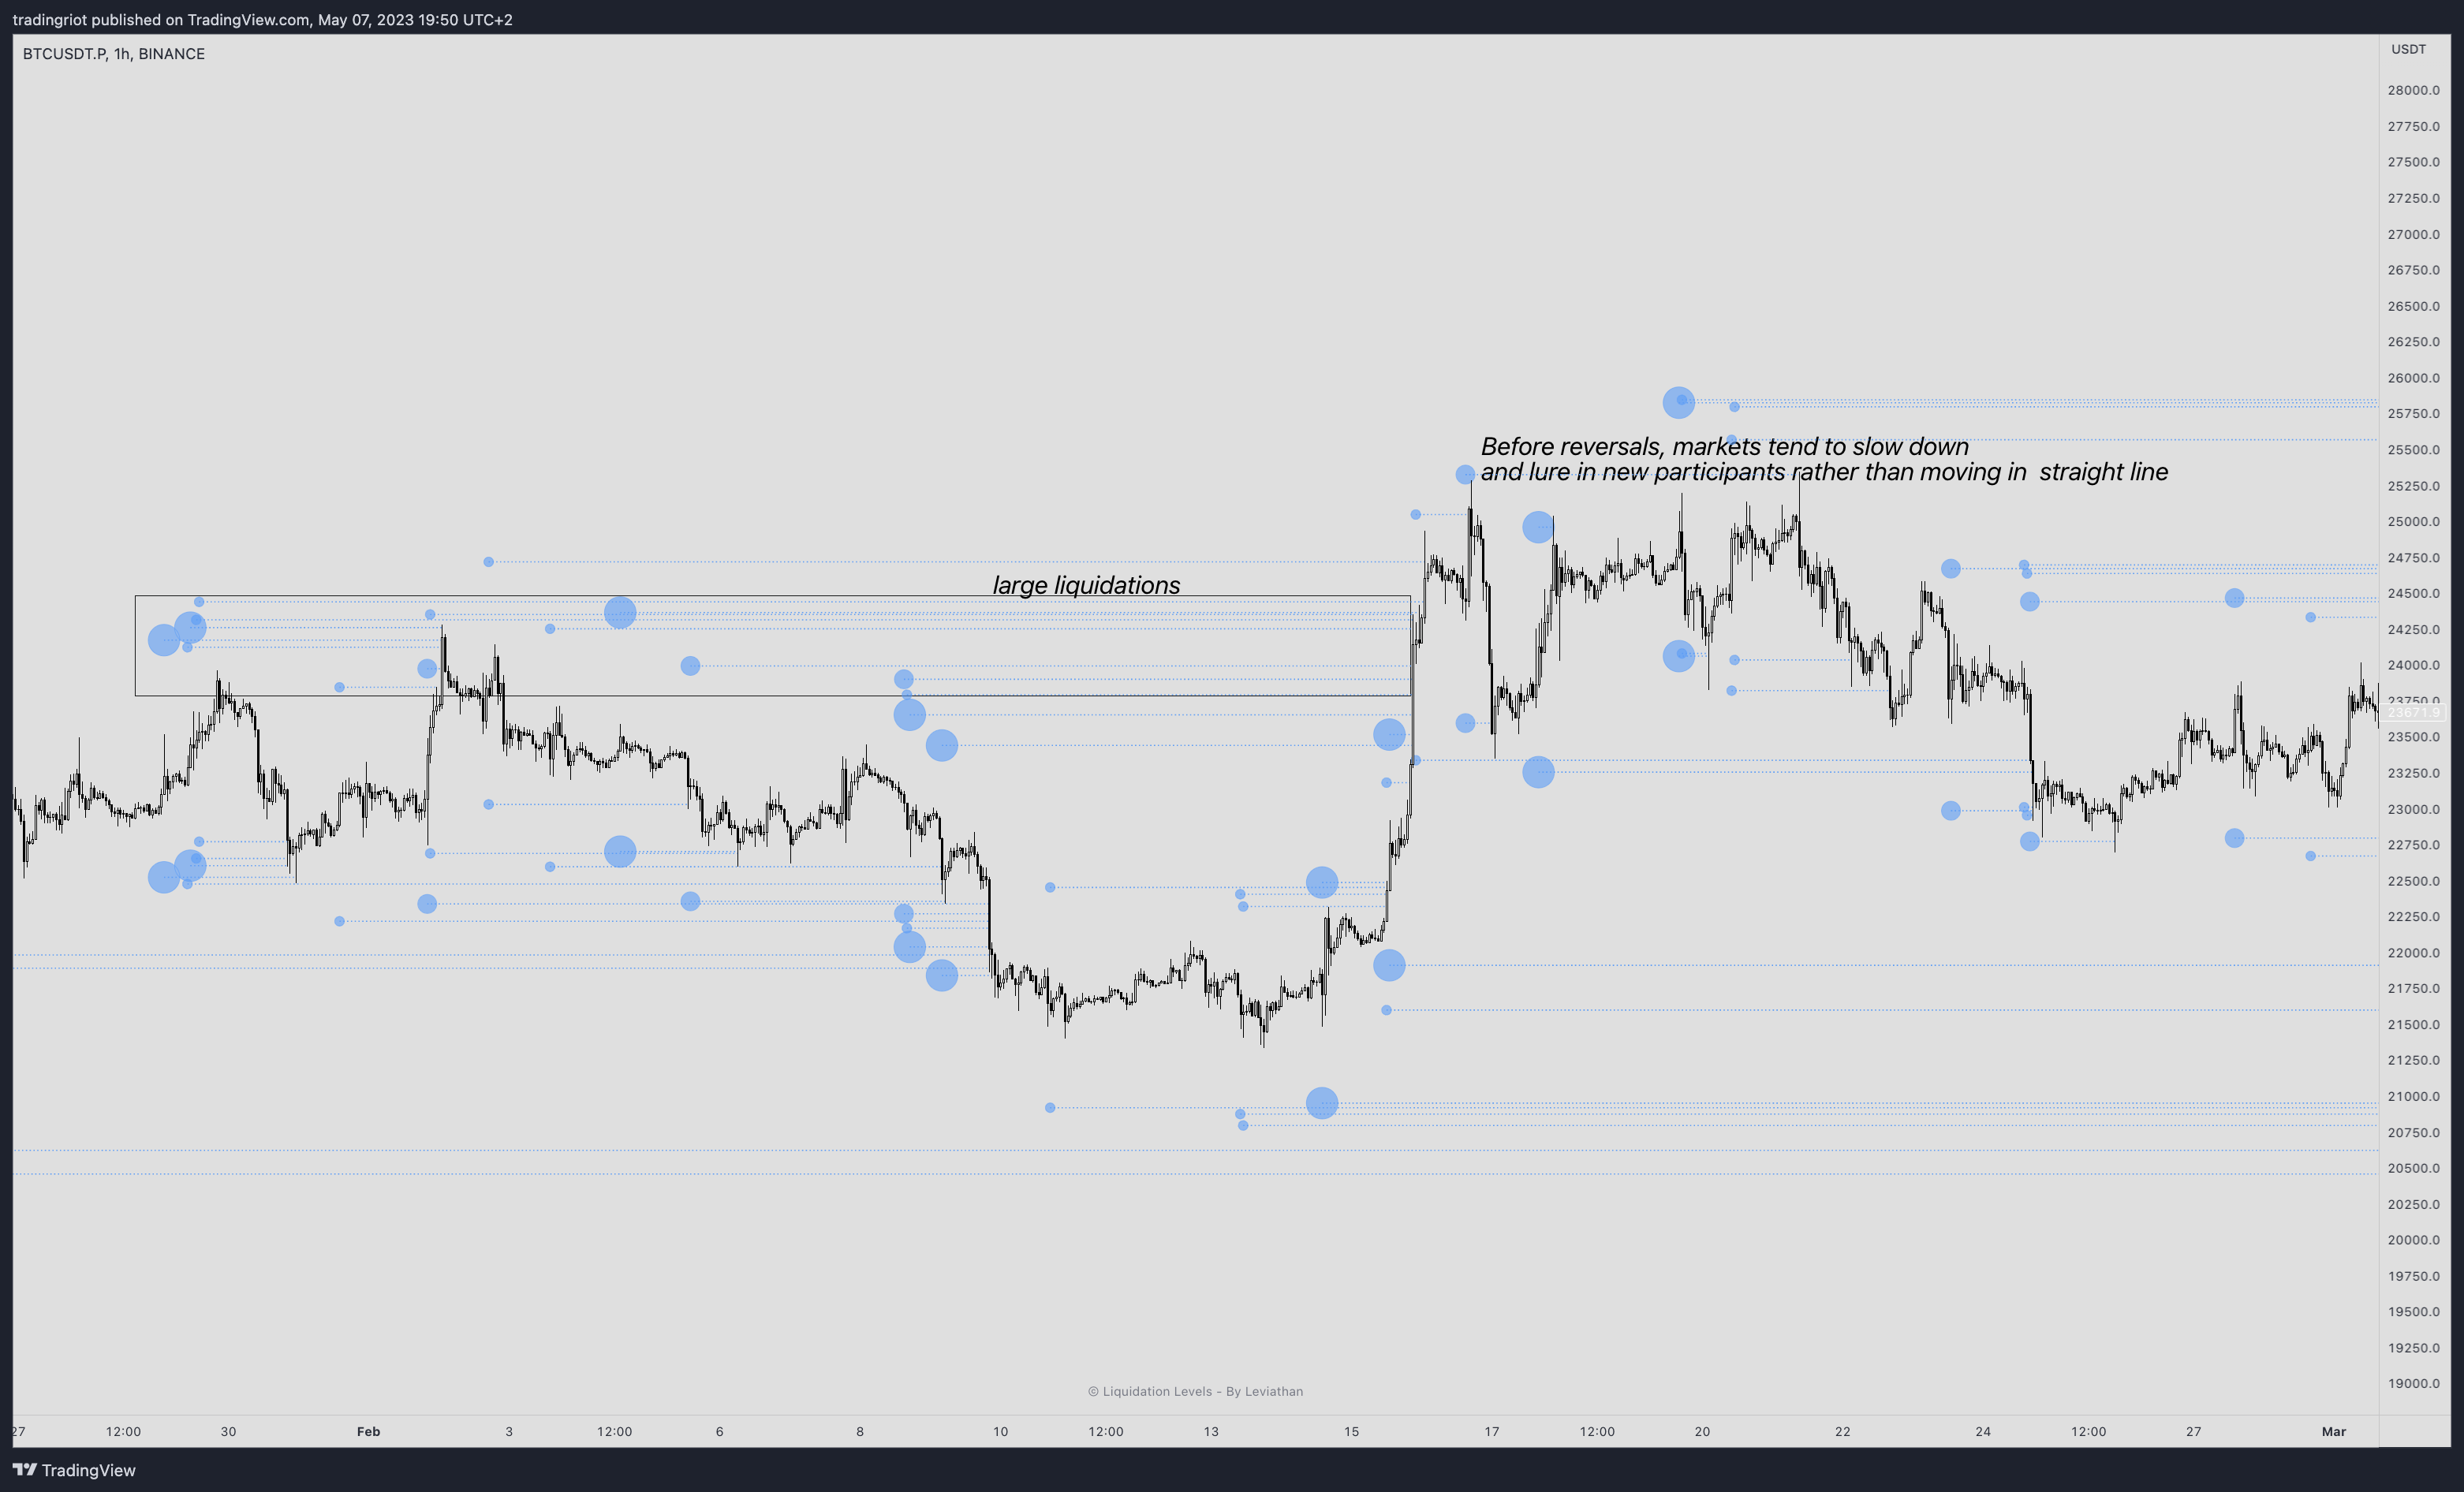
The indicator above shows “liquidation” levels and is made by Leviathan, it is completely free so you can test it out yourself.
Indicators and software like these only plot liquidation levels as estimates derived from changes in the open interest, and you can see on the chart that most of these levels tend to be at very logical places like above resistance or below the support.
In my opinion, it is much smarter to watch how markets behave at these levels in regard to changes in open interest, order flow, and relative volume rather than trying to pre-emptively fade every single move because someone will get liquidated there.
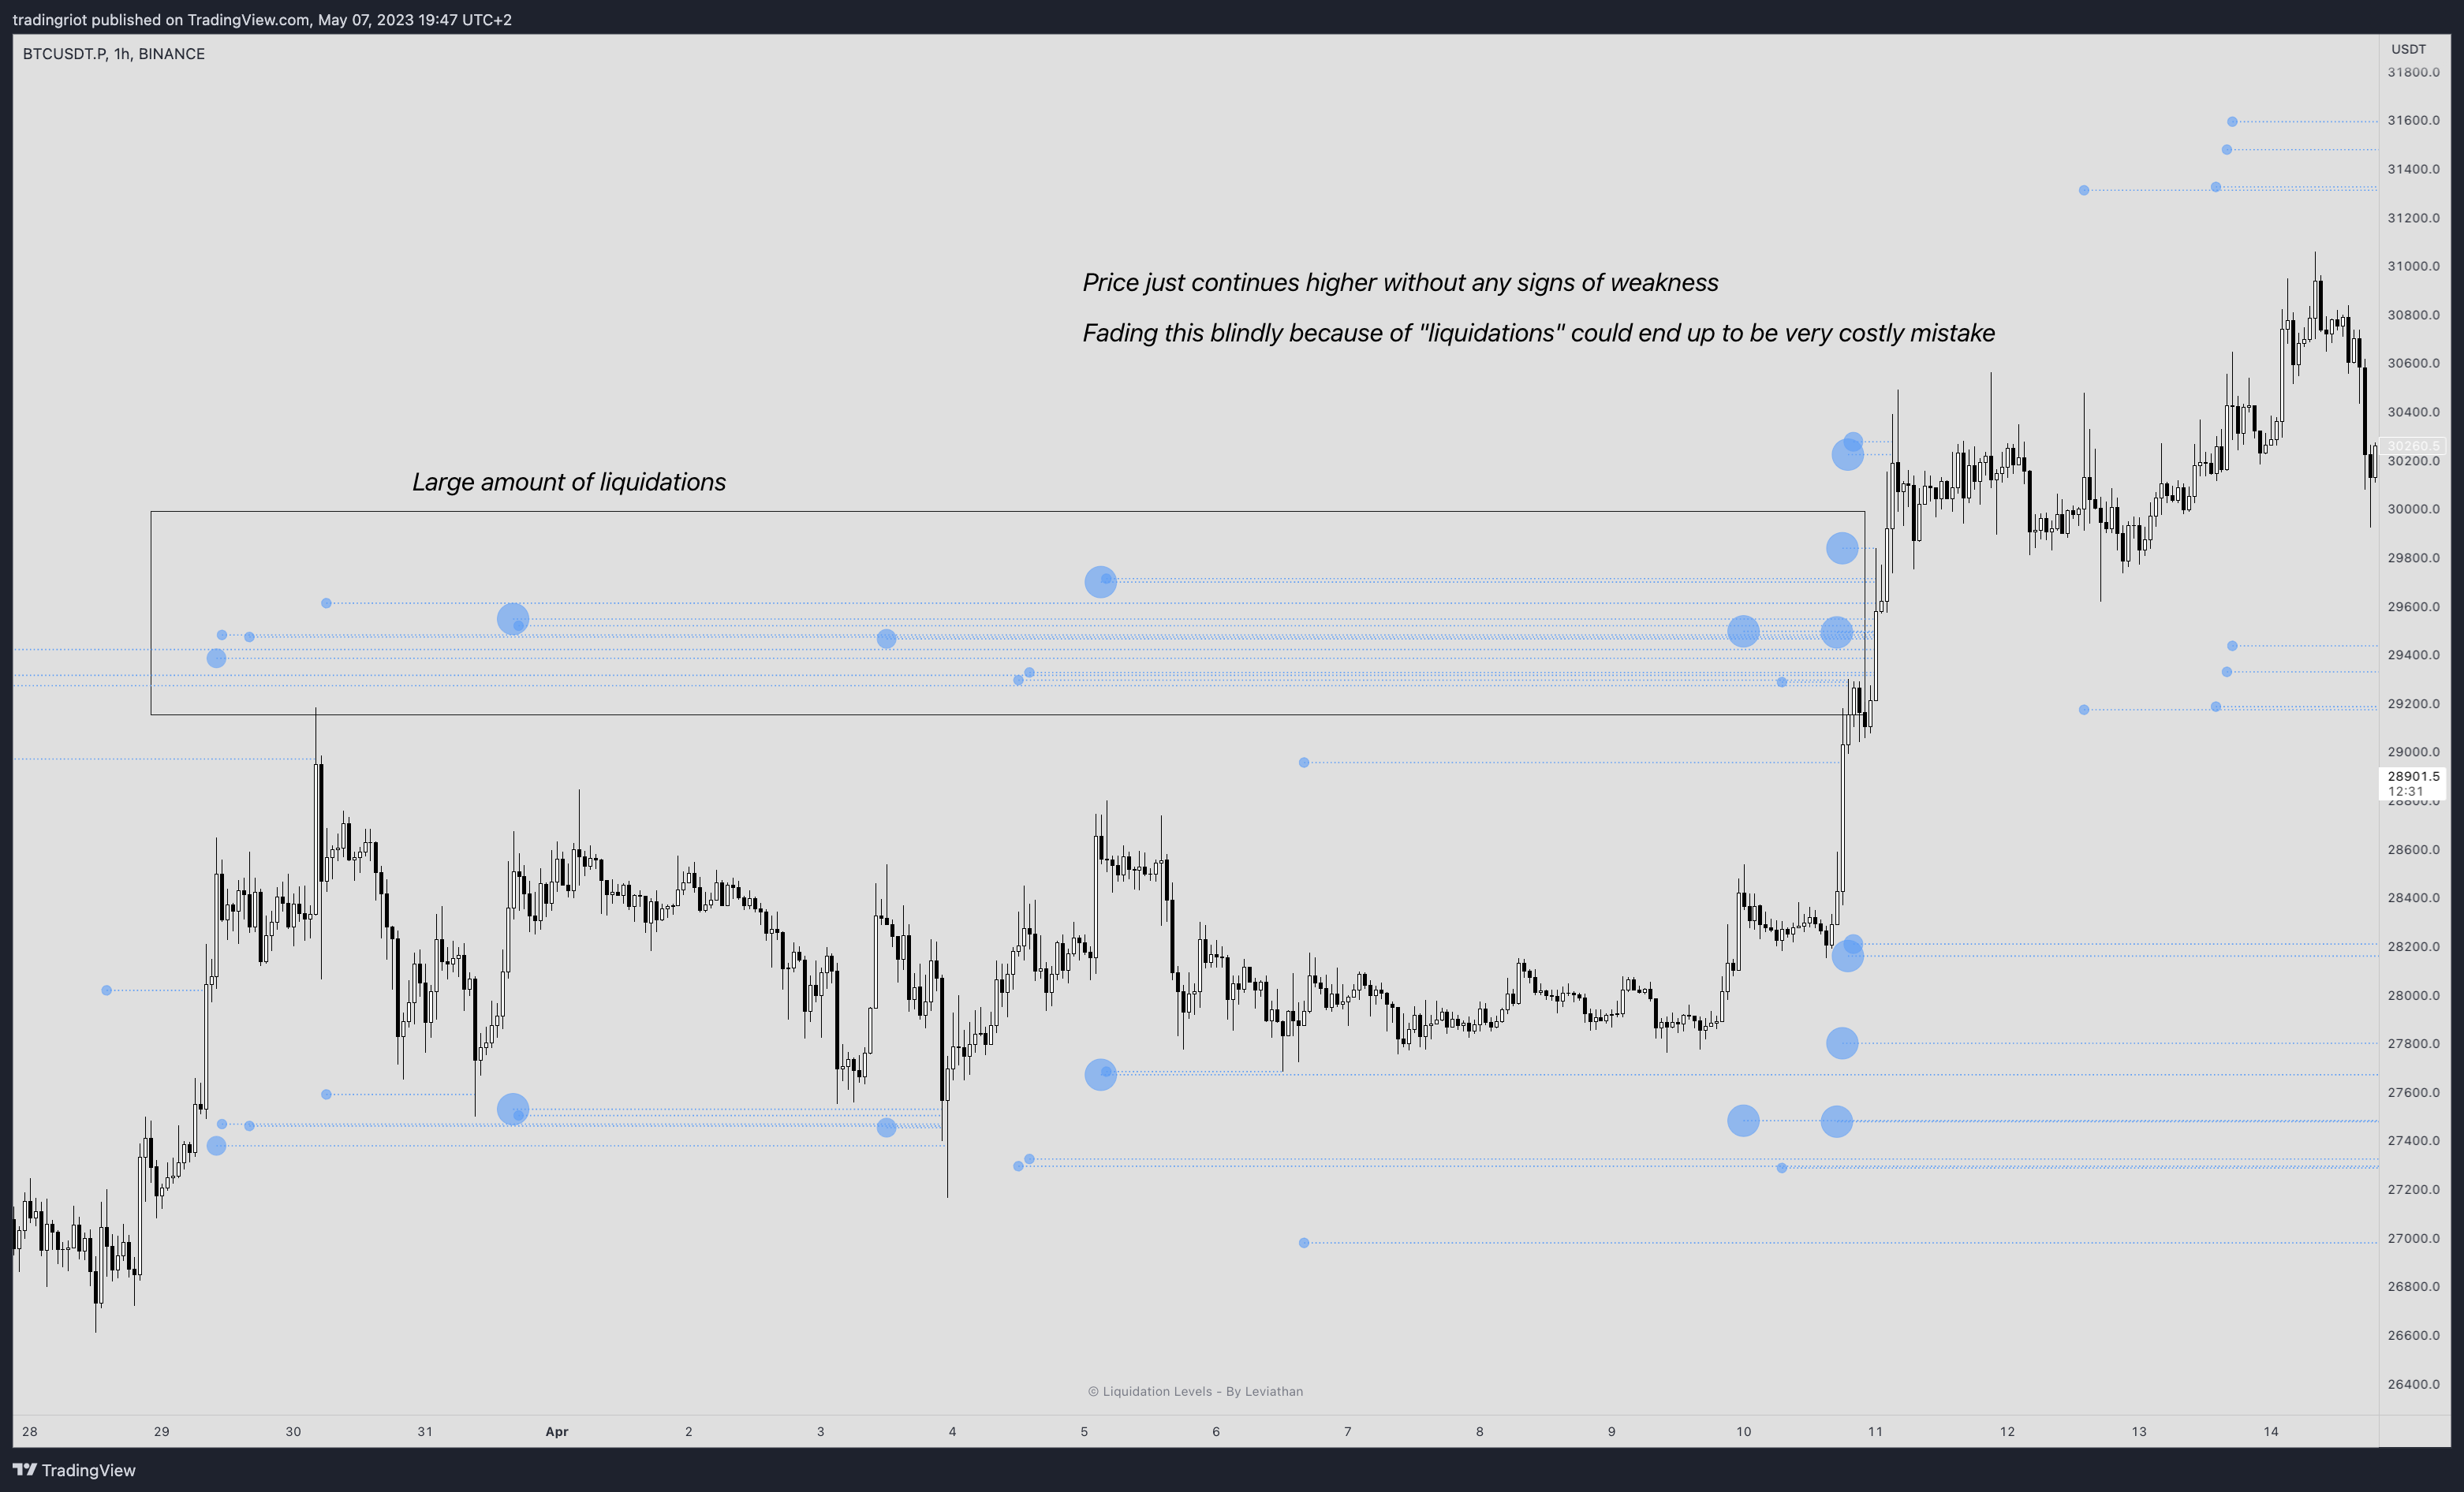
If anything, after large spikes in price that cause bigger amounts of stops/liquidations getting triggered, markets tend to slow down and form accumulation/distribution rather than moving in straight lines up and down.
Conclusion
Throughout the years liquidity has been used as a huge buzzword in the trading community.
For most people, it is largely misunderstood and often presented as a pure marketing trick to make you buy anything that will give you an “insider” look into financial markets.
In many cases, it takes only common sense to find areas where other traders might be stopped out and even if you are not able to do that, you will very often have plenty of time to position yourself after the event by utilizing simple concepts of price action, volume, and orderflow.
If you are interested in learning how I use liquidity in my trading and how I execute trades around these events, you can consider getting the Tradingriot Bootcamp.