
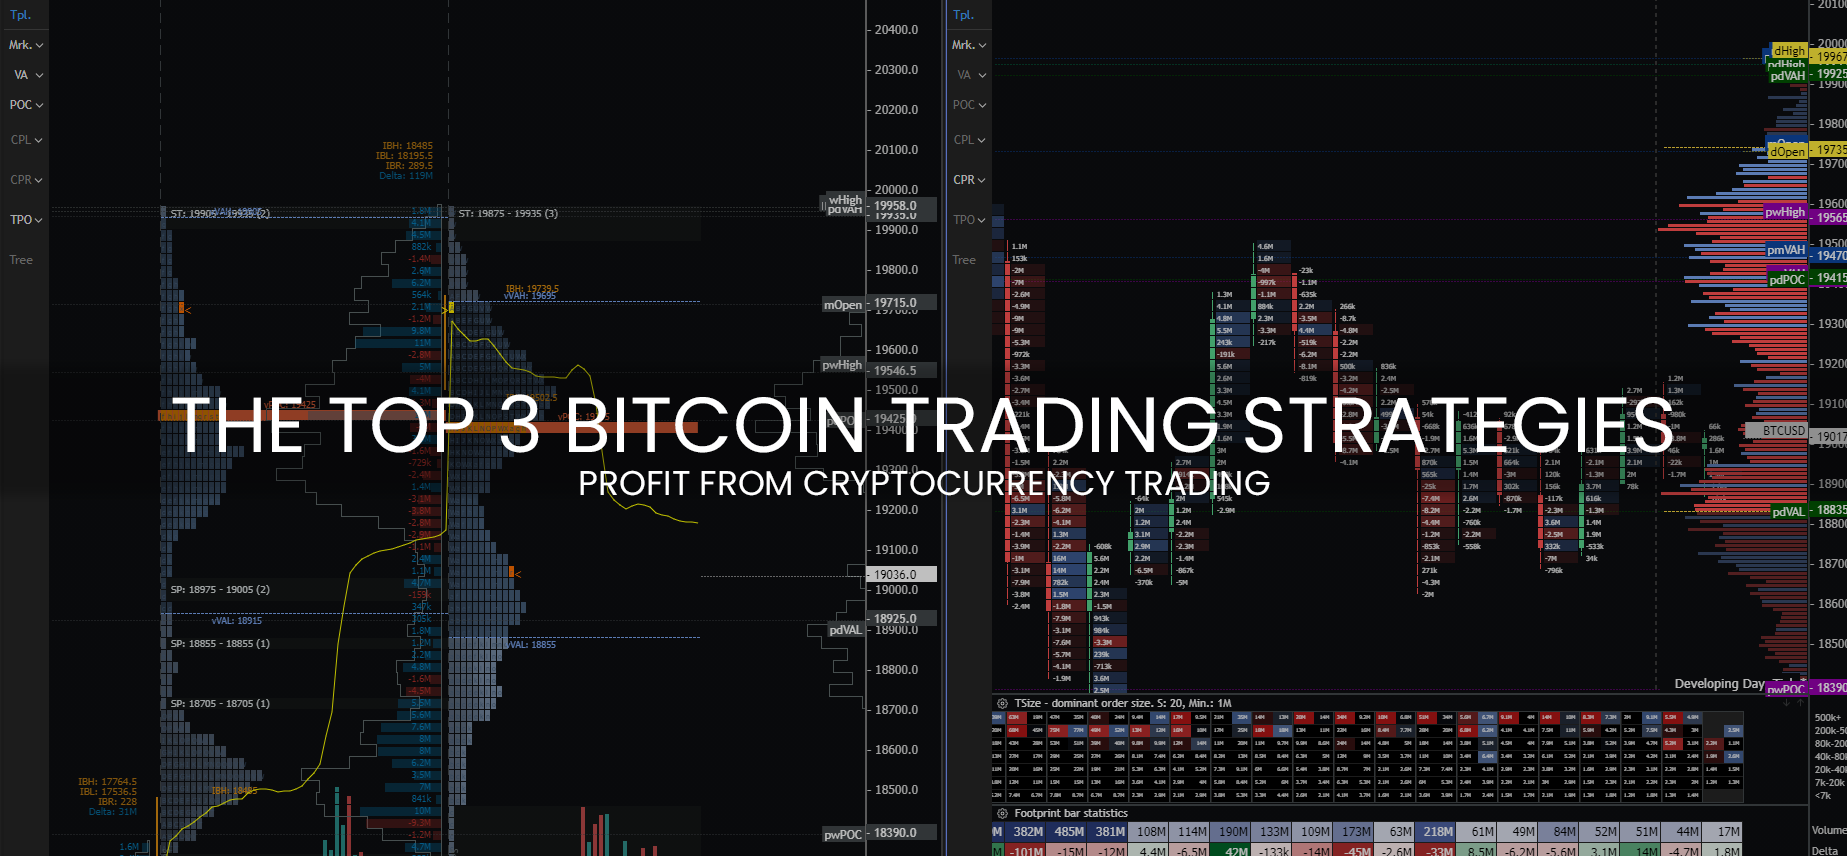
The Top 3 Bitcoin Trading Strategies – Profit From Cryptocurrency Trading in 2022!
Bitcoin and Cryptocurrency trading attracts huge masses of retail traders.
Especially now as we can see Bitcoin reaching for all-time highs after the 2017 mainstream boom which led the price of BTC to $20,000 in the first place.
High volatility, no KYC (know-your-customer) requirements from brokers, high leverage with low margins, all of these things attract new traders every day.
And although we can see some success story here and there of someone who was able to achieve amazing gains with some lucky (overleveraged) picks.
Truth is that most traders blow out their accounts sooner or later.
You can read the article or watch video version on Youtube.
If you like this article, read the rest of the blog or join the Tradingriot Bootcamp for a comprehensive video course, access to private discord and regular updates.
For those who are looking for a new place for trading crypto, make sure to check out Woo. If you register using this link and open your first trade, you will get a Tier 1 fee upgrade for the first 30 days, and we will split commissions 50/50, which means you will get 20% of all your commissions back for a lifetime. On top of that, you will receive a 20% discount for Tradingriot Bootcamp and 100% free access to Tradingriot Blueprint.

What we will take a look at in s article are three trading strategies you can use in trading Bitcoin.
Although they work in every market, I picked those three precisely as they are suited for Bitcoin’s volatile nature but also periods when volatility drops off so you don’t have to wait for explosive price actions
The strategies I will show you in this article are not 100% mechanical.
This means that even though they are very straightforward, you should also pay attention to the overall context of where we are now.
Because they are more suited for short term intra-day/intra-week traders, you should always be mindful of your higher timeframes.
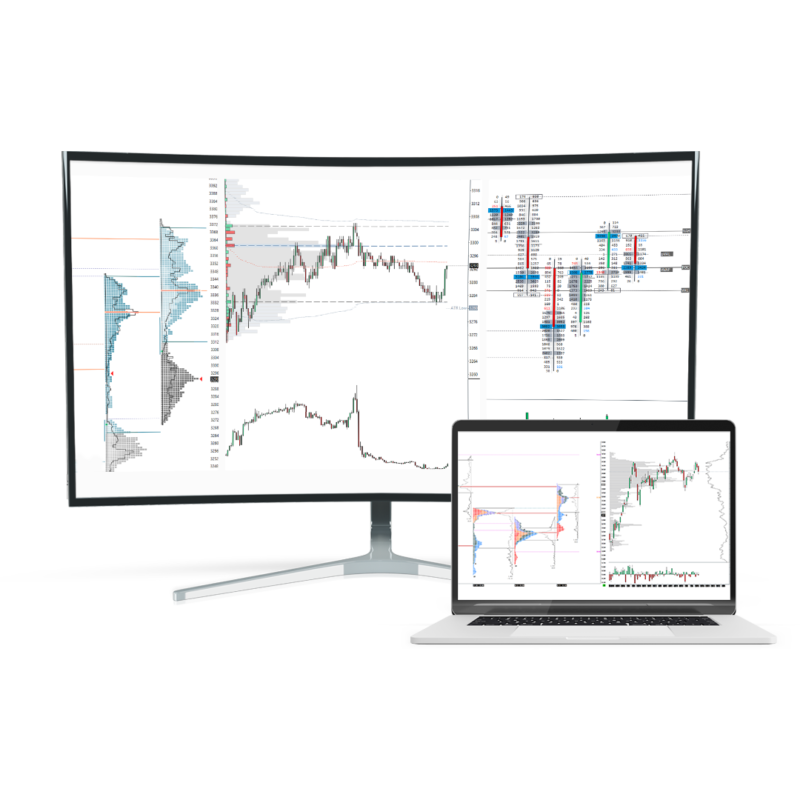
All the examples used in this article come from Exocharts since they offer access to orderflow and advanced charting tools in all major crypto exchanges, this is the go-to charting platform you want to use if you want to utilize the setups I will show you in this article.
Table of Contents
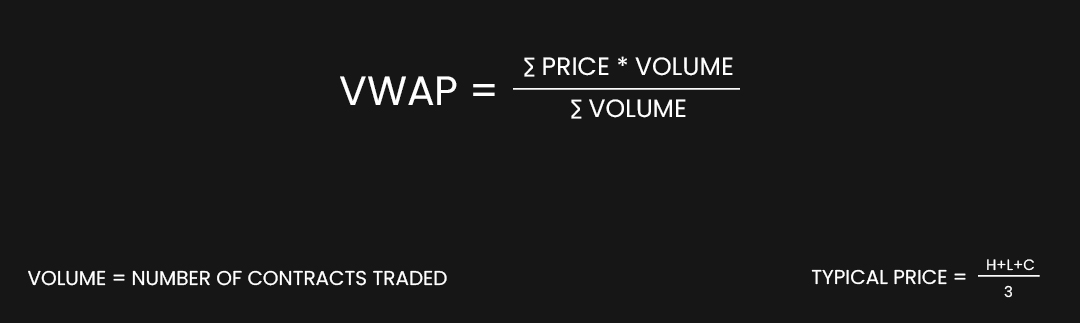
Bitcoin VWAP Trading Strategy
This strategy is your best tool for staying on the right side of the trend days.
Compared to the simple moving average, VWAP takes Volume into the consideration.
This obviously plays a significant role in all markets.
There are different VWAPs you can use in your trading and I pretty much covered all of them in an article about VWAP Trading.
But more often than not the simple approach is the best.
Using VWAP in your trading helps you stay on the right side of the trend for any given day/week without trying to catch top or bottom.
This is one of the best tools for newer traders as they try to fade every volatile move in price to catch a whole reversal.
If you struggle with this and you have a hard time to profit on trend days, you can start using a very simple trading rule.
- When the price is above VWAP, open only long positions.
- When the price is below VWAP, open only short positions.

As you can see from this chart, there were quite a lot of trading opportunities every time the market pulled back to the VWAP.
Of course, not all of them worked.
Sometimes the market came close to VWAP and continued the trend without testing it.
Or the market broke through VWAP which might give a false signal before breaking back and continuing the original direction.
Although not all the tests were perfect, you can see that by using VWAP as your trend direction tool, you would probably end up more right than wrong.
And this is pretty much the goal in trading, to be right just a little more often than be wrong.
If you want to increase your probability of trading VWAP, the best tool to add is a Volume profile.
The Auction Market Theory article will take you through the basics so you can learn more advanced stuff in Volume profile and Market Profile articles.

Bitcoin Footprint Chart Trading Strategy – Liquidations and Trapped Traders
Being able to read the Footprint chart provides a great edge by itself.
There is one specific behavior that Bitcoin and cryptocurrency have compared to other markets.
The large moves that a lot of times come out of nowhere and are characterized by large candles with huge wicks.
These more often than not result in stop runs, which are very popular strategies used by price action traders as they enter in these “sweeps” anticipating continuation after the stop run.
But how can you determine the magnitude of the move by watching only a price action chart?
You cant.
Matter the fact most traders identify these stop-runs as solely candles with long wicks that took out some previous high/low and closed below/above at the end of the time periodicity they have set up.
First of all, the time period is not really a relevant factor to start with.
If we trade above or below the key swing point and you try to follow the rule that candle has to close above/below the swing point if the hourly candle closes on tick from completing the rule, would you take a trade?

Or you can maybe change your timeframe to a 61-minute chart and all of a sudden you will have the desired close.

To put more proof to my point we don’t have to go back to the past and just look at the recent selloff in Bitcoin where the market took out and closed above two obvious swing lows and yet continued its dump to what seemed more like a random level where it reversed completely.

Being able to analyze Footprint chart and orderflow will not only keep you out of taking everything which seems like a stop-run, but you will also be able to catch those tops and bottoms where there is a high probability of reversal.
In a market like Bitcoin, this will be a tremendous edge.
If you are looking to trade these false breakouts, you want to see specific things in those longs wicks that will show the buy/sell absorption going on.
This way you will able to filter out good and bad signals and increase your probability by a lot.

As you can see in this example, the large selling really came in only on the last third push lower.
This is signaled by a high red negative delta in the bar.
You can also use TSsize and Rekt tool in Exochart which will signal these unusual large orders.

This example can be described as a perfect sweep of the highs.
The market tried to break the previous high with a high positive delta inside the upper wick.
This means that aggressive buyers tried to push prices higher but got absorbed by passive sellers.
If you are interested in how I exactly trade these setups, you can go check out the Trading Blueprint.
The key takeaway from this is that you should not try to fade every false break below support or above resistance, but rather use orderflow tools such as Footprint charts to really understand what is going on inside the candle and make a much more educated guess.

Once you see a real absorption going on, you can pull out the trigger with much higher conviction.
Bitcoin Market Profile Trading Strategy – 80% Rule
So now that we covered how you can trade a trending move and also how you can fade extension in trend, there is one last environment to talk about.
This strategy will be much more usable in periods where the market is ranging.
Although most traders oftentimes complain about ranging markets, if you know how to trade them they can be much easier compared to trading in volatile trends.
For these rangebound markets here comes the famous systematic strategy by Dalton which states that:
“If the market opens below/above previous day value area and trades back inside for two consecutive TPOs, there is 80% that it is going to revisit the other side of value.”
Although Bitcoin does not really open as it is a 24-hour market, the same rule can be applied if we start trading day above/below the previous day’s value and accept back inside.

As you can see on this trading range, on the two occasions where we opened outside the previous day value and got back in, we truly tested the opposite side of the prior day value area.
Even though this looks amazing there are few things worth mentioning about the 80% rule.
The name of the 80% rule is more of a catchphrase than really a rule.
Dalton is an ES trader so if there is an 80% chance of the Value rotation it would be during RTH hours on E-mini SP500.
You cannot take this for granted and just blindly follow it expecting the same % probability without any backtesting.
The other thing I do in my own trading is that instead of waiting for 2 TPO acceptance I use price action on lower timeframes to base my trades on.
Thanks to this I am able to position myself much better compared to simply buying on selling a 30-minute bard that closed inside the value.
This is just a tip you want to consider in your own trading, the lower timeframe patterns I use are described in the Trading Blueprint.
But the 80% rule is not the only reason why I mention the market profile for this type of environment.
Market profile is an excellent tool that you can use in ranging (and also trading) conditions to easily spot acceptance or failed auctions which will provide excellent mean reversion trades.
Much more information about that can be found in the Auction Market Theory series.
Conclusion
You can utilize these three Bitcoin trading strategies in any type of market condition.
If you are in trend, your best bet is to follow VWAP until you might spot a lot of traders being offside on the footprint chart.
If markets are calm and sitting inside the range, you can utilize Market Profile and 80% rule to play high probability rotations inside the values.
DefVader
Adam, thanks again for all you do. The Blueprint is awesome! May I ask a question? When trading BTC how do you execute your trades? Do you place orders directly through Sierra or do you use SC just for charting and then execute on BitMex’s site? Any insight would be appreciated.
Adam
Hi, thanks for the comment. I’m glad you like the Blueprint! So I used to trade on Bitmex last year with the API but now I prefer to trade with USDT collateral as things are quite volatile. Because of that, I execute on Binance but I still use Bitmex charts for my analysis. I also use Quantower with Binance Futures API where I can quickly execute and manage trades as their Web UI is pretty bad.
Eric
I would also daytrade the stuff you post on Twitter, but I’m a little bit lost what I need for that. In the above post I see you talking about a lot of names like Bitmex, USDT collateral, Binance. Can you tell me in brief where is the best place to daytrade with coins like BTC and ETH as you also do yourself . You would be very helpful to me with your answer.
Testovito
What a ratio is better to choose for a timeframe \ teak, see in your screenshot 1 hour = 60 ticks, 30 min = 20 ticks!? Is there any relation that need to follow? thanks
Adam
Tick size is constantly changing due to the volatility so it needs to be adjdusted frequently.