

Auction Market Theory – Understanding of market and orderflow dynamics
If you are interested in technical trading and spend your time during the day at any social media site, it is Twitter, Youtube, Instagram, etc.
You are most likely going to meet many other traders who like to express their opinions on the market.
“Market is at this level of support. Therefore we are heading higher.”
“We are just retraced to this level, signalled by this indicator, so we are heading this way.”
The truth is that most retail traders don’t understand why the markets they trade are actually moving.
Although all the overbought/oversold RSIs, supports and resistances or moving averages look cool on the chart, 99% of traders lack the understanding of orderflow dynamics.
And this is exactly what I cover in this article.
This is the first part of the three-part series.
Part two will cover the Market profile and part three the Volume Profile as both of them are an inseparable part of the auction market theory.
If you like this article, read the rest of the blog or join the Tradingriot Bootcamp for a comprehensive video course.
You can either read the article or watch the whole thing on youtube.
Table of Contents
Introduction
Before we start, I want to mention something which might be obvious, but I still think it is important.
Auction Market Theory, Market Profile, and Volume Profile are well-known trading concepts; therefore, you might not learn many new things if you are already familiar with these concepts.
Writing these articles aims to make a comprehensive guide for newer traders, as these concepts are currently all over the internet but not in a uniform format.
Although I hope that after you finish these articles, you will be ready to apply the ideas right away, there is nothing better than learning straight from the source.
In this case, the source being J. Peter Steidlmayer and Jim Dalton.
I recommend you to read the following books:
- Steidlmayer on Markets: Trading with Market Profile, the 2nd Edition
- Markets in Profile: Profiting from the Auction Process
- Mind Over Markets: Power Trading with Market Generated Information, Updated Edition
- CBOT A Six-Part Study Guide To Market Profile
There are some other youtube channels or free/paid resources you can find here.
If you are interested to learn how I use these concepts in my day-to-day trading, you can check out the Trading Blueprint.
Orderflow and why markets are moving
Before going into the Auction Market Theory, I feel like it is important to understand market movements’ key fundamentals.
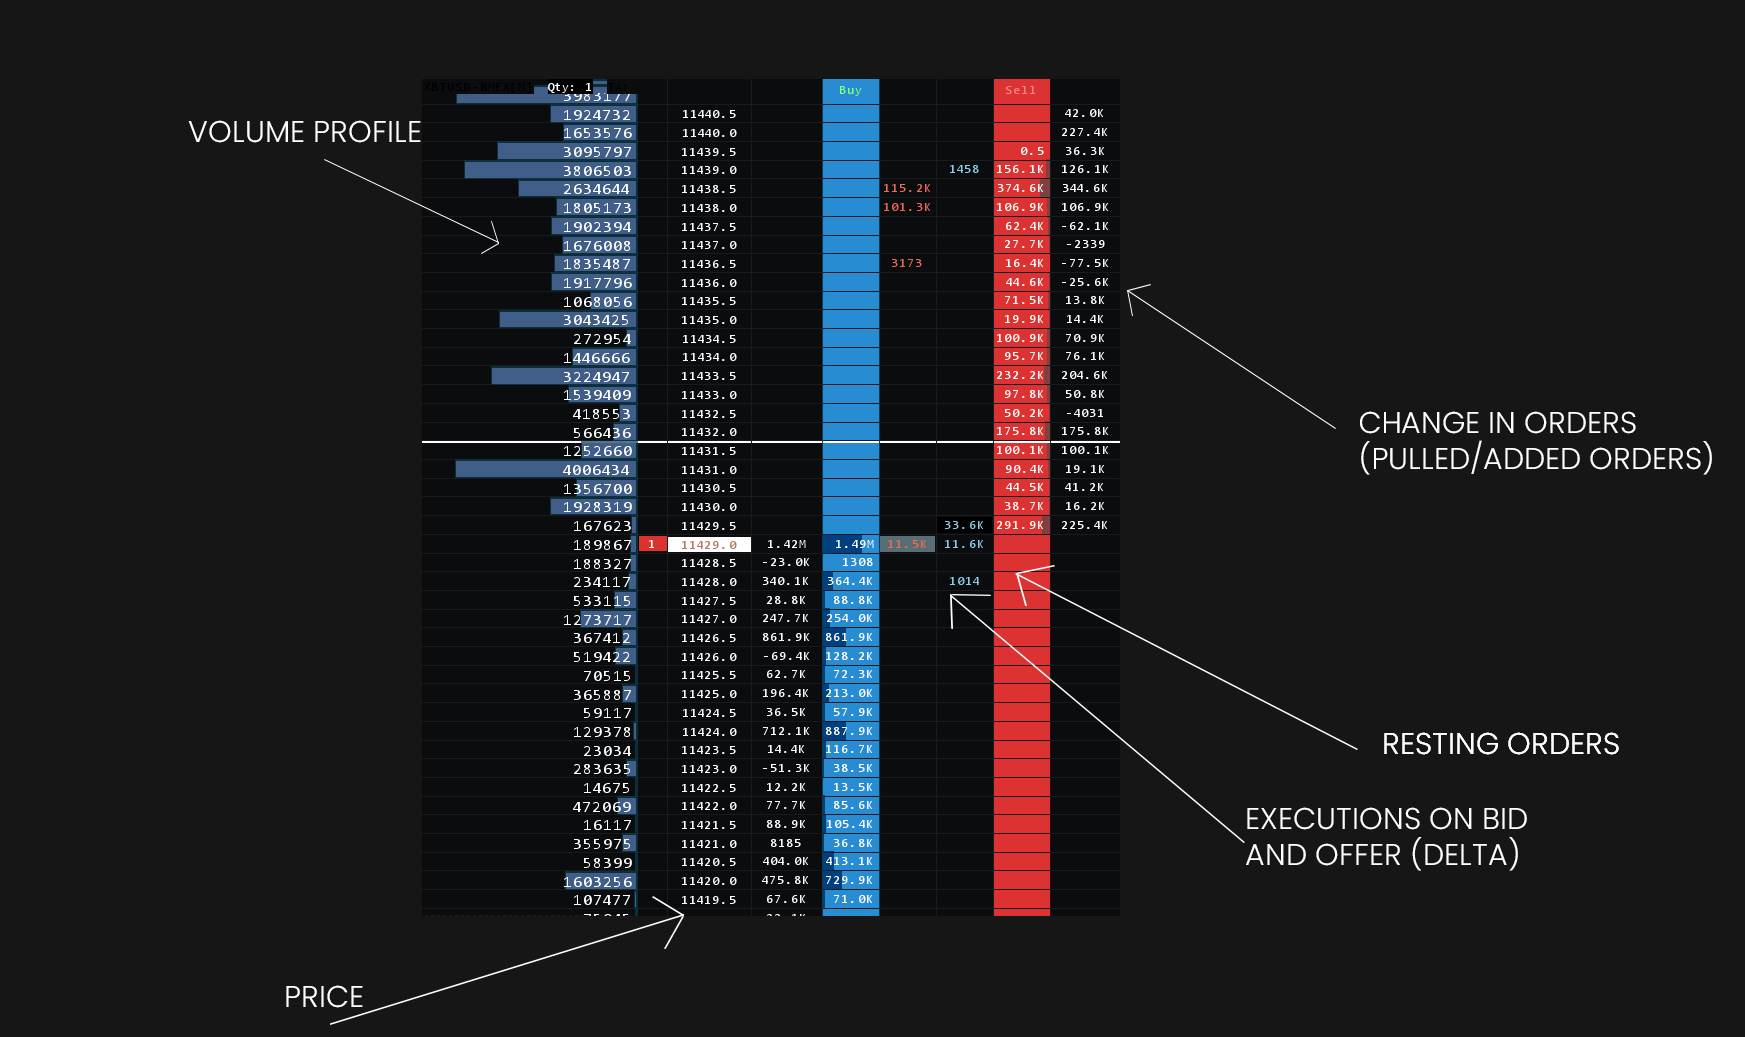
As you can see in the image above you, this is an example of trading DOM.
This DOM, in particular, shows the depth of the market for Bitcoin perpetual futures on Bitmex.
In trading, there are only two types of orders.
- Limit Orders
- Market Orders
Limit orders and stop orders
The advertisement is placed on the DOM and is executed against the market orders.
These are often called the heavier hand in the market as large players can’t afford to use market order because they would often occur more considerable slippage.
They use various advanced order types such as icebergs to hide their intention and not get front-runned.
If you are putting a limit order to the order book, you are making liquidity.
Because limit orders are the heavier hand, they are the ones that stop markets in trending environments from advancing or declining as aggressive market participants (market orders) often hit the limit walls and get absorbed.
Market Orders
Market orders are executed “at the market”.
They show us the finalized transactions on the bid and the offer, referred to as the delta.
They are executed against the limit orders.
Market orders are required for the market to move.
Whenever market orders exceed the number or limit orders at a given price point, the price ticks up or down.
As you take liquidity from the order book, you are a liquidity taker every time you use the market order.
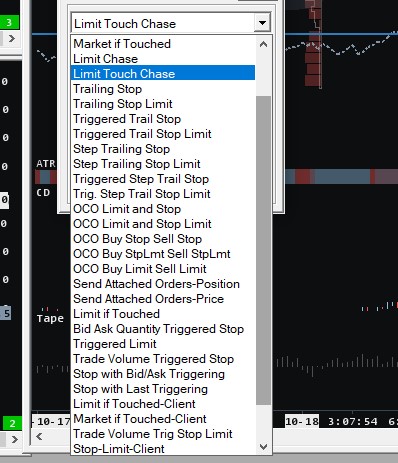
Although brokers off a lot of different order types, these are still just market or limit orders.
These are very simple yet important concepts to understand.
If you have a high number of resting orders but not many traders executing them, you have a low volatility environment.
These are often cases of more liquid products such as Euro Stoxx 50, German 10-yr Bund, or treasuries.
The opposite would be the high volume with low liquidity.
In these markets, aggressive participants enter the market with a not strong counterparty at the order book, causing high volatile movements.
This is the case for markets such as Dax, Gold, YM, or Bitcoin.
There are also other tools that show orderflow, such as Times and Sales or Footprint, which I covered in this article.
What is Auction Market Theory?
J. Peter Steidlmayer developed the concept of Auction Market Theory.
Jim Dalton was one of the first to recognize the value of Steidlemeyer’s ideas and contributed to them in his book Mind Over Markets.
Auction market theory breaks down the market’s primary purpose and how market participants interact to fulfil this purpose.
The main idea lies in the fact that financial markets are no different from any other auction where buyers and sellers meet daily.
There are two major things to be achieved.
- Facilitate trade in the two-way auction process
- Seek fair value of the asset
Auction market theory translates this process through supply and demand dynamics and price discovery.
Two-day auction means that end of the “up” auction is followed by the beginning of the “down” auction and vice versa.
This process is then represented by tools such as Market or Volume Profile.
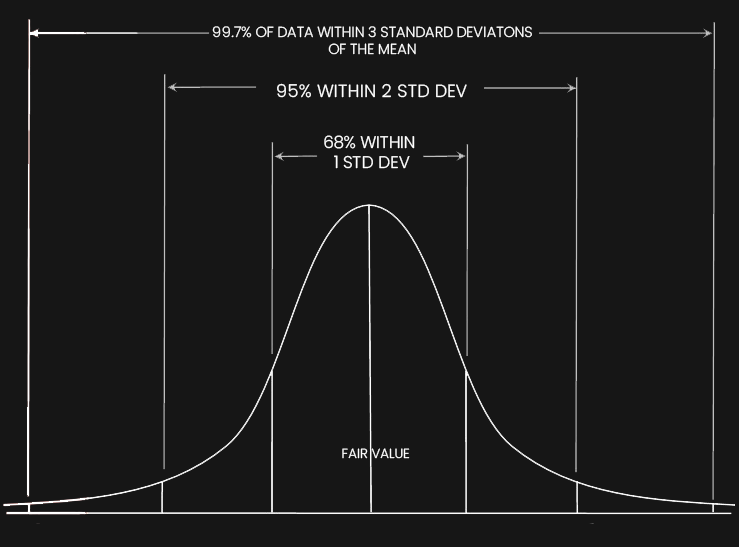
These bell-shaped curves represent 68% as 1 standard deviation from the mean.
This is what we know as the Value area.
A practical example of Auction Market Theory in the financial markets
If we look at a hypothetical example in the stock market, let’s say that one share of Samsung stock trades at $50.
A New Samsung phone comes out, and it’s terrible; the battery is not working, overheating, etc.
Because of this event, Samsung stock starts to dropping on its value until it finds new buyers at, let’s say, $30 per share price.
This is where is the new value area created.
After some time, phones get repaired, and the price of the stock starts to rise again. Where is the market likely to stop? Previous value area around $50.
This is eventually what every market does as Market participants negotiate prices between balanced and imbalanced values.
Auction Market Theory defines an area where 68% of the volume has traded as a Value Area.
Inside Value area is also a point of control; this is the level where the market traded most volume or spent the most time.
- A market profile represents the Value area and point of control based on time.
- The volume profile represents the Value area and point of control based on volume.
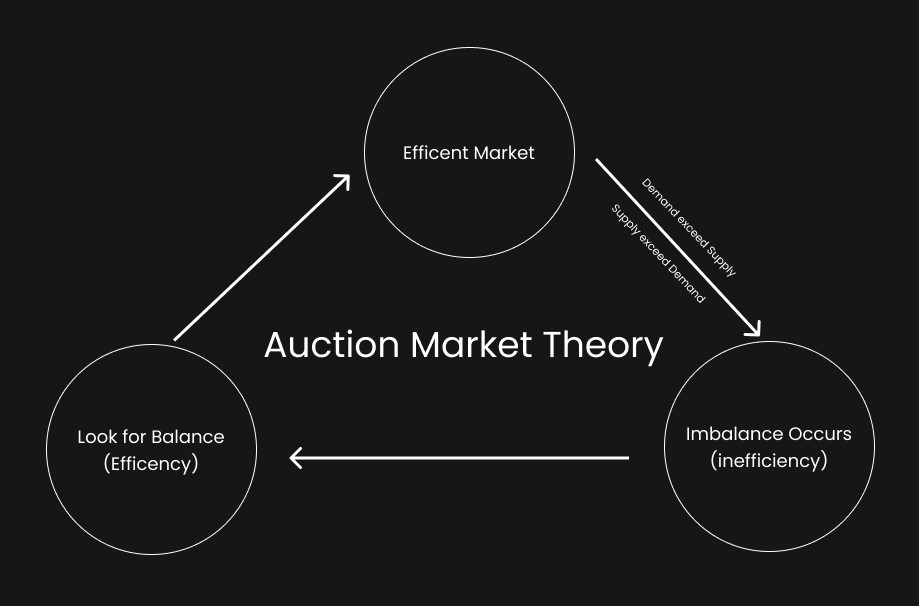
This advertising mechanism and price always seeking value can be represented in the image below.
Key components of Auction Market Theory
There are three key components of AMT.
- Price – Advertise opportunity in the market
- Time – Regulate price opportunity
- Volume – Measure the success or failure of the auction. Volume measures the interaction of market participants at different levels.
To fully understand things, we have to understand the context of a given market as there are two types of auction.
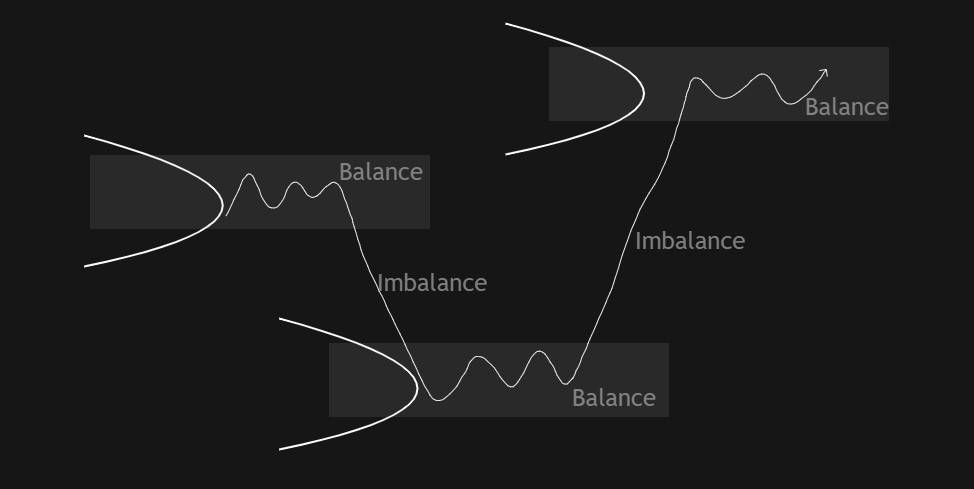
Balance
In a balanced market, buyers and sellers agree on prices, and they are willing to buy/sell for current prices.
It is because they perceive those prices as fair value.
A balanced market is usually represented by lower volatility.
Prices remain more-so the same, and markets are ranging.
Thanks to the Market or Volume profile, we can easily recognize the fair value.
Fair value looks like the Gaussian bell-shaped curve, which I already showed you in the picture above.
If the market would be in balance forever, it would just oscillate around the fair value, which we know is not a common theme in the financial markets.
With new information coming to the market, these can be fundamental or technical drivers.
Markets leave the fair value and shift to the second environment.
Imbalance
The imbalance is the exact opposite of the balance.
There is a disagreement about the fair value.
One side of market participants is more aggressive, which causes the market to trend.
Markets in general only trend about 20% of the time and range 80%.
The general rule of thumb is that once the market is inside the value, it will more likely stay in balance and explore inside the value range.
But if the market is an imbalance, it will often drift higher/lower until it stops, usually inside a previous value area.
Initiating and Responsive Activity
Although the market spends 80% of the time in fair value, it often tries to leave it, when this happens there are two possible scenarios.
There are two types of activity Steidlmayer called:
- Responsive
- Initiating
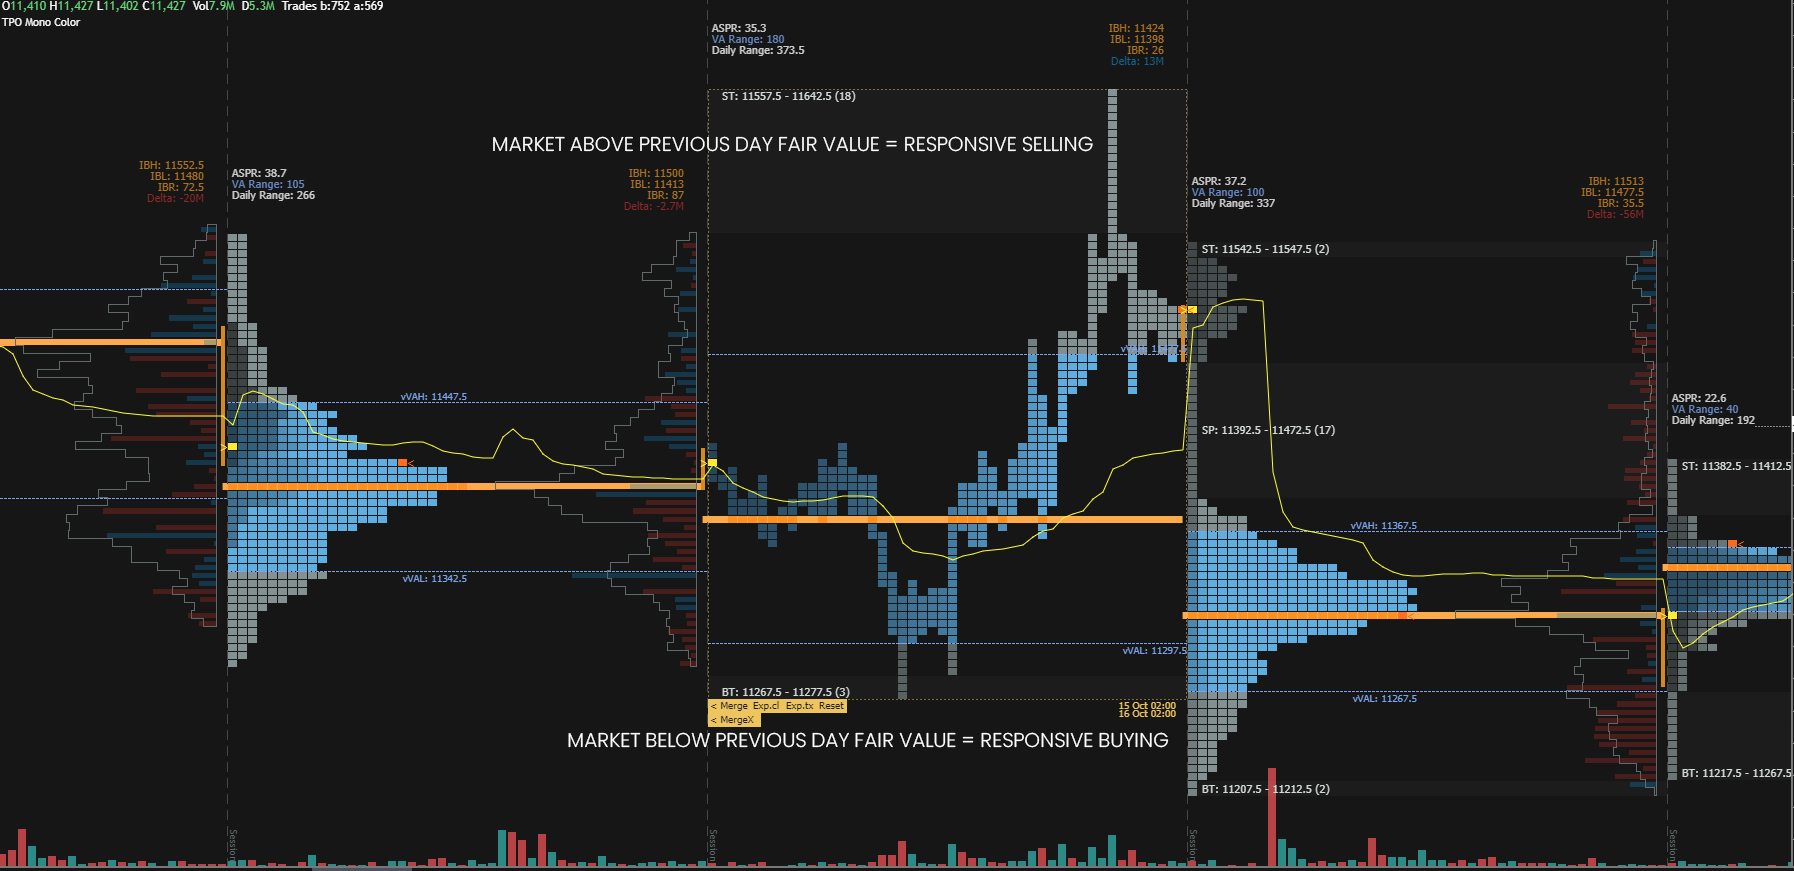
Responsive Activity
Responsive activity is the expected behaviour.
When the market breaks below the value, buying is expected.
When the market breaks above the value, selling is expected.
For example, if the market opens above the previous day value area, we can expect that prices are too high compared to the previous day’s fair value.
Therefore return back to the previous day value is expected.
If the market opens below the previous day value area, it’s too cheap, and we can expect the responsive activity to buy it back to the value.
Responsive activity is often seen in quick spikes and stops runs where the market reaches a certain level of liquidity and returns to the fair value.
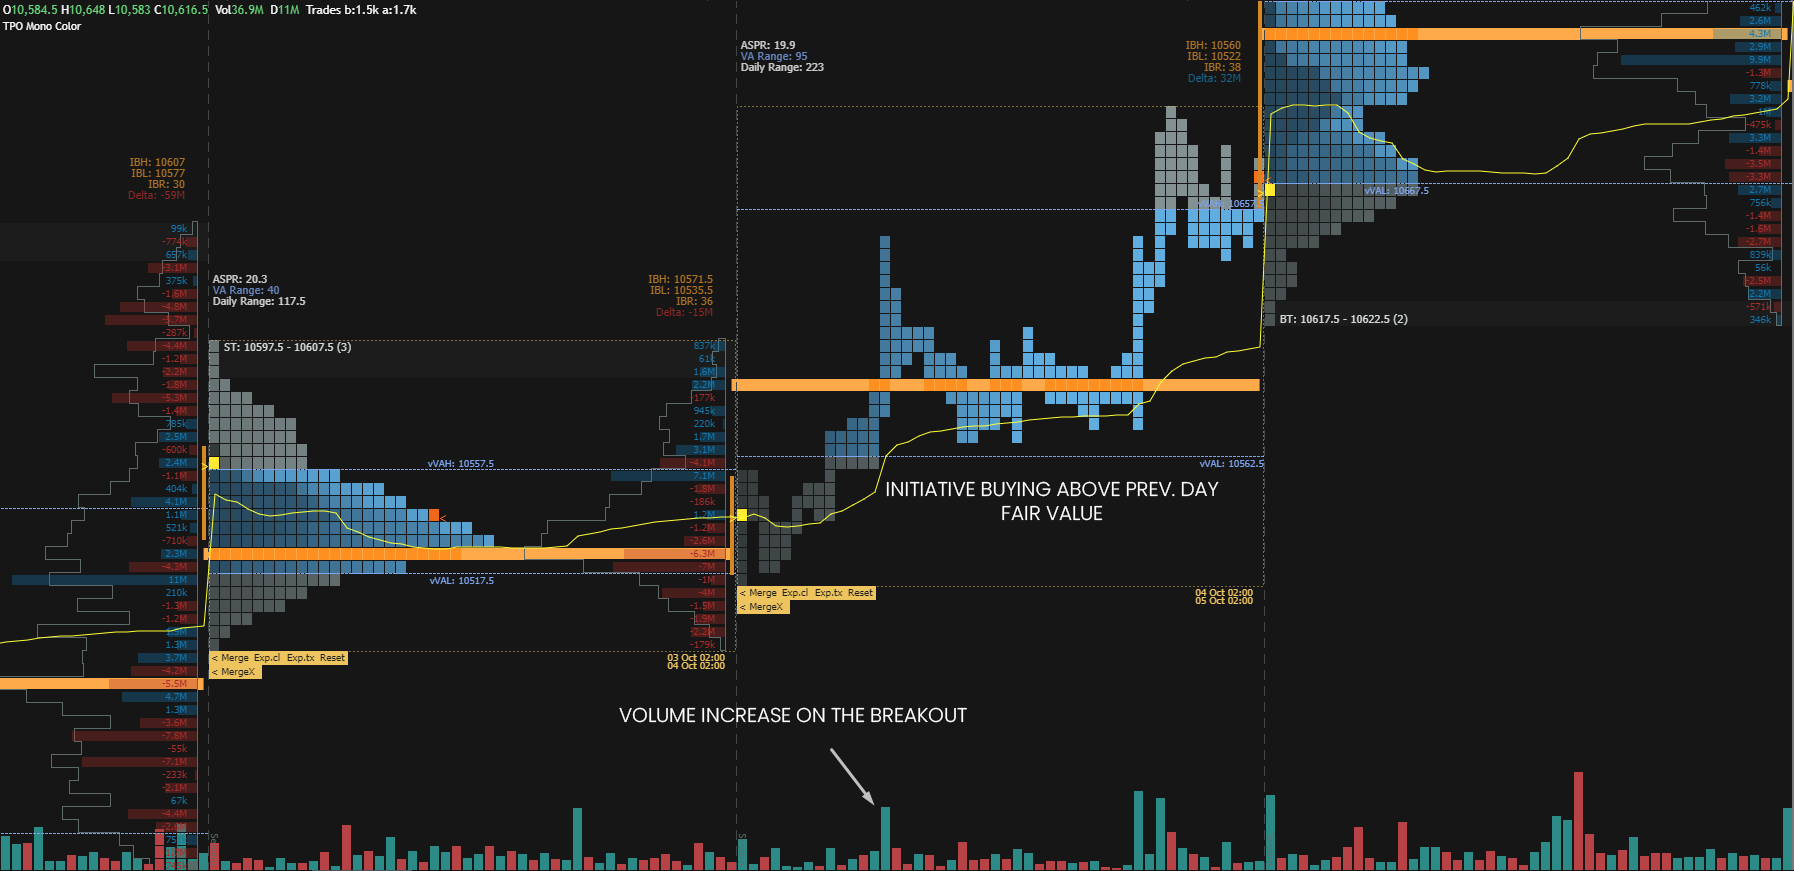
Initiating activity
Initiating activity is unexpected.
When the market breaks below the value, selling is unexpected.
When the market breaks above the value, buying is unexpected.
These moves only occur when the environment shifts as a perception of the fair value changes.
We can spot these as price breakouts out of value and getting accepted.
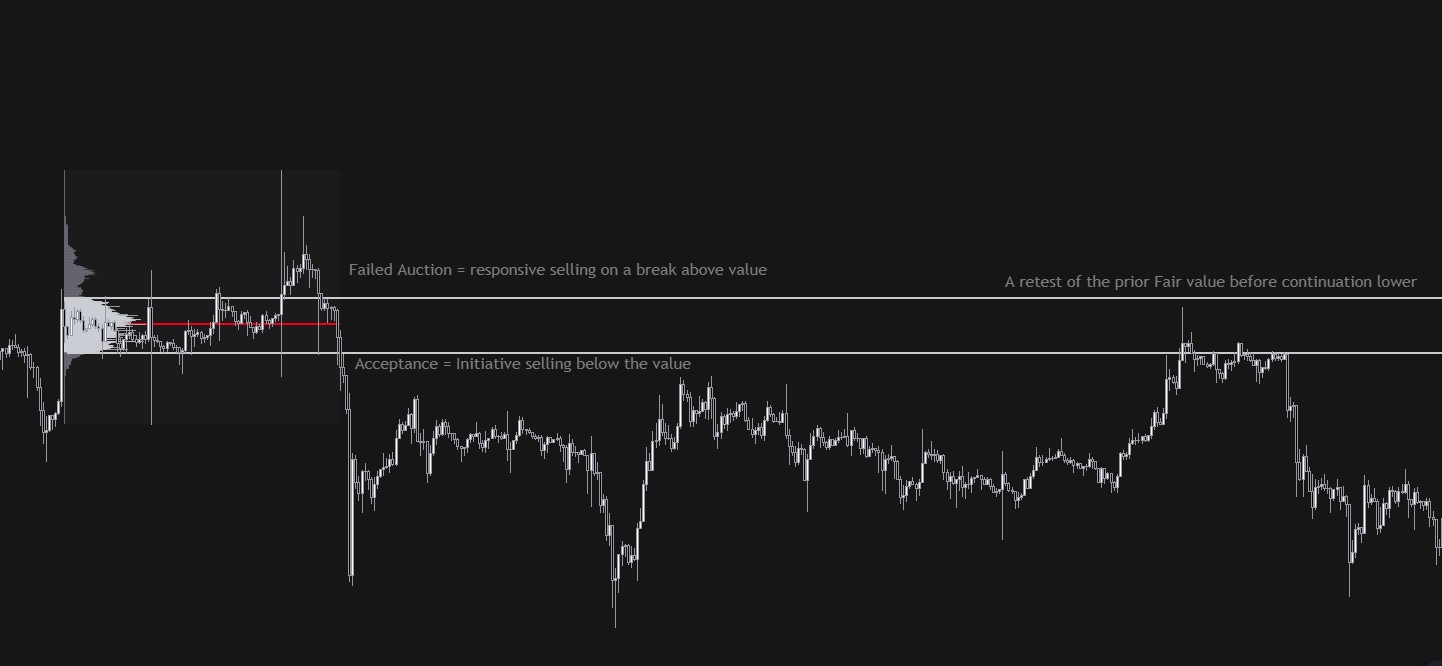
Acceptance and Failed Auction
Initiative and responsive activity is more so a theory, but luckily we can pretty quickly determine if new prices are getting accepted or not.
Acceptance
When price breaks fair value on significant volume and convincing price action, we can expect new prices to be accepted above or below the fair value.
These are usually the support/resistance flips for more price action traders with enough time and space before the retest.
This tells us the market participants agreed on new prices, and we can expect the continuation once the old value area gets tested.
Failed Auction
The failed auction occurs when prices come outside of the value and do not gain acceptance.
There is no increase in volume on the breakout, and from a price action point of view, we can see long wick and quick returns back to the point of breakout.
These are often the V-shape reversals to the levels.
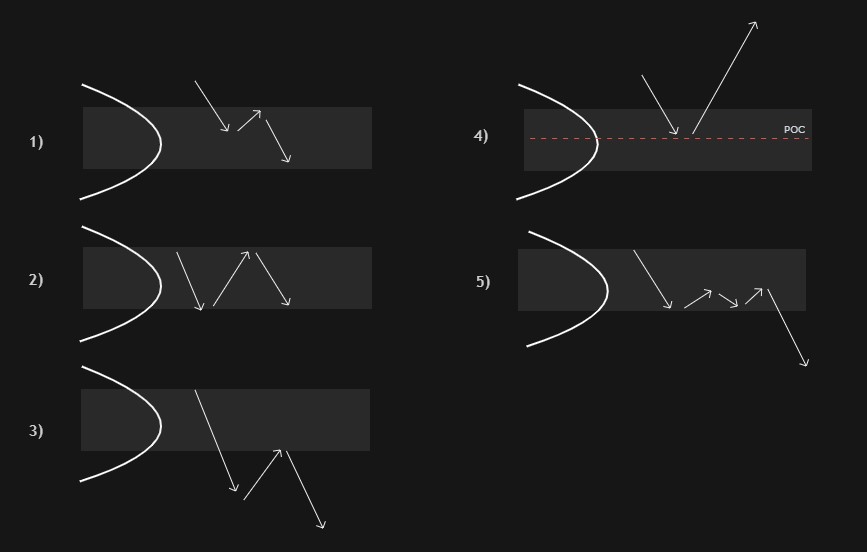
The Five Auction Market Theory Rules
Although Auction Market Theory is not a trading strategy, some rules can be used in your day-to-day trading.
I keep these in my every day and use different price action patterns and orderflow behaviour to execute my trades.
If you are interested to learn these patterns, you can check out my Trading Blueprint.
- If the price accepts into the balance area, it’s likely to revert to the other side. Price often retests the edge of the balance area before travelling to the opposite side.
- Price inside a balance is expected to reject the edges and is choppier.
- Once price accepts outside the balance, is likely to become imbalanced and seek new value – often POC of older balance area.
- If the price reacts strongly from POC, it can disrupt the rule #1.
- If time/volume build at the edge of a balance, price is likely to push through.
In Conclusion
Auction market theory was one of the most significant breaking points in my trading as it shed new light on understanding the market dynamics and behaviours.
Many traders only chase different price action patterns or technical indicators.
See where fair value is and determine if markets accept or reject new prices is much more important than anything else.
Market and Volume profiles build upon the auction market theory, and we are going to explore those in the next articles.