
Market Microstructure Explained – Why and how markets move
We live in interesting times.
Nowadays, trading is presented as an easy escape from the 9-5 rat race, something that is extremely simple, and you can do it from anywhere in the world from your mobile device while making six figures every year,
All of this simplification of the financial market also try to force people different ideas why markets are moving in the first place.
In most cases, trading is presented as a game of retail traders and predatory market makers and smart money constantly running stops of small traders creating liquidity in the market to initiate moves.
But is this true? Are markets this black and white with these market makers playing this hidden hand that move the markets all the time?
This is what we are going to explore in this article.
It is worth mentioning that markets are definitely manipulated and there are many ill practices happening in financial markets no matter what market you decide to trade.
But not every single price move hides behind the market manipulation.
If you like this article, read the rest of the blog or join the Tradingriot Bootcamp for a comprehensive video course, access to private discord and regular updates.
For those who are looking for a new place for trading crypto, make sure to check out Woo. If you register using this link and open your first trade, you will get a Tier 1 fee upgrade for the first 30 days, and we will split commissions 50/50, which means you will get 20% of all your commissions back for a lifetime. On top of that, you will receive a 20% discount for Tradingriot Bootcamp and 100% free access to Tradingriot Blueprint.
Table of Contents
What is market microstructure?
Market microstructure breaks down the whole theory behind how markets move.
Understanding market microstructure is important as you will properly understand supply and demand dynamics behind every market movement instead of blindly buying and selling without paying any attention.
Sometimes you execute the trade where you will get filled at a completely different price than you originally wanted.
This is often common in illiquid markets such as various altcoins or options and the liquid market during high volatility events.
Market microstructure is quite a complex topic, to the extent that it is lectured in universities and involves a lot of math.
Some of these concepts are beyond the scope of this article and not necessary to understand when it comes to real-life trading.
For those who want to learn more and go in-depth, I recommend checking out the Financial Markets course by Egor Starkov taught at Kopenhagen university in spring 2020.
It is entirely free and can be found on Youtube.
Another great video resource about Market Microstructure is from Crypto Cred, which goes well in the information shared in this article.
Also beyond this article’s scope is high-frequency trading used in quantitative firms.
This requires a lot of math and programming beyond my knowledge; therefore, I don’t feel educated enough to write about it.
But I believe that the knowledge that I will present in this article will be more than enough for you to understand why and how markets move, and at the end of it, you will be able to make more educated trading decisions.
So what is Market Microstructure?
Market microstructure studies inner-workings of financial markets.
How markets operate, how prices are formed, the behaviour of traders, or how exchanges are structured.
If you go to any exchange, it doesn’t matter if it is cryptocurrency, forex or stock exchange. Placing a trade takes a couple of seconds.
Your trades get executed, and you are in a trade.
Although this is a swift process, every market works on a system of open auctions.
This means that there has to be a seller for every buyer and vice versa.
Your counterparty is either another trader, institution, algorithm or market maker.
Especially market markers are often presented as this evil entity in the market that always run stops of retail traders.
This is not true as the market makers’ job is to stay delta neutral and capture bid and ask spread.
Bear in mind that in this case, delta is a different term than used in orderflow trading.
In this case, the delta represents a directional bias towards the underlying.
If you buy stocks, Crypto or options, you can hear that you have a delta one position; this means that you get directly affected when the underlying asset moves.
If you are delta-neutral, you are not affected by moves of underlying assets.
Market makers are delta neutral to capture bid-ask spreads; options trades are often delta-neutral because they are trading volatility and express their opinions in buying or selling straddles or using other neutral strategies.
Market makers will be covered more in this article; if you are interested in how volatility trading works, I did a little introduction about derivatives trading.
What truly moves the markets
Who moves the markets?
Buyers and sellers (duh).
Markets are moved based on supply and demand dynamics.
When buyers and sellers agree on fair prices, markets are in equilibrium.
In other words, they range.
When there is an imbalance between supply and demand, markets trend.
You often hear that markets went somewhere because there were more buyers than sellers or vice versa.
This is not true due to the open auction that I mentioned before.
For every trade executed in the market, there has to be a counterparty; because of that, for every buyer, there has to be a seller and vice versa.
Markets than just simply function based on available liquidity.
As some of you may know, liquidity represents the number of orders resting in order books, and volume represents the number of orders that got executed.
Some markets move a lot, and some don’t move at all.
Let’s imagine you have bought Bitcoin, and your position is up 5% on a day.
That is, of course, awesome, but you have skipped on buying Solana simultaneously, which ended up being up 15% on a day.
Why is that?
Chris Lori once said that volatility is a function of available liquidity.
Less liquid markets, i.e. having fewer orders resting in the order book, will have much easier times getting moved around than markets with well-populated order books.
So if Bitcoin has $10m, buy and sell orders are resting on both sides of the book, while Solana only has $2m on both sides.
Solana will move much more, both up and down, as it is easier to push this market compared to Bitcoin.
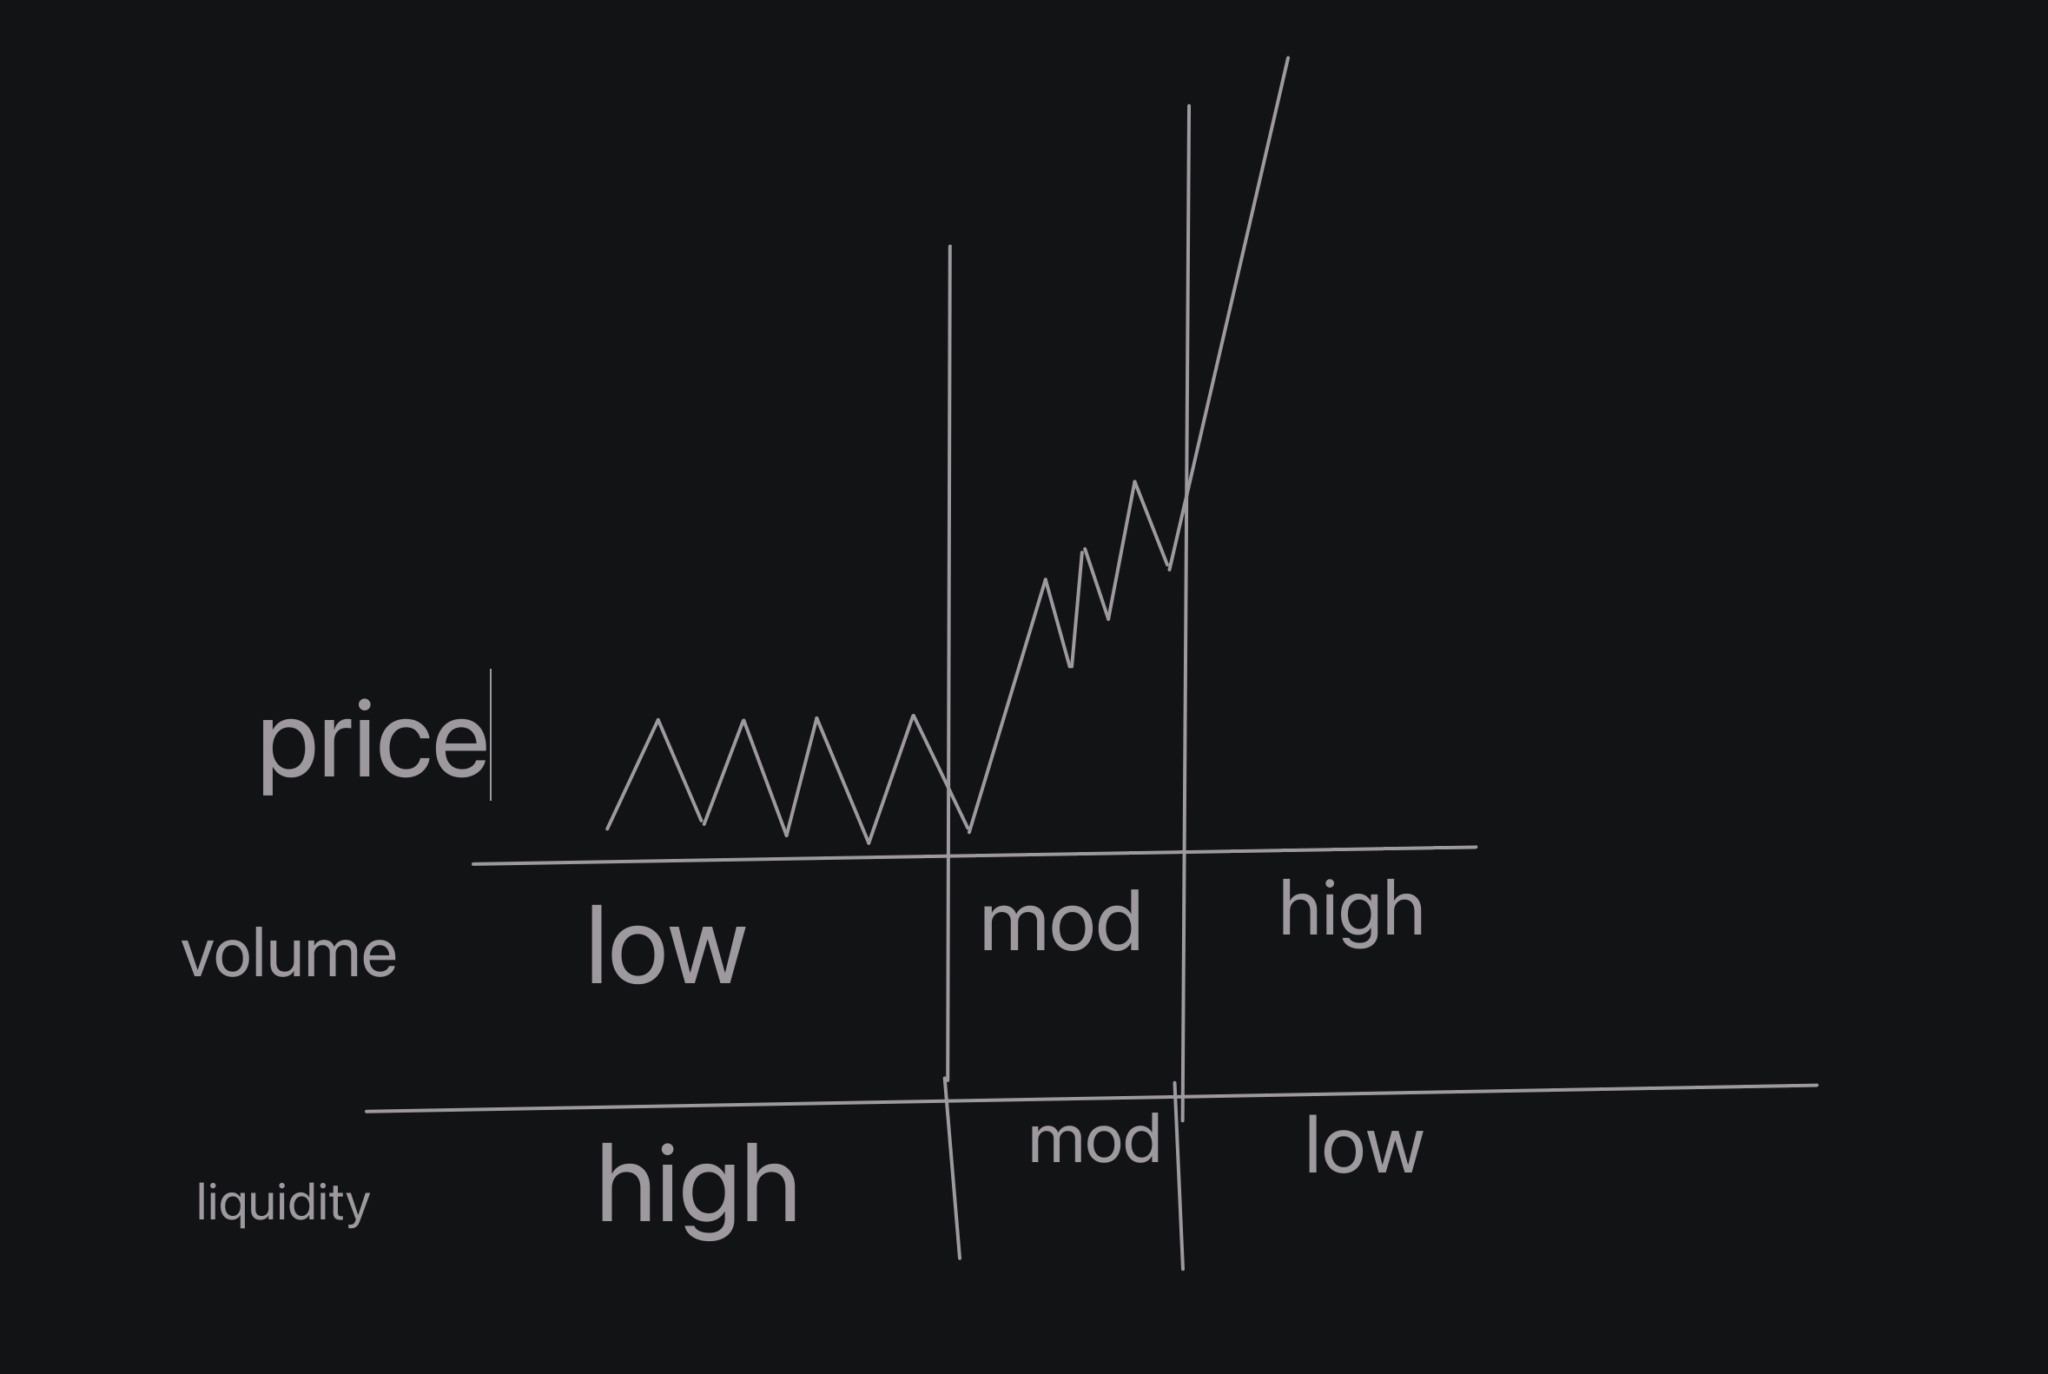
Markets then can be separated into four categories based on their available volume and liquidity.
Markets with high volume and low liquidity
These are markets that move a lot. There is a lot of aggression (market orders) coming into markets that don’t have a lot of liquidity (resting orders) to take the other side of the trade.
This can lead to thin market moves represented in price gaps, causing slippage for traders.
If liquidity is provided only by HFT (high-frequency trading) algorithms, we often see a flash crash or liquidity cascade in the market.
In Crypto, you are probably familiar with these liquidity cascades that happen when only provided liquidity comes from ongoing liquidations without any counterparty of real buyers or sellers.
Markets with low volume and high liquidity
Another extreme is the opposite of the first example.
We can see this often in very thick markets such as treasury bonds.
Order books are well-populated to the extent that it requires a lot of buying or selling power to move markets in any significant way.
This results in prolonged market movements with very low volatility.
Markets with high volume and high liquidity and markets with low volume and low liquidity.
The last two cases are what we can consider moderate market movements.
The amount of market and limit orders is equal; therefore, they are matched equally in order books, and markets represent “normal” behaviour.
To represent this in a simple drawing, all different scenarios would look like this.
Understanding market movements
So why do markets turn at support and resistance levels or tend to probe beyond swing highs and lows before reversing?
The answer to this will probably be less exciting than some made-up story about market makers running other people’s stop losses. Still, it does not change how markets operate.
There are mainly two reasons why the levels and areas on the chart react once they are hit, and they have been covered in a research paper called “Why orderflow is so persistent?” by Bence Toth.
Those that are not fans of reading can watch this video from Young Tilopa.
The first reason is called herding; this is described as just simple behaviour based on human psychology.
Everyone is looking at the same chart, and some levels will just be apparent.
Horizontal and diagonal support and resistance levels, moving averages and so on.
Of course, higher timeframes levels will play more significance because more people are looking at them.
For example, a 200 moving average will play stronger dynamic S/R than plotting it in a 1-minute timeframe.
As described in the research paper, herding is only a minor cause of price reactions. You all probably know that when levels on the chart are apparent and draw much attention, behaviour around them is rarely textbook.
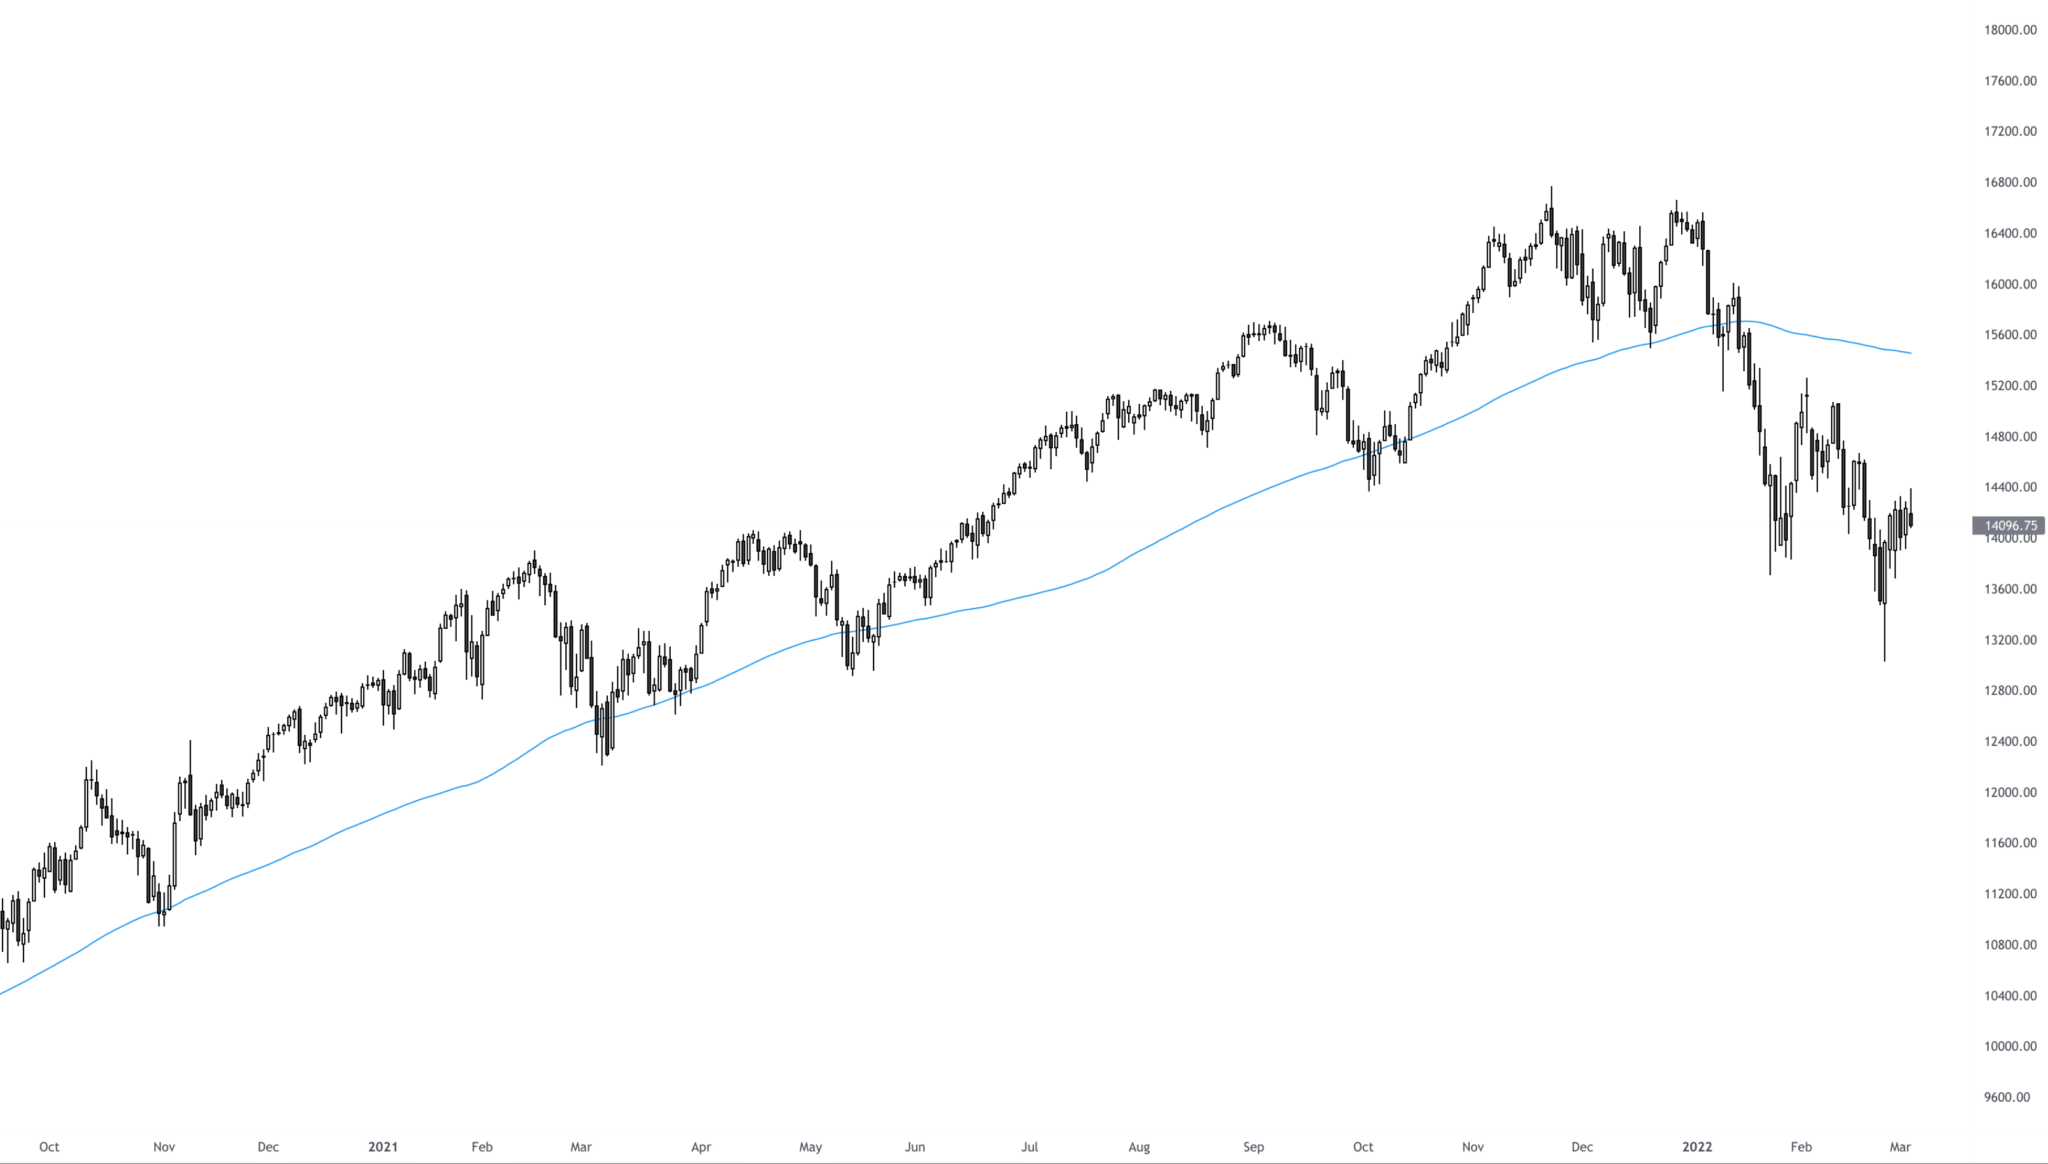
The chart above shows Nasdaq futures on a daily timeframe with 100DMA, a popular tool for trend followers; However, the market bounced from on multiple occasions; the test was rarely perfect as there were several daily closes below it in most cases.
This could signify a trend break and continuation lower for many traders.
The main reason markets react at previously significant levels is order splitting.
If you are a trader who trades with a large size, you will face issues in execution.
When you want to enter the trade, you have pretty much two options.
You have more options that I cover later on, but let’s stick with the simple market and limit orders for simplicity.
If you use the market order, i.e. opening position at once, you will get slippage if the counterparty on the opposite side is not sufficient; this will result in getting into a position for a much worse price than you originally wanted to.
Leaving a limit order is also not the best solution as your intentions will become apparent to everyone, and you might get front-runned.
This is why large traders split their order into areas of interest and slowly fill the trades.
So how do you find these levels?
Well, technical analysis can be pretty subjective a lot of times, but one of the things that can show a clear picture is often a volume and volume profile.
Looking at areas of highly executed volumes and where the market “picked up the pace” is one of the ways that I use in my trading, and I cover more about it in Tradingriot Bootcamp.
If we look at the same Nasdaq chart, you can see that after the market “picked up the pace”, it returned to the point of control which is the area of most executed volume.
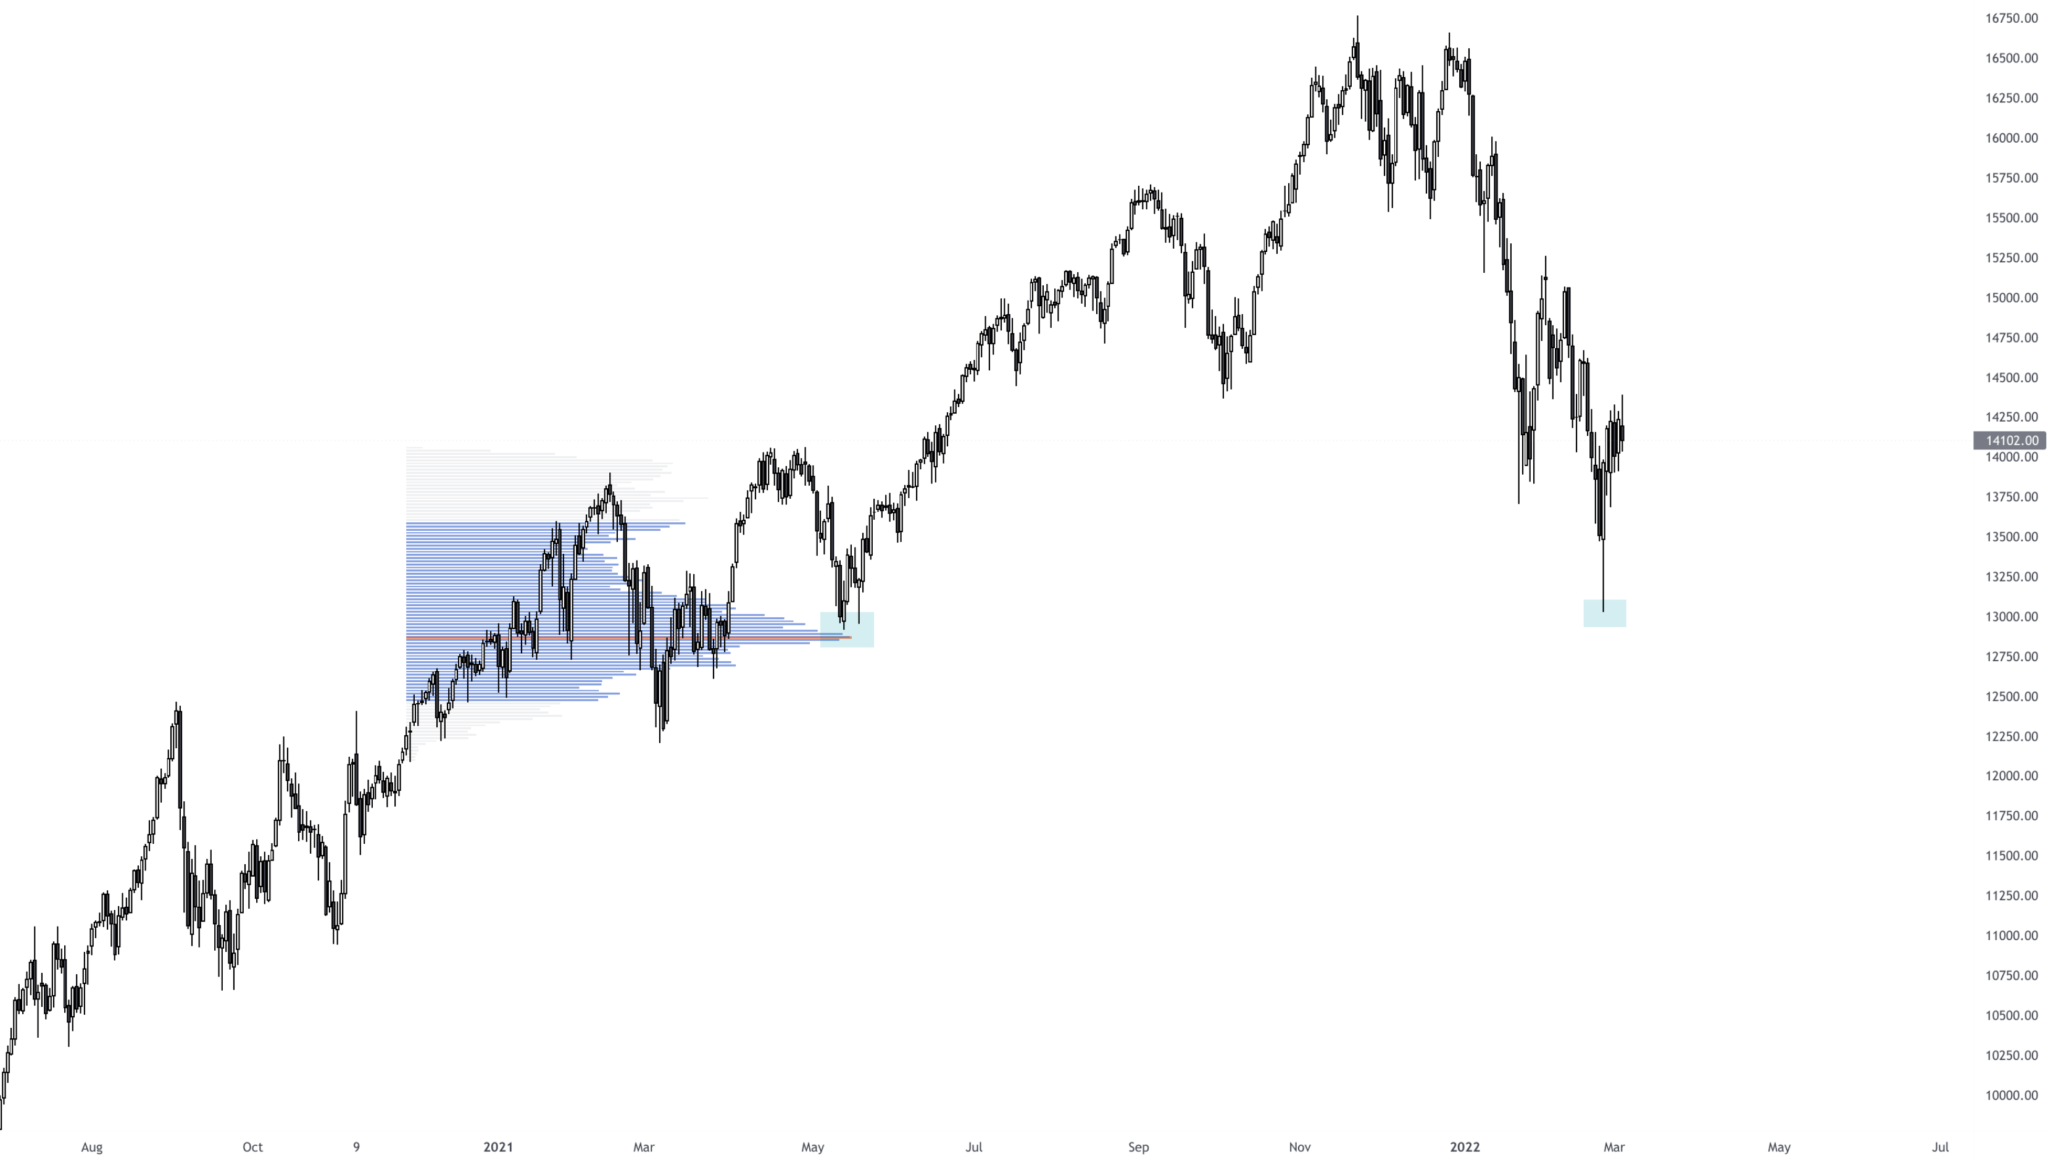
This is the area where the most trading was done in the whole prior range or, in other words, where the most size was executed; you can also see that several months later, after market sold-off, it bounced from the same point of control again.
This, of course, works on all timeframes, and there are more ways of spotting areas of high participation.
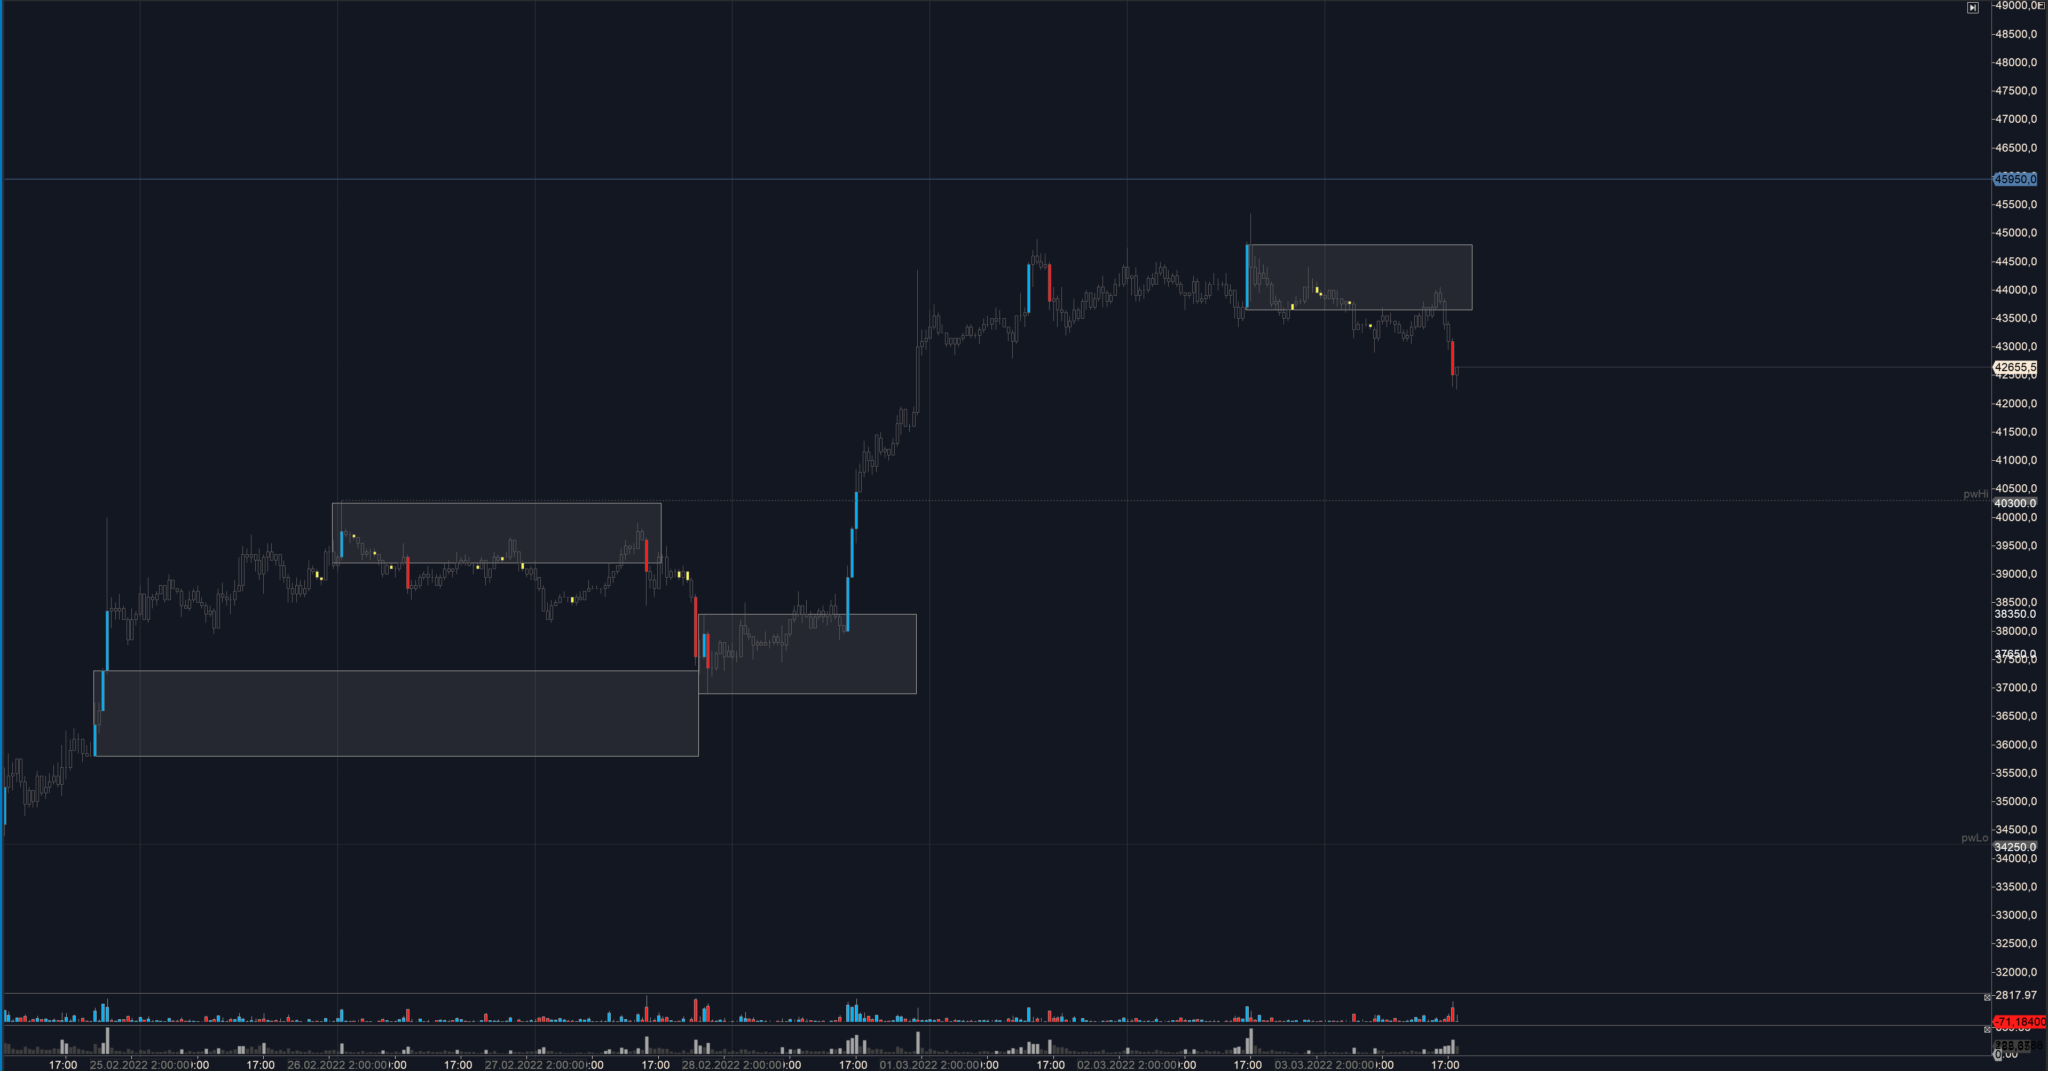
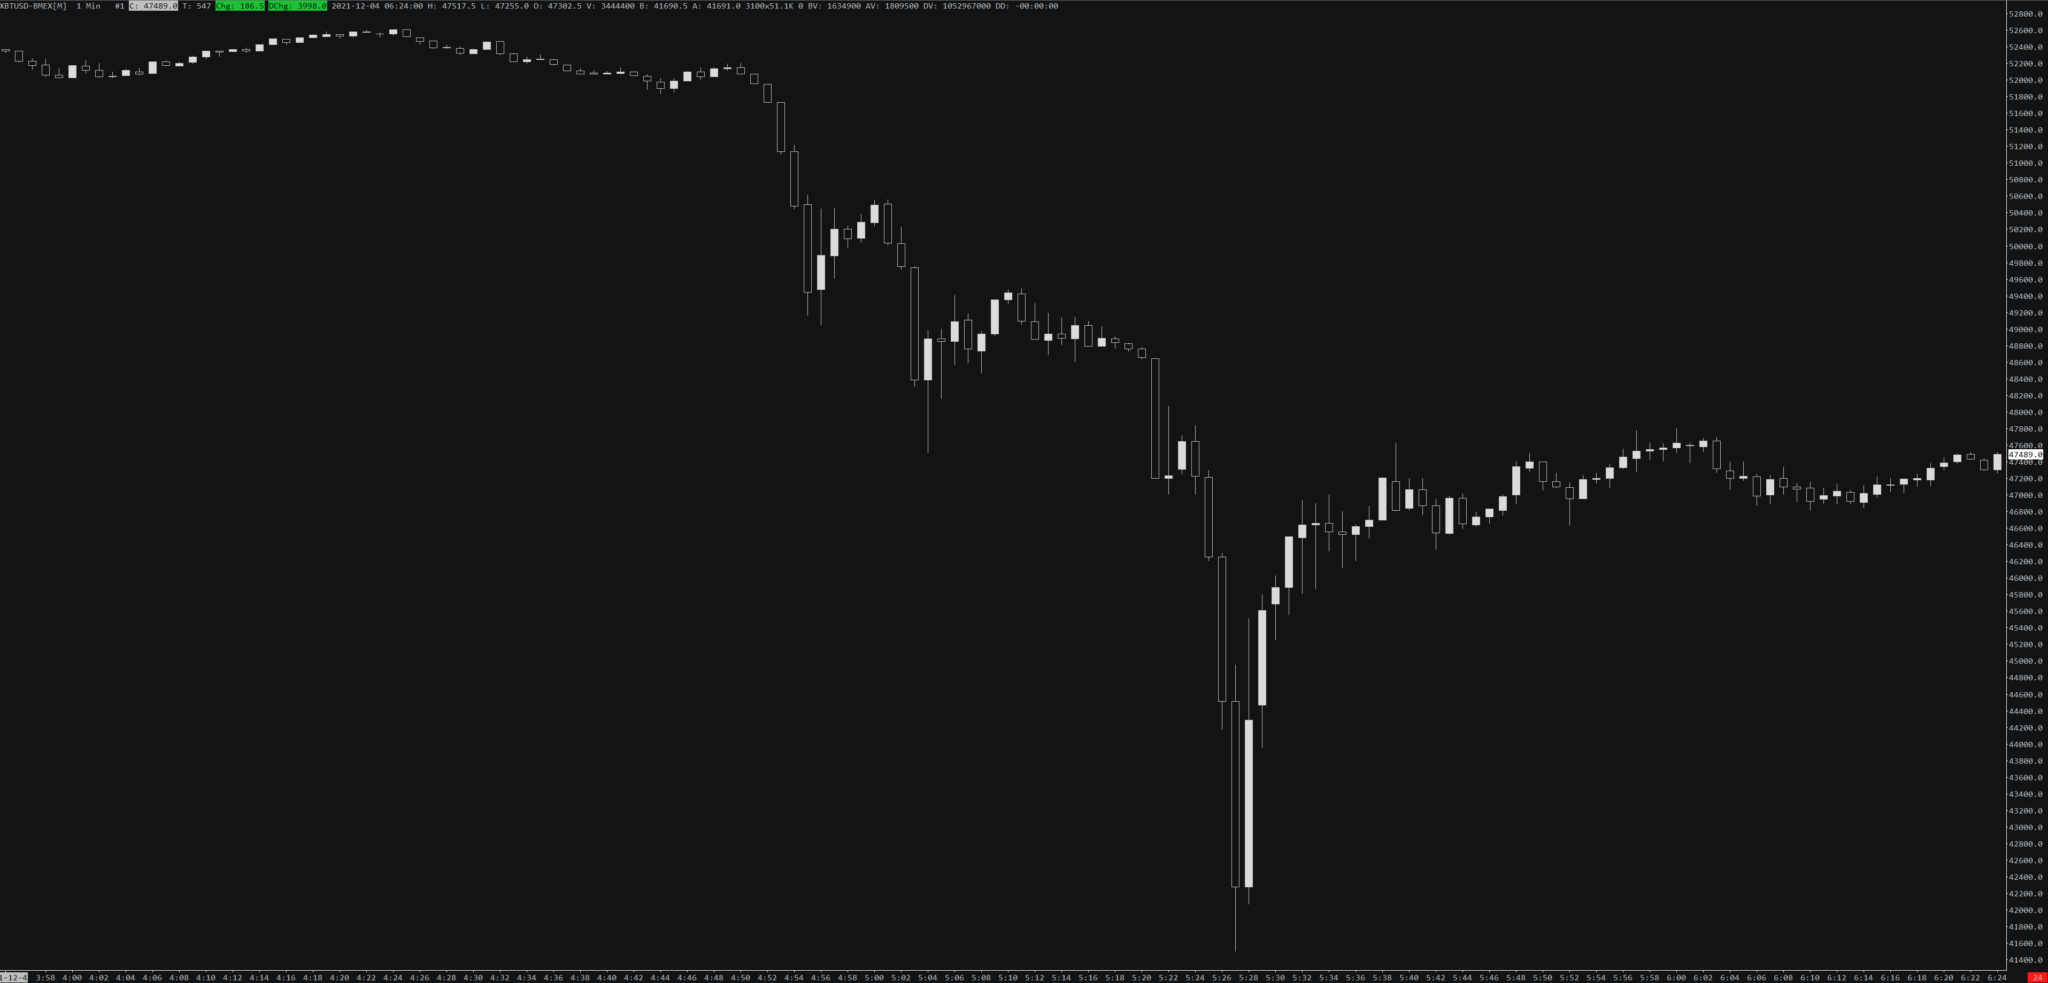
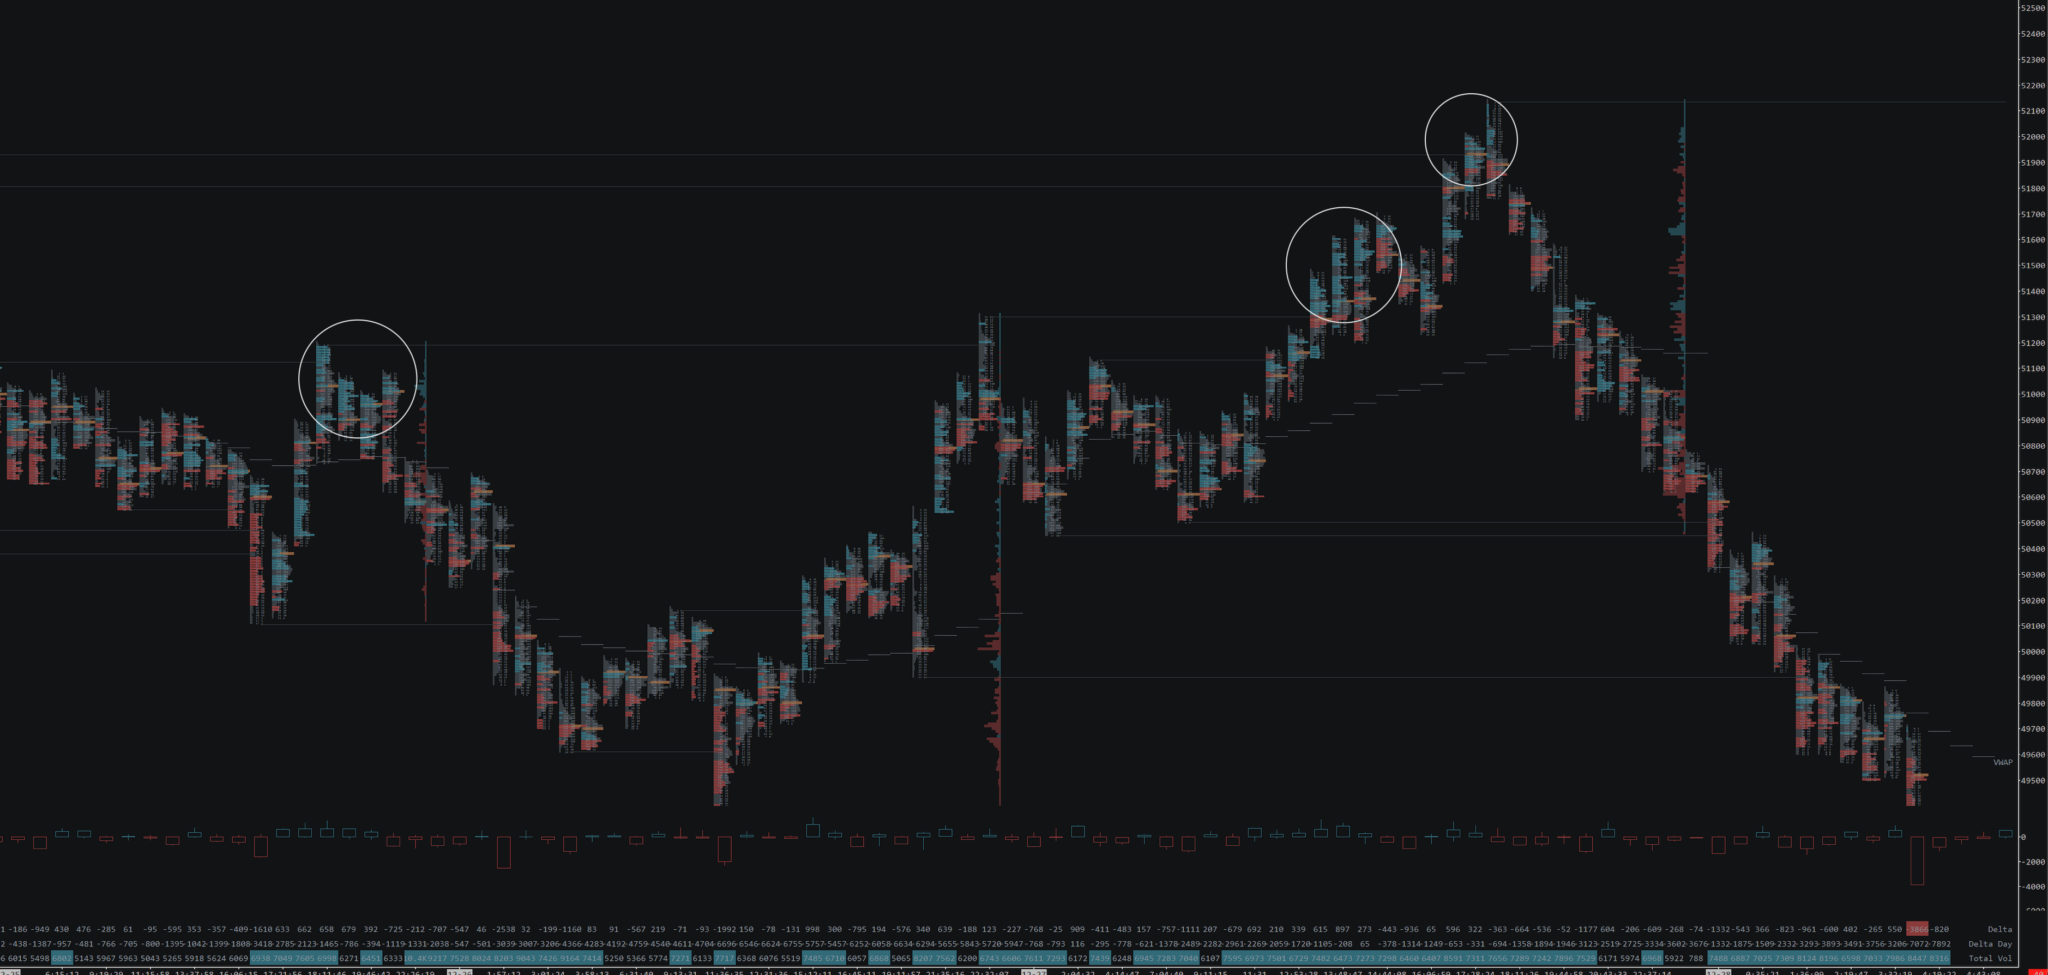
This 30-minute Bitcoin futures chart shows blue and red coloured candles; these candles are not coloured based on volume but based on delta above a certain threshold.
If you don’t know what delta is, delta symbols are the market orders that were executed in futures trading.
As you can see, on several occasions, these candles acted as future levels of support and resistance once the market traded above or below them.
Bid and ask spread
As I have already mentioned, markets work in the form of an open auction.
For every buyer, there has to be a seller and vice versa.
Traders willing to buy and sell an asset are placing their orders in the order books.
These resting orders are what is called liquidity.
You are a liquidity maker if you are putting orders into the order book (place limit order).
You are a liquidity taker if you take liquidity from the order book (use the market order).
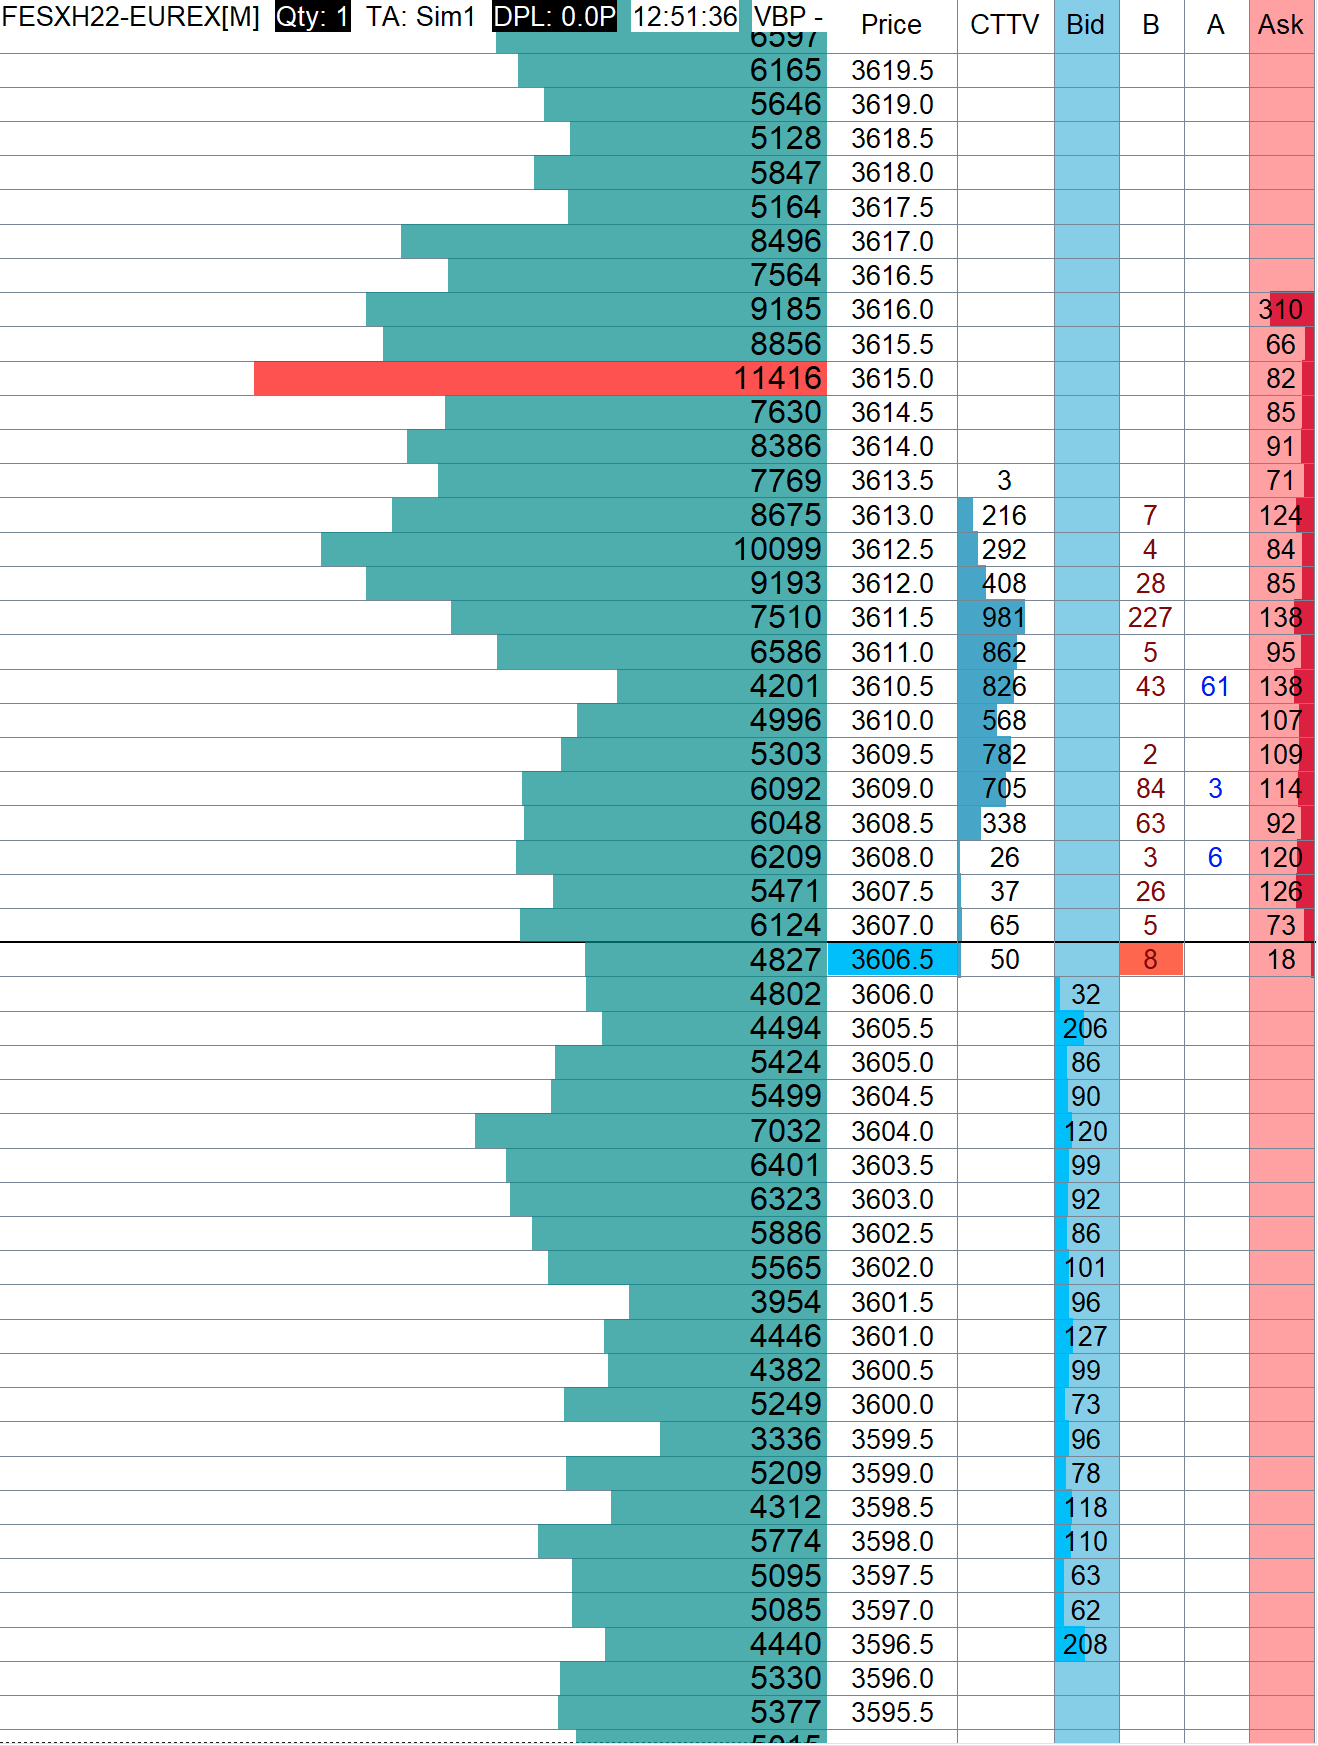
The picture above shows the Depth of Market (DOM) for Euro Stoxx 50.
As you can see, the market is currently trading at 3606.5 (price highlighted in blue), and we can see resting orders in Blue and Red columns called Bid and Ask.
You can notice that these resting orders are not horizontally next to each other but diagonally; this is called the spread.
For the market to move one tick higher, someone has to buy 18 contracts.
For the market to move one tick lower, someone has to sell 32 contracts.
If an aggressive buyer decides to lift the offer and execute those 18 contracts using the market order, he will pay the spread of one tick.
The same goes for the opposite side.
Market making
This is where market-making takes place.
Market makers make money in this spread by providing liquidity in the order books.
The goal of a market maker is always to stay delta neutral, which means they don’t want to have any directional position in the underlying asset but only manage their book by capturing this spread.
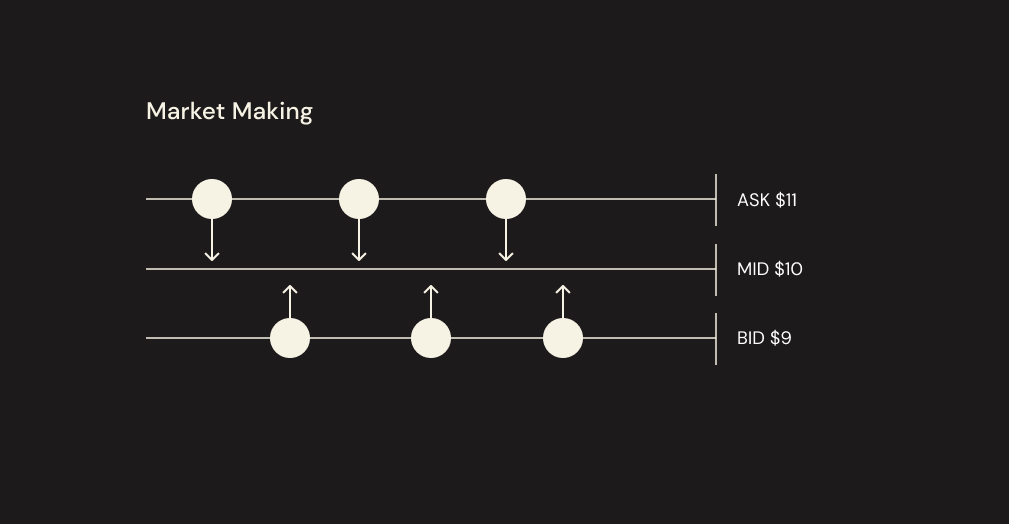
This is how market-making looks in the ideal world.
The market maker sells one contract at $11 at the offer; they generate $1 profit captured in the spread.
Once that happens, they are not delta neutral anymore as they hold an underlying position.
What they have to do then is to find a seller that will buy their quote at $9, so they generate another $1 of profit and become delta-neutral again.
Of course, markets are more dynamic, so a perfect scenario like this happens rarely, and market makers have to constantly deal with moving prices and focus on staying neutral while generating profits from the spread.
As most of the liquidity in any market is provided by market markers (as their job is literally to “make a market”) during the high impact news and uncertain events, you will see the books become much thinner as they pull their orders to avoid unexpected moves that would result in carrying too much inventory.
This is why your stop-loss during these events might not hit at prices you wanted as there is no counterpart to match your order.
Although this explanation of market-making was relatively simple, I hope you now understand the whole ideology of market makers trying to run other people’s stop-losses constantly is nonsense.
You can also learn more about market-making in this article from David Holt.
On his medium page, several of them focus on the market making in Crypto.
Order types
Besides limit and market orders, there are also stop orders, and some advanced order types, so let’s have a brief overview of them and what purpose they serve.
Limit orders
Anyone can place a limit order in the order book; because of that, they are called an advertisement or passive orderflow.
Buy limit orders are placed below the market, and sell limit orders are placed above the market.

Limits are considered a patient approach to the market and also cheaper.
This is once again important to understand because although paying a spread or higher fee might not be significant for a small retail trader, any large player in the market will rather wait than use a market order that could cost him much more.
Of course, the downside of using limit orders is that you might not get filled.
For large traders, putting one huge order limit doesn’t make sense as their intention will be immediately visible to everyone; therefore, they use already mentioned order splitting or advanced order types.
Market orders
The impatient approach of entering the market.
You don’t care about the price and want to be in (or out of the trade).
This comes in the cost of paying spread or higher fees.
If you decide to trade some thin market with too much size, you will also be in trade at a completely different price than is the current market price.
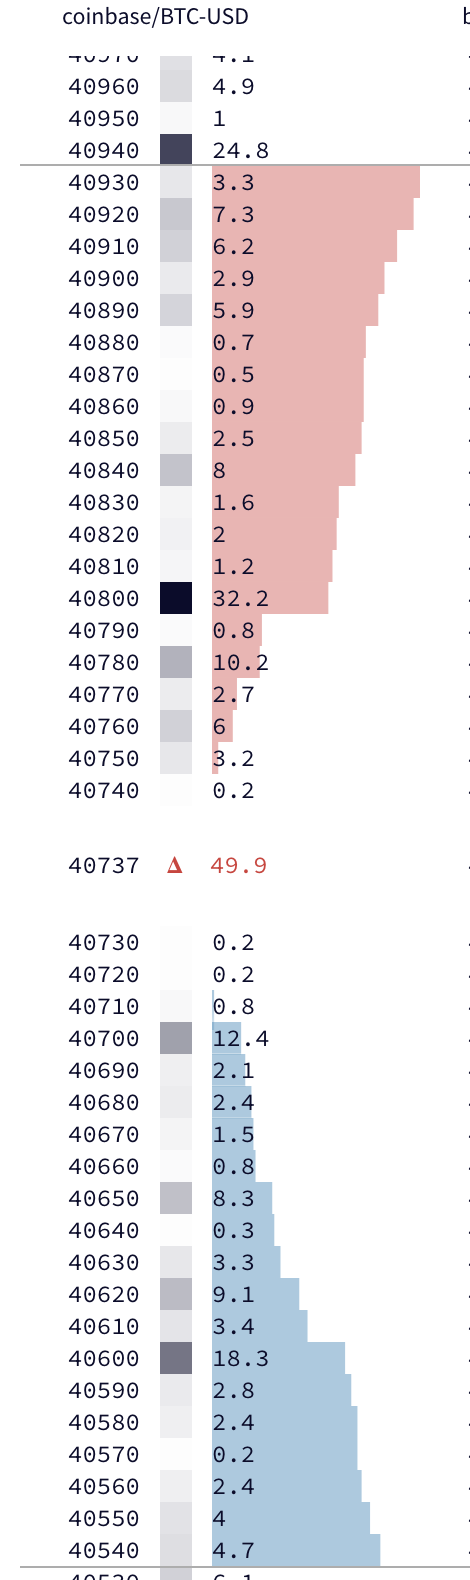
Here you can see the depth of market of Bitcoin on Coinbase.
If you buy 0.1 BTC now at 40740, nothing will change; you will get filled at a price that is the market currently trading.
But if someone executes a market order of 100 BTC, the market will spike up until all the orders above are matched.
For the buyer, this is not ideal because he is getting into the market at a much higher price.
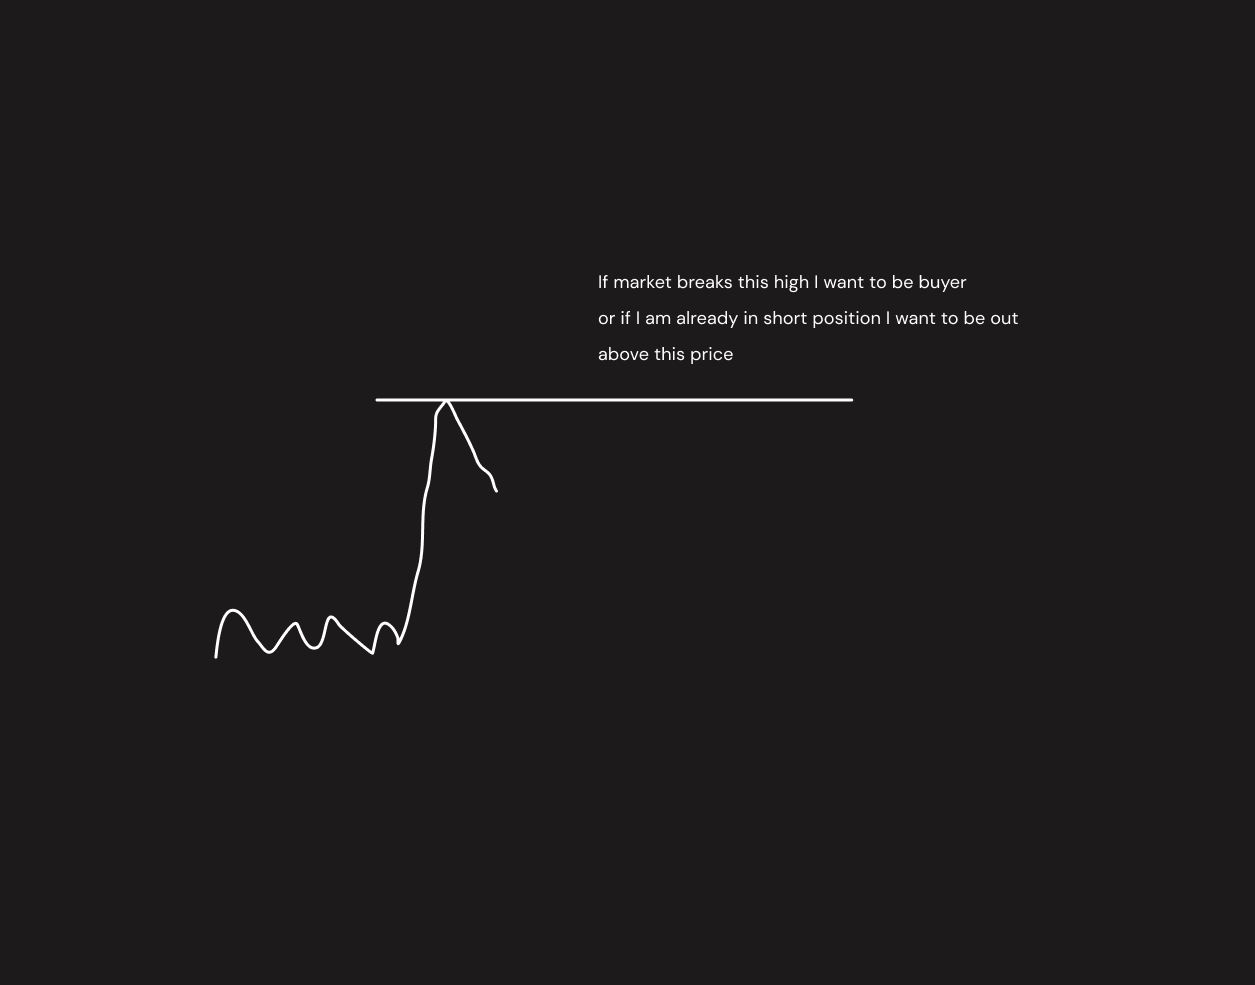
Stop orders
Stop orders are mostly market orders that are executed above the price for buying and below the price, for selling.
They are used for stop-losses, and breakout traders also use them to get into the market.
This is a perfect time to cover the infamous “stop-hunting”.
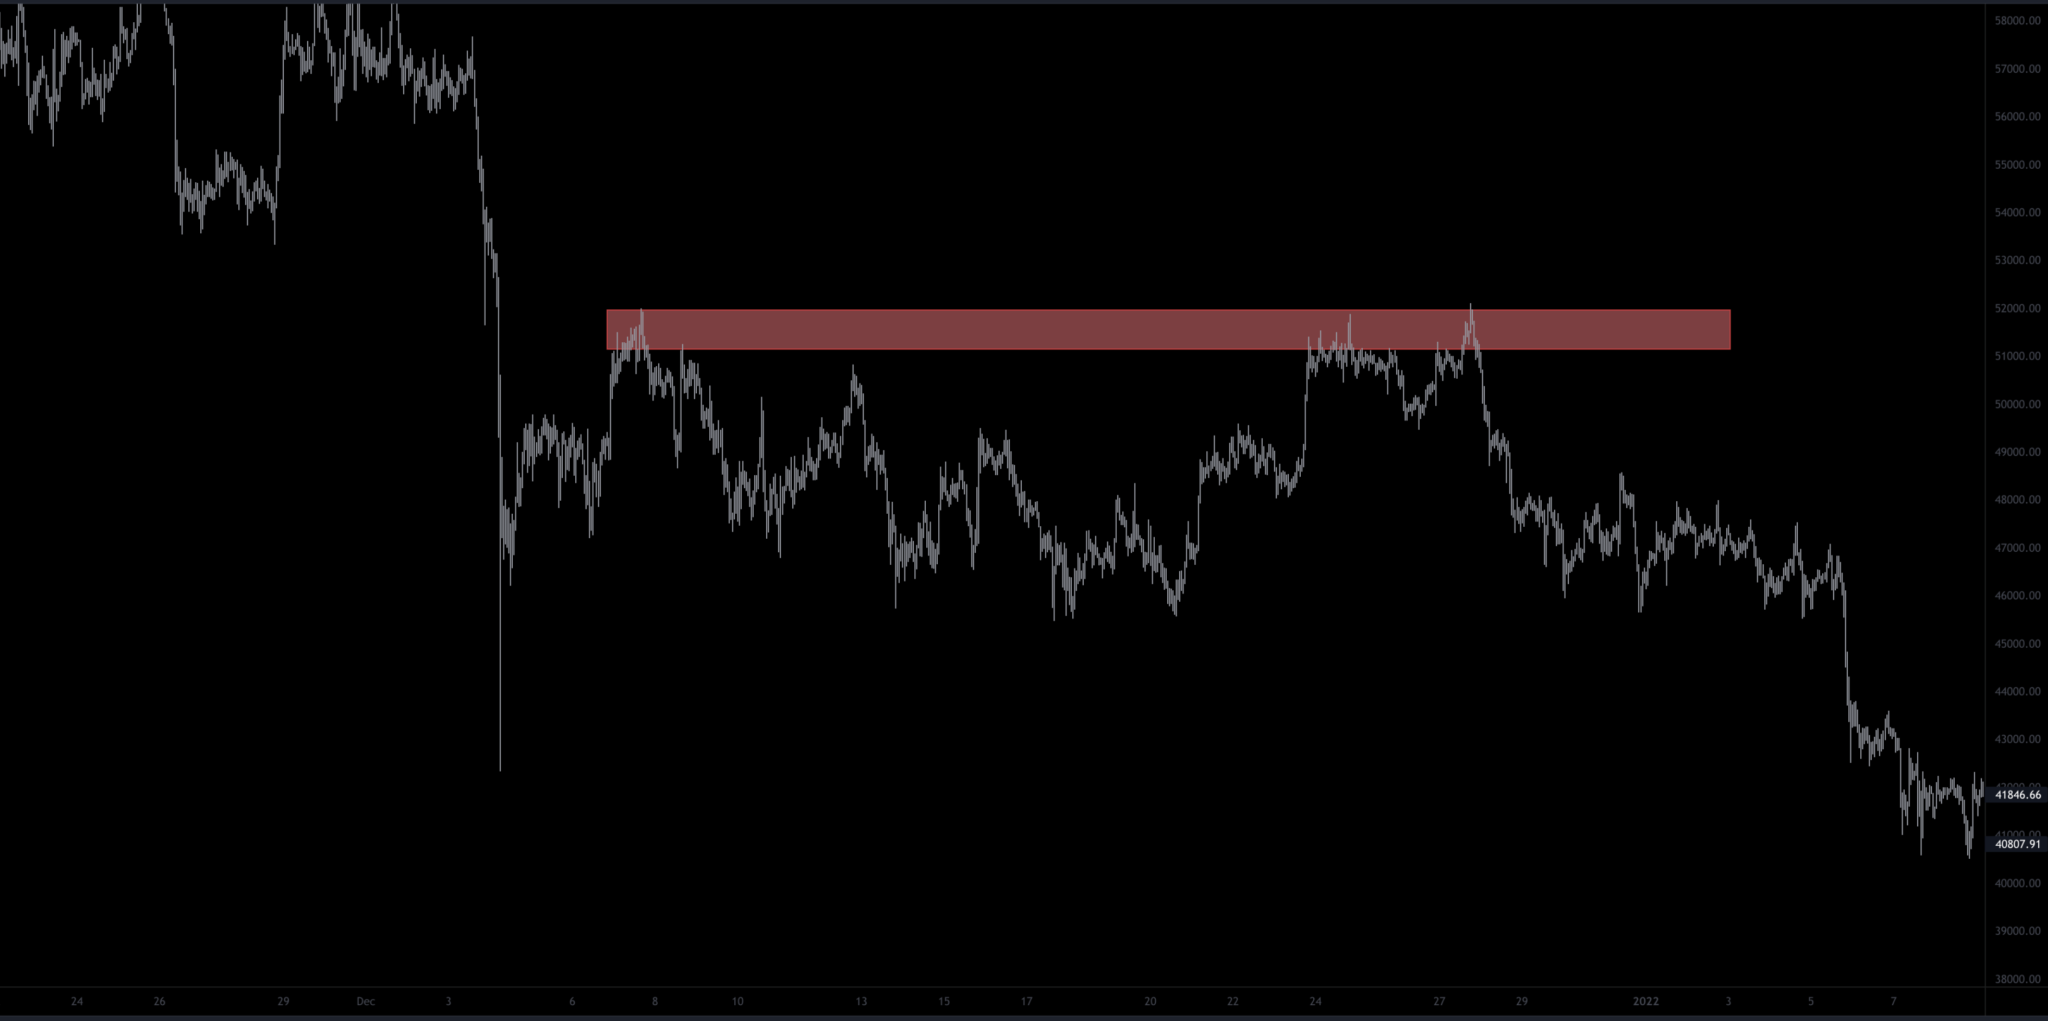
I already mentioned how herding works; traders see the exact price action charts, which increase participation on apparent levels such as higher timeframe support and resistance areas, which is highlighted with a red box.
In this area, stop orders are triggered from both traders with their stop-loss in place and breakout traders trying to bet on continuation higher; this is a perfect level for large traders having their passive sell orders filled by aggressive market buyers.
You need to understand that buy orders are not only used from breakout traders but also, if you are in a short trade and your stop-loss gets hit, you are buying back your position.
If a large trader wants to get his limit sell order filled, this makes it a perfect area as there is a lot of buying going on. Therefore, he will have an easy time filling his sell order.
If we look at more advanced tools like the Footprint chart, we can see the pickup in buying every time market reached that level of resistance.
In that case, you should always ask yourself why the market is not going higher when so much buying is going on?
That is because someone was taking the other side of those buy orders; this is called absorption as aggressive buyers got absorbed by passive sellers that are the heavier hand in the market.
As you can see, this is simply happening due to supply and demand in the market; there is no hidden hand manipulating the market or running stops all the time.
Advanced order types
Besides the classic market, limit and stop orders offered in every trading platform, some order types are not always available, but most advanced trading platforms should have them.
If you are trading Crypto, you can, for example, find them in Insilico Terminal, which is free.
Namely, these would be chase, iceberg orders or TWAP.
Chase orders are chasing the price once the market touches your desired level; this is a helpful feature as you might not get filled all the time, especially if you are trading with a larger size.
Icebergs are hidden orders triggered when the market touches them; this helps large traders hide their intentions.
Another tool that does that is TWAP; instead of buying assets at once, TWAP executes the same amount of orders over a specified amount of time.
You can easily spot a TWAP during slow price grinds up or down.
This so-called compression is usually causing a lot of traders to chase these moves and a large accumulation of stop orders below the price.
Once the market reaches the desired level of large TWAP buyers where they take profits, markets quickly flush down, running through the stops of small buyers.
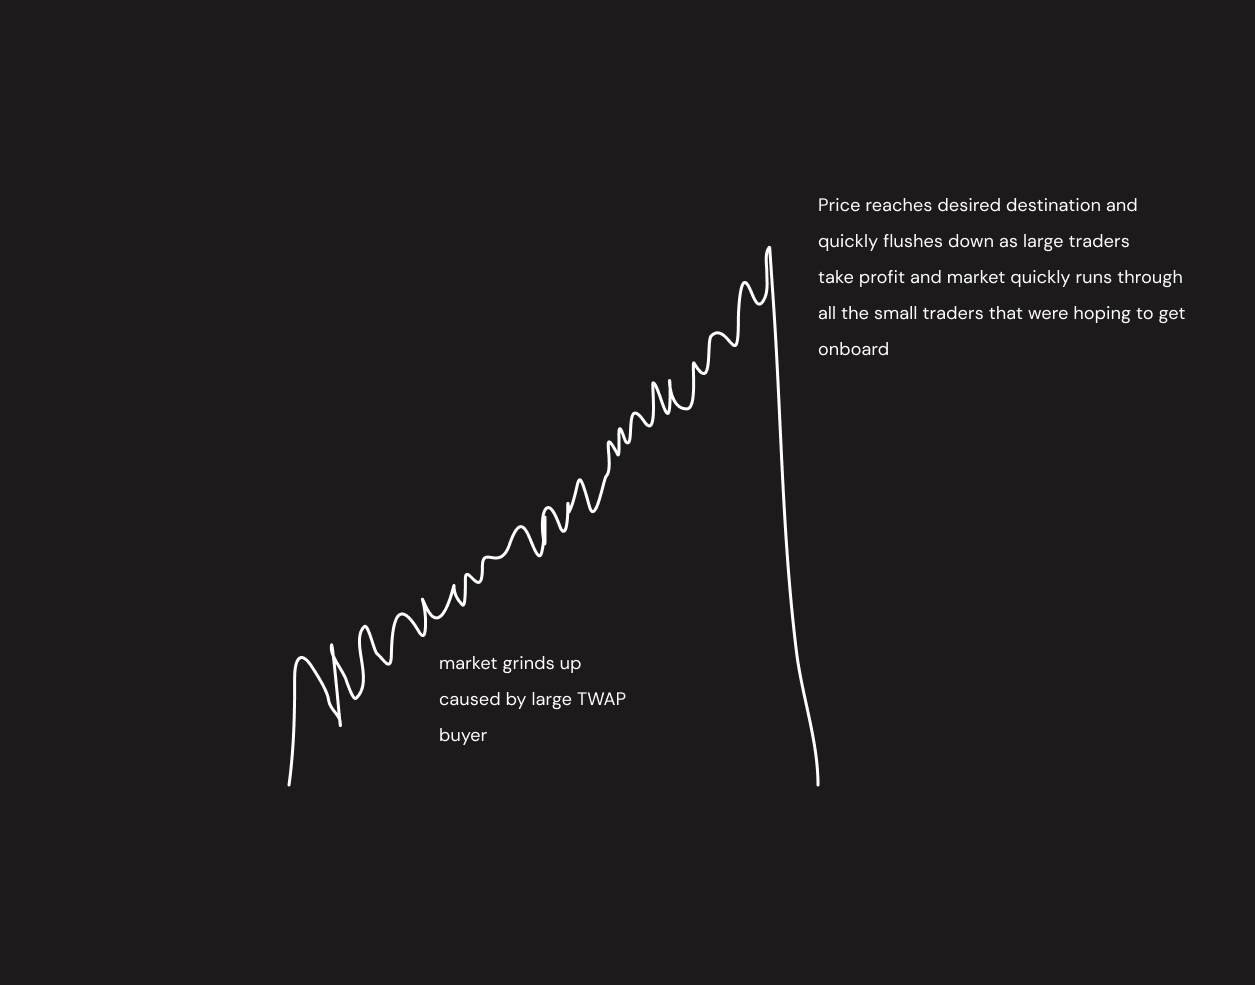
These compressions are one of my favourite patterns to trade, and I cover more about it in the Tradingriot Bootcamp.
Market participants
It is important to have an idea to understand who you trade against.
People in Crypto always mention “whales” but have no idea how these entities operate and their goals.
Market participants differ based on the market; you will have different participants in Crypto and forex.
On group remains the same, small traders that are often called speculators.
They trade directionally and try to profit on short term price fluctuations on both sides.
When these speculators become larger, they focus less on directional trading and rather implement delta-neutral strategies.
These can be cash and carry trades or trading volatility in the options market.
The investment funds, banks or commercials step into the market to diversify their portfolio or use derivatives as hedging tools.
These are specific for different markets.
In forex, you have an interbank market that consists of all large banks that determine the exchange rates based on supply and demand.
Commercials usually operate in the futures, although they can do in any other market as well. An example of this would be a company like Starbucks hedging coffee futures against the psychical coffee they own.
The last category of market participants are Algorithmic and HFT (high-frequency trading) firms.
These are interesting because of how they take a significant portion of the market now.
Especially HFT firms make a large chunk of intraday volumes across all markets.
You can simplify these categories into short-term and long-term traders.
Understanding what areas they are likely to be stepping into the market will provide you with better expectations for your trades.
Exchange types
You can trade various markets; the most popular ones are Crypto, Forex, Stocks or Futures.
These markets are then separated into centralised and decentralised exchanges.
The rule of thumb is that you want to be trading on a centralised exchange; this is different from a decentralised market like Crypto.
Centralised exchanges offer their users transparent volume and depth of market.
The most popular type of decentralised market that is traded on decentralised exchanges is Forex and CFDs, these are traded OTC (over the counter), and their users cannot see the executed volumes,
There are two types of brokers in forex, A-book and B-book brokers.
A-book brokers work with different liquidity providers that facilitate the trades for their traders. B-book brokers open positions against their clients. Not many people know that even if there is an A-book broker, they still can decide to run a B-book model and trade against their clients.
Other than that, Futures, Crypto or Stocks are traded on centralised venues with transparent volumes.
These will be trading at CME, CBOT, Eurex or Nymex in Futures.
In Crypto, you have centralised exchanges such as FTX, Binance or Bybit and decentralised exchanges like DYDEX or other on-chain brokerages; these still provide transparent volumes for their users.
And Stocks are traded at NYSE, LSE and so on.
Market Microstructure Tools
Now that you have a decent understanding of market microstructure, let’s cover some tools frequently used by traders.
These are orderflow trading tools; I will try to keep things relatively simple but read this article first if you have no idea what orderflow is.
It’s worth mentioning that all of these tools are best utilised for short-term trading; if you are only focusing on swing trading, there is some use in them as well, but it is much more nuanced.
More about using these tools in swing trading is covered in the Tradingriot Bootcamp.
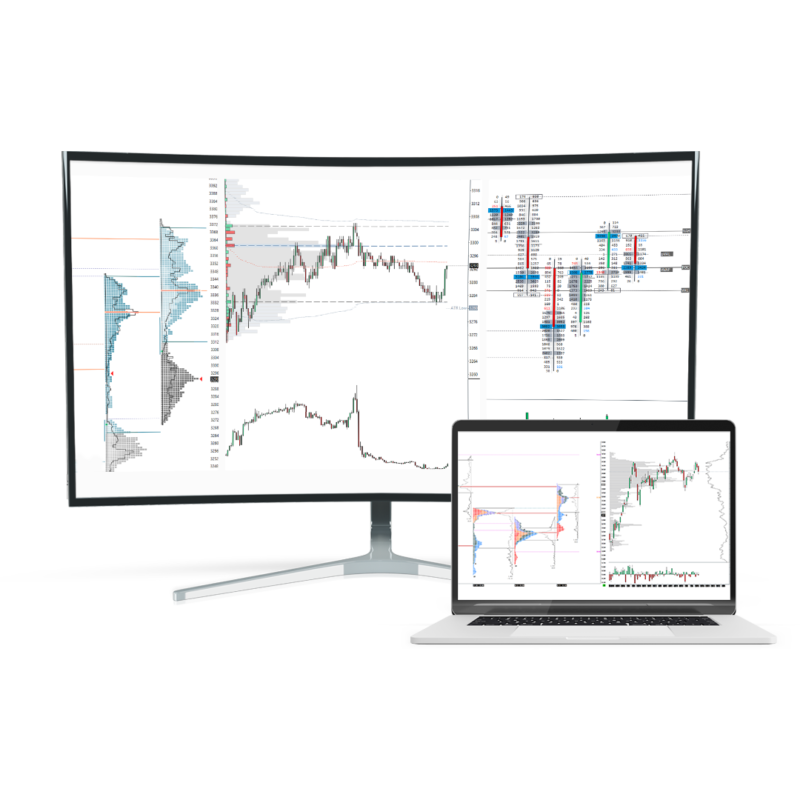
Depth of market
I already mentioned DOM in this article.
DOM stands for Depth of Market, is a tool that shows you the orders resting at each price point in its simplest form.
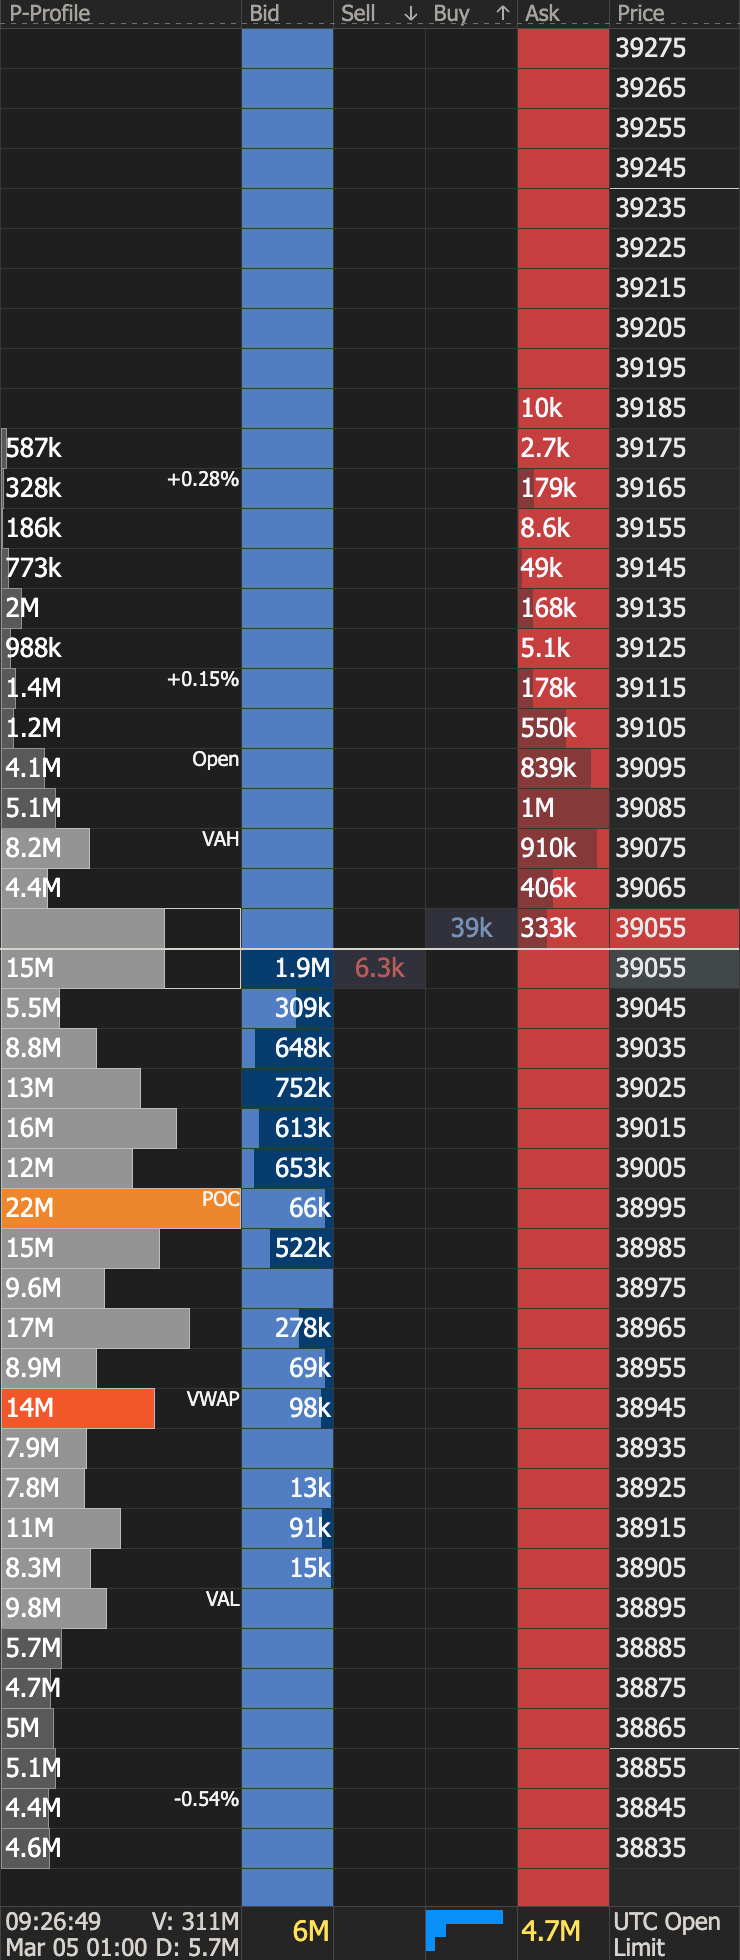
The picture above shows DOM for BTCUSD on Bybit.
In the blue column, buyers are willing to buy, and sellers are willing to sell in the red column.
As this is more of an advanced DOM, the middle columns show the orders that got executed at the market and on the left side, you also have a volume profile.
So is there any edge in actively using DOM in your trading?
There is, but it is not easy, especially in Crypto or other thin markets.
In my opinion, the best use of DOM will come in liquid markets such as bonds or some index futures.
As I already mentioned, limit orders are the advertisement in the market; anyone can add them and pull them from the order book at any time.
This often creates the illusion of supply and demand, which is not real.
Here is where the edge in DOM mostly comes in.
Skilled DOM readers can see if the orders that are near the market price are real or if they are just spoof orders.
As I said, this is generally easier in thick markets that are much more liquid and move slower.
Especially when it comes to spoofing, being able to spot these spoof orders can be a powerful trading strategy as the spoofers usually fill their orders at the other side of the spoof.
More about this can be found in an article from Atas.
If you are an intraday trader (or any trader), DOM can be a good tool for execution.
Placing orders quickly on DOM is often better than just clicking on a chart or working with other order windows.
Most advanced platforms let you place different orders with different key binds on DOM, just by a few clicks.
Using DOM is similar to technical analysis; you need to watch it long enough to see patterns and different behaviours.
What makes it complicated compared to simple TA is these patterns differ based on the market you trade.
It takes hours of chart time to start seeing those patterns, but if you dedicate your time, it can provide a significant edge in intraday trading.
Tape reading
Tape reading is considered more popular and probably an easier way to watch market microstructure.
If you remember from a DOM example, the middle column showed market orders that got traded.
This is what the Tape is showing; it shows the market orders executed.
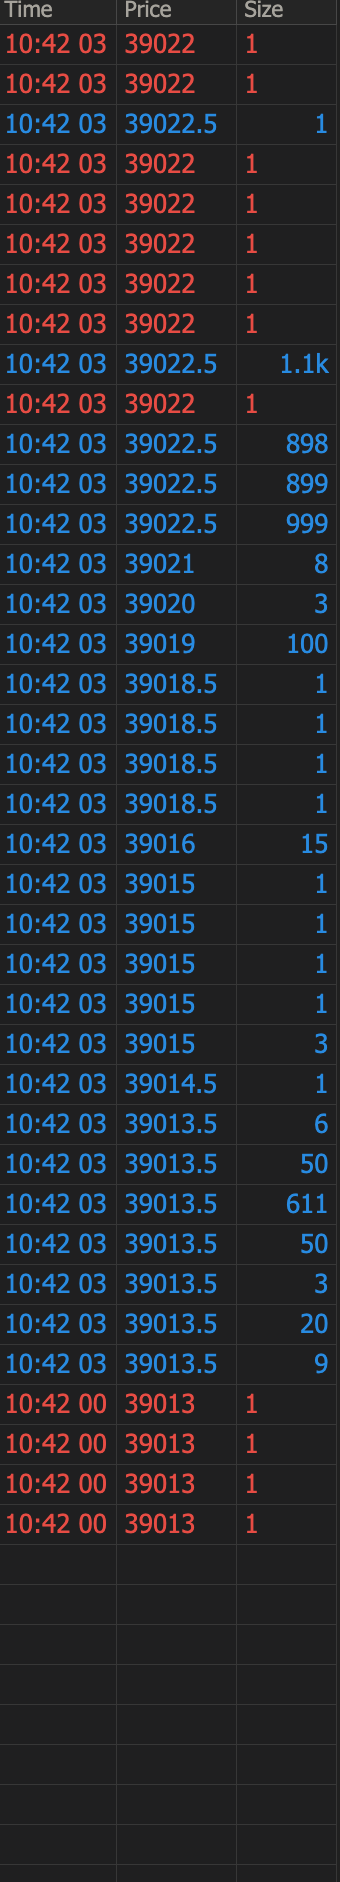
Most platforms offer an option to build reconstructed Tapes that only show sizes above or below a certain threshold.
This is a great way to see larger executed trades in any market quickly.
Overall, you will be using Tape to see what areas traders are interested in buying and selling and, most importantly, how the market responds to that effort.
Looking at Tape will give you the fastest signal of absorption happening in the market.
If you see the resistance level where many market buy orders come in, and the market is not following through with this effort, we are in the situation I covered earlier in this article.
Crypto is a fragmented market, which means several exchanges offer both spot and futures trading.
This is where tools such as Aggr comes in handy as it provides the aggregated Tape for any crypto asset of your choice.
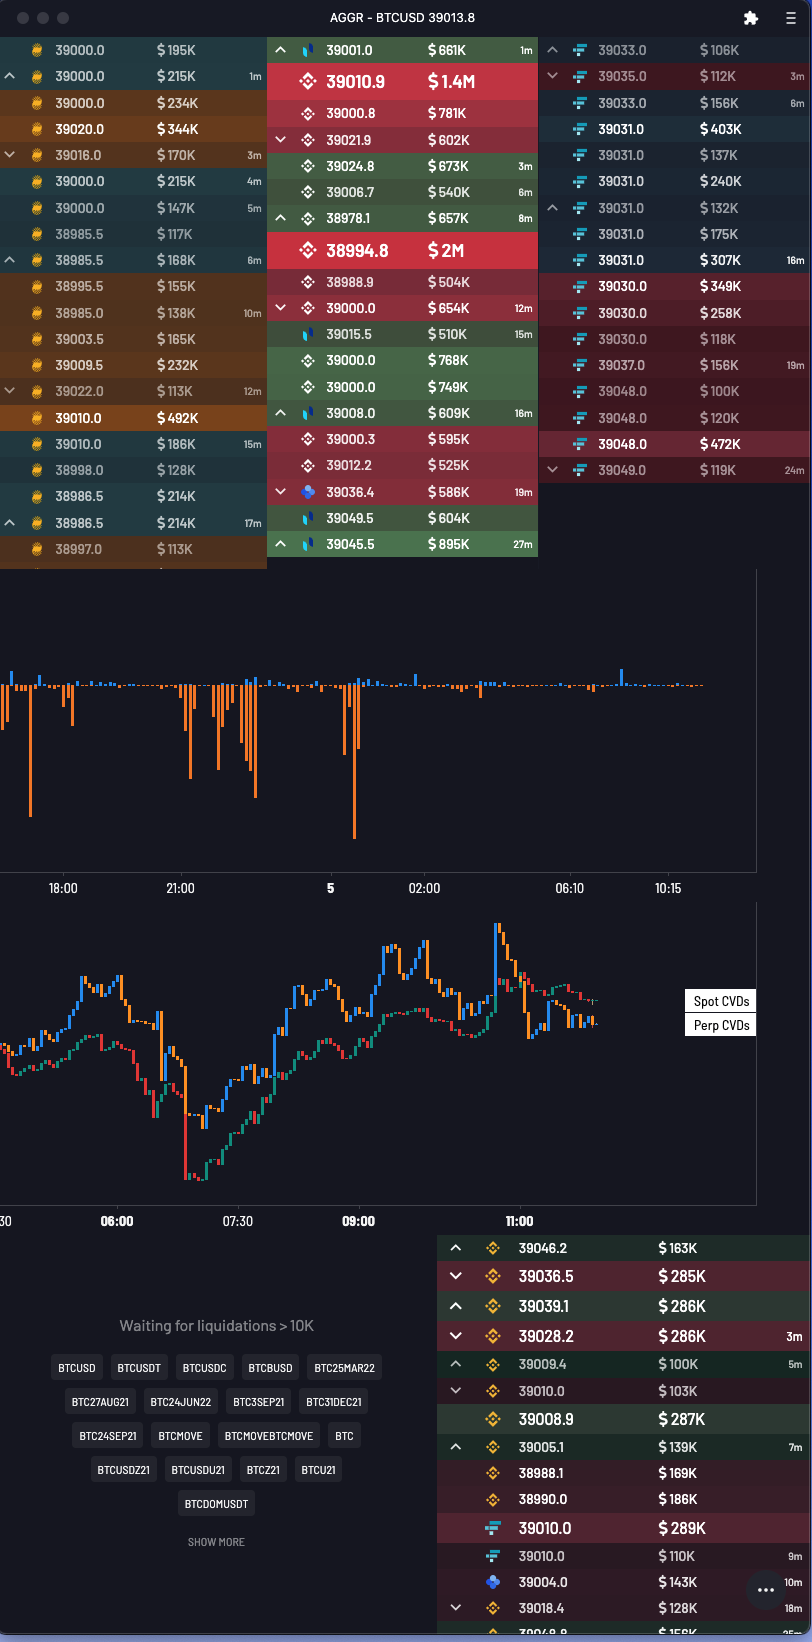
This is the Tape that I look at; as you can see, it shows Bitcoin orders that are separated based on different Exchanges.
On the top side, there are derivatives products, and at the bottom, you have spot markets.
When it comes to Crypto, the rule of thumb is usually that every healthy move should be sponsored by a bid from the spot markets and derivatives that offer high leverage usually attract gamblers.
Based on this information, you can watch how the market behaves around certain levels and who is buying and selling there.
It won’t take you long to be able to spot specific patterns.
Footprint Charts
Footprint charts got their article already, so that I won’t spend too long covering them here.
The Footprint is essentially the same as the Tape as it only shows the market orders traded at the bid and ask, but it does it in a more advanced way.
The thing is that Tape can sometimes be too fast, and it doesn’t show any history of previously traded orders.
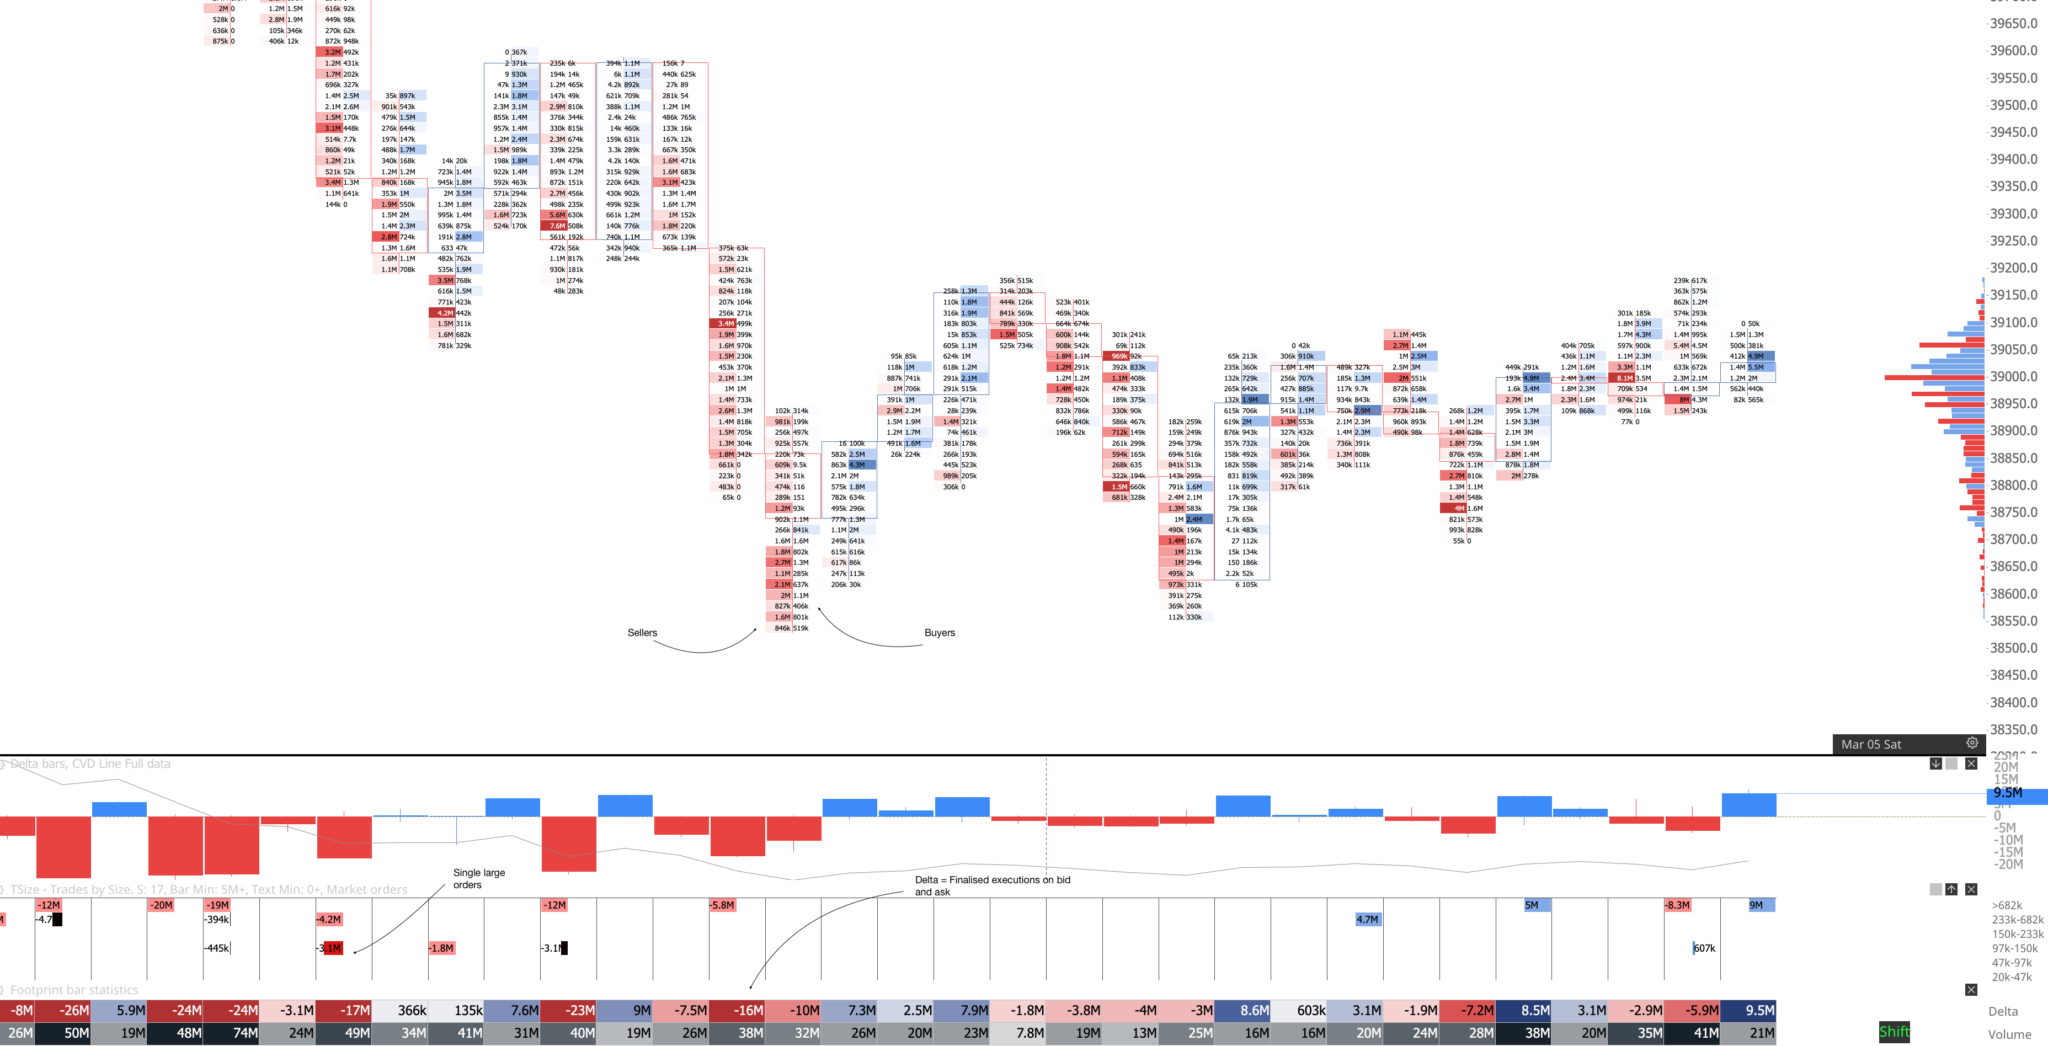
Footprint does that as it is represented in a classic candlestick chart.
The most common bid and ask Footprint shows the sells on the left side and buys on the right side; other options can be Delta footprint which will sum all the orders and plot just finalised executions on the bid and ask.
A footprint is a great tool for spotting absorption, but I covered patterns in the footprint article.
Since Footprint can be plotted on any timeframe, many traders decide to use it on daily or other higher timeframes.
That is not something I would recommend doing as the edge comes from the immediate action in the market; on any higher timeframe balance between buyers and sellers will be more so equal, but if you look into short term intraday rotations, you will be able to spot inefficiencies that might offer you short term trades.
Heatmaps
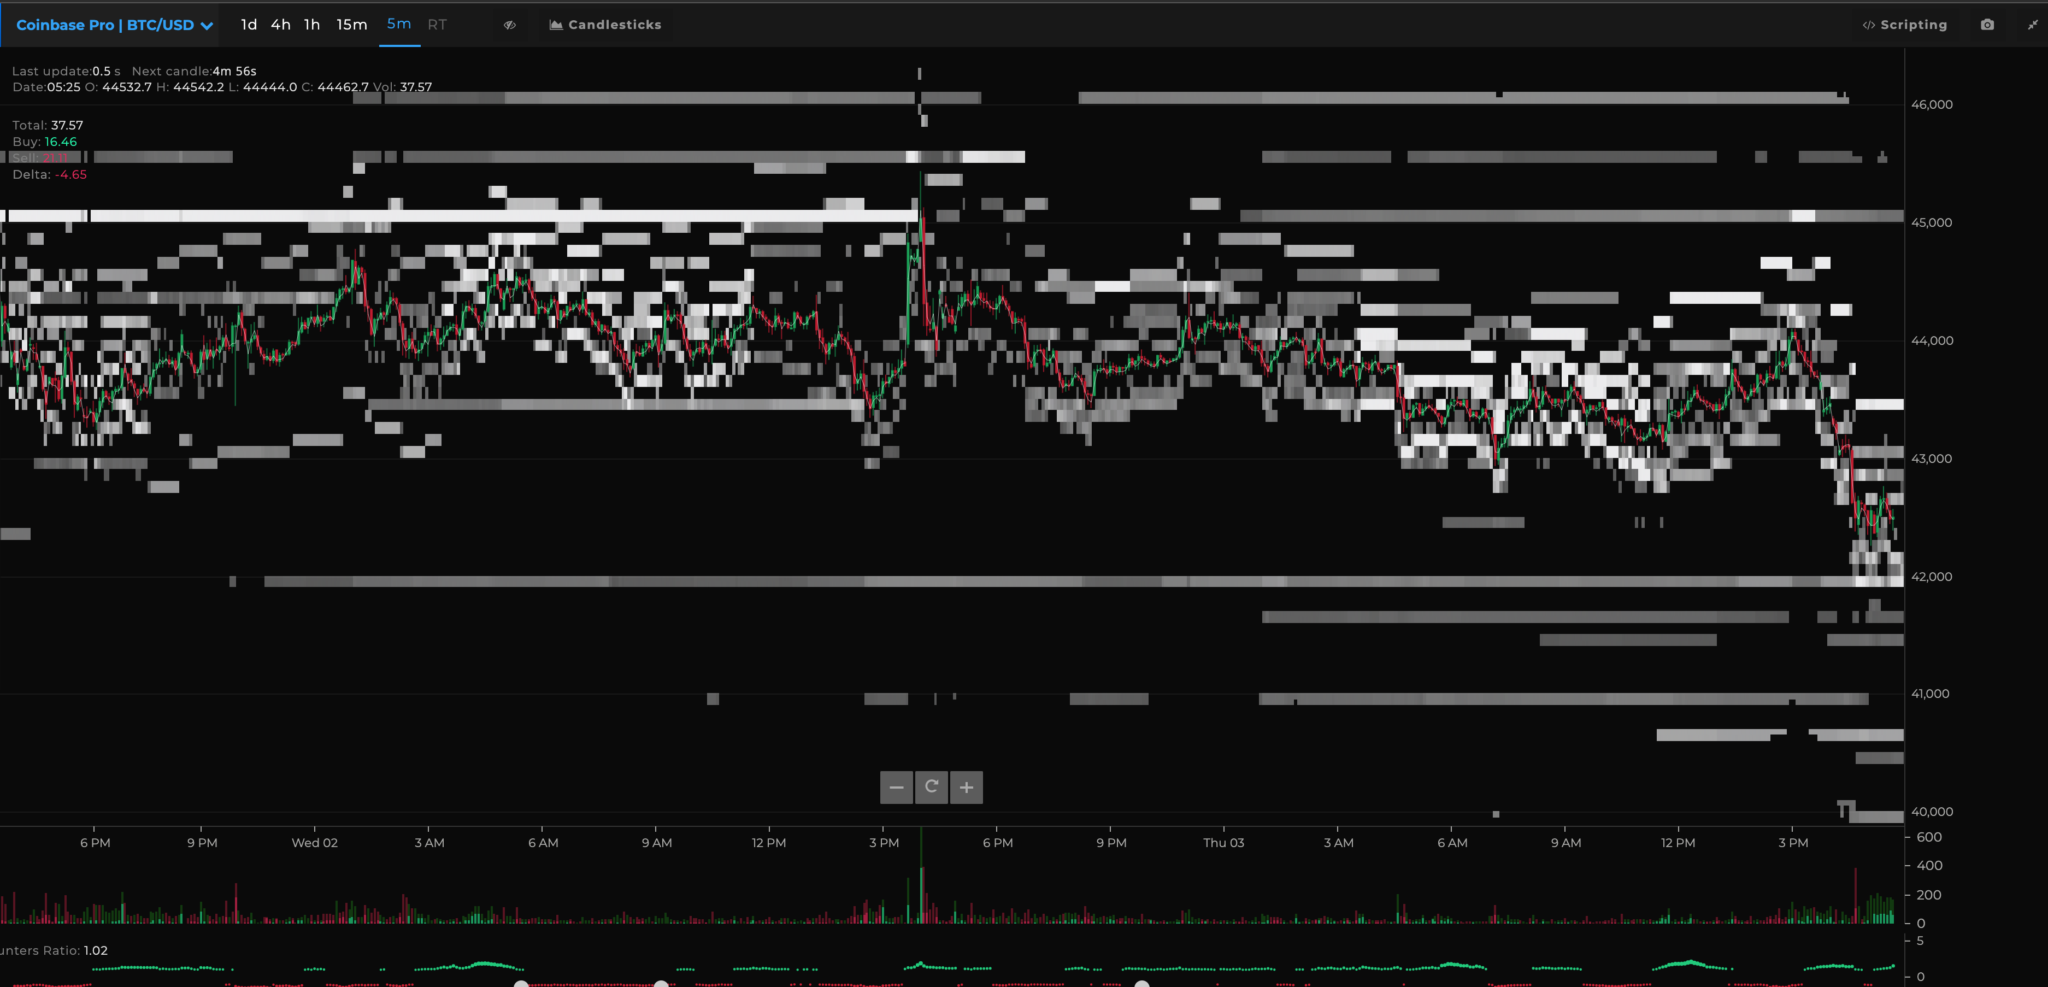
Heatmap is probably the most popular tool for monitoring the market microstructure.
Also, it is relatively useless.
These heatmap software plot the limit orders into the price chart, and many traders then use them as support and resistance areas.
Let’s go back a little bit to spoofing, and I will try to explain why this is pretty useless to look at.
Right now, Bitcoin is trading at around $40,000.
You are a large trader, and you want to buy 1000 BTC at $39,000.
If you put this a single limit order in the order book, the heatmap will display it with a bright shiny line, and everyone is now aware of your intentions.
People will see your buy order, take it as the level of support, and start buying ahead.
For you, this can be an issue that besides the fact that the market might not reach that 39k level, there are also not enough sellers to fill that 1000 BTC bid.
So what you can do instead?
You can put a sell limit order for 1000 BTC above the $41,000.
This creates a fear that Bitcoin is heading lower, and people will start panic selling ahead of this level.
What does this create? There is enough selling pressure to absorb it into your 1000 BTC buy that you can split it into smaller pieces to hide your intentions.
Once you are done accumulating a long of 1000 BTC, you simply pull the sell order at 41k, which will just disappear like it never happened.
You can see a similar situation in the example above.
Heatmaps are similar to Footprint when it comes to usage of timeframe.
When it comes to higher timeframes and these extremely obvious bids and offers in the market, you can almost always assume the ill intentions.
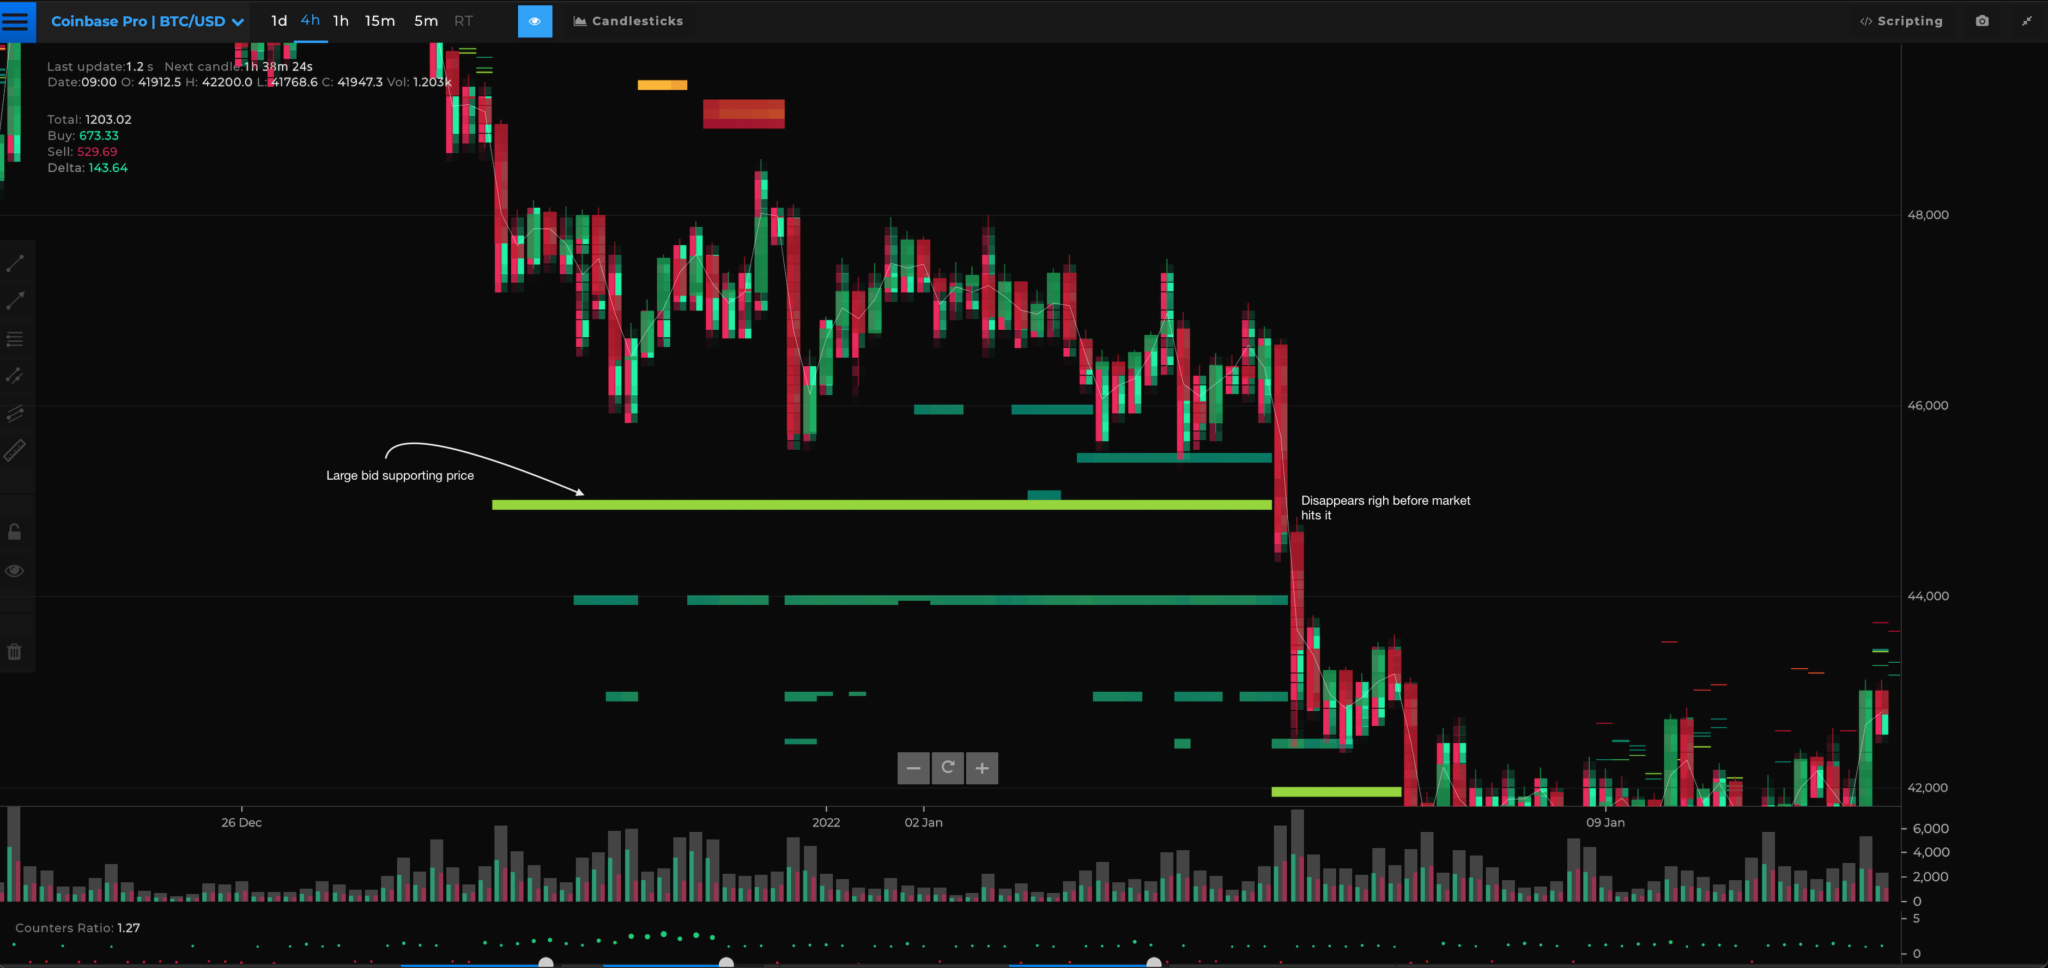
But not every order is a spoof, and from time to time, you will see genuine buyers and sellers that place large orders in the order books.
These genuine buyers and sellers will be visible on intraday timeframes more often than not.
Once again, if you buy that 1000BTC, you will slap the order to market 5-10% below the price, or wait until the market is near hitting it, so there will be not enough time for others to front-run you?
As you can see in this case, there has been a large order resting at $45,000, which by looking at pick up in volume seem to get filled, and the market indeed went lower from there.
Also, some software such as Bookmap went way beyond simple heatmaps and provided traders with indicators that show if these orders get executed, show iceberg orders if they get executed, and so on.
In my opinion, it is still not necessary to look at heatmaps as at the end of the day, it is just a visual representation of DOM, and on any advanced DOM, you will be able to see if orders get executed or to gets pulled from the order book.
Conclusion
Understanding how markets work should be essential for anyone who decides to pursue trading.
Even if you are not a lower-timeframe trader and you won’t be necessary use any of the mentioned tools in your trading, it is still essential to know how markets operate.
Every higher timeframe trend starts at the lower timeframes, and by understanding a market microstructure, you might be able to add more precision into your trading.
Irvin Sandoval
Thank you Adam as always, have a good one
funkotic
PowerPoint slide ont YT and you talking about it would be a lot more helpful than written article for my preference, would give you more exposure also