
Understanding Cryptocurrency Derivatives Data (Open Interest, Funding, Liquidations and Cumulative Volume Delta)
One of the great things about cryptocurrencies is their transparency regarding data you can access for free.
While in legacy markets, you will pay large sums of money to get any deeper insights, in crypto there are plenty of free or cheap tools that allow you to get an easy overview of what other market participants are doing.
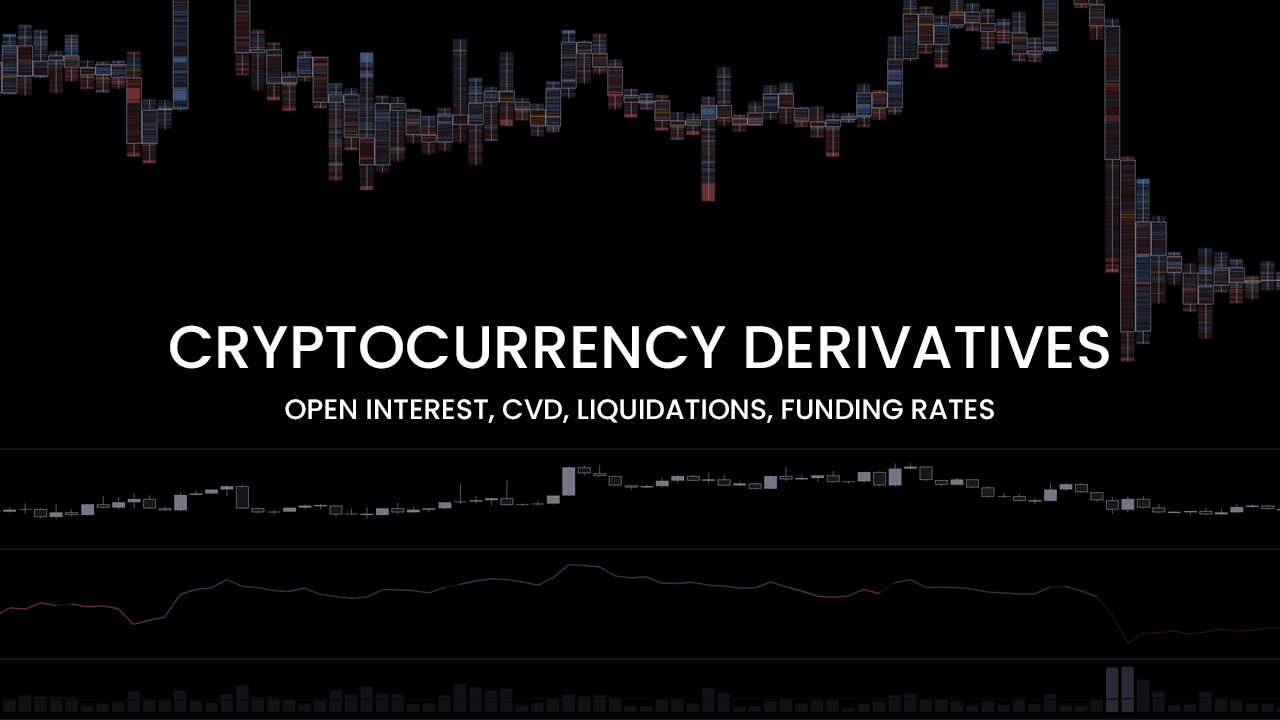
This article will look at popular indicators such as Open Interest, Funding rate, Liquidation data or Cumulative volume delta.
On top of that, I will also share tools and websites you can use to access this data.
If you like this article, read the rest of the blog or join the Tradingriot Bootcamp for a comprehensive video course, access to private discord and regular updates.
For those who are looking for a new place for trading crypto, make sure to check out Woo. If you register using this link and open your first trade, you will get a Tier 1 fee upgrade for the first 30 days, and we will split commissions 50/50, which means you will get 20% of all your commissions back for a lifetime. On top of that, you will receive a 20% discount for Tradingriot Bootcamp and 100% free access to Tradingriot Blueprint.
Table of Contents
Why should you pay attention to crypto derivatives data?
When it comes to different markets, you can trade forex, stocks, futures or crypto futures.
From all your choices, crypto markets are the most retail-driven you can find.
Buying Bitcoin, especially altcoins, is often fueled by retail FOMO and short-lived narratives.
Seeing where small and large traders execute their positions in changes of Open Interest can give you a significant edge in using these levels for your trading.
Executing into large liquidations where other traders are forced to get out or participate in squeeze based on funding rates is one of the many strategies you can use.
These can be used to build your trading system either by themselves or accompanied by popular price action concepts.
Cryptocurrency perpetual contracts
Also known as “perps” or “perpetual swaps”, are the most popular trading instrument for leverage trading in crypto.
Many people think that perpetual futures are the crypto unique concept, but this is not true, as they were introduced in 1992 to enable trading derivatives for illiquid assets.
They became popular in crypto in 2016 when Bitmex introduced them.
So what are perpetual futures?
Perpetual futures are the same as Contracts for difference (CFDs). They do not expire.
The normal futures, such as E-mini S&P500 futures, have a set expiration date of 3 months.
Gold or Crude Oil futures expire on a monthly basis.
Cryptocurrencies also have quarterly expiration contracts, but they definitely do not reach the popularity and liquidity of perpetual futures as they are mostly used in delta-neutral trading by larger players or to have a longer-term leveraged positions thanks to the fact they are not exposed to funding rates.
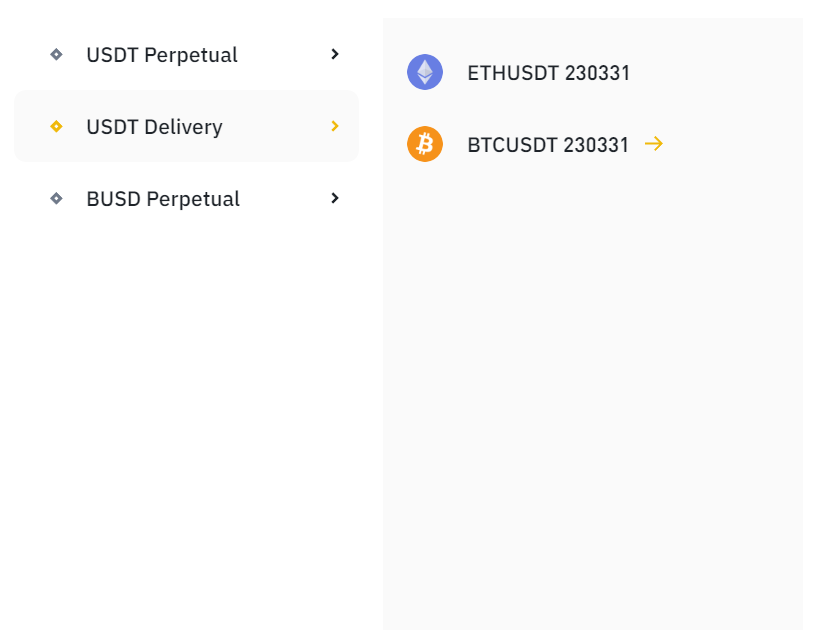
Perpetual futures are much more popular and fall into two categories, linear and inverse futures.
Inverse futures
Inverse futures are settled in the coin you are trading, but they are quoted in the quote currency.
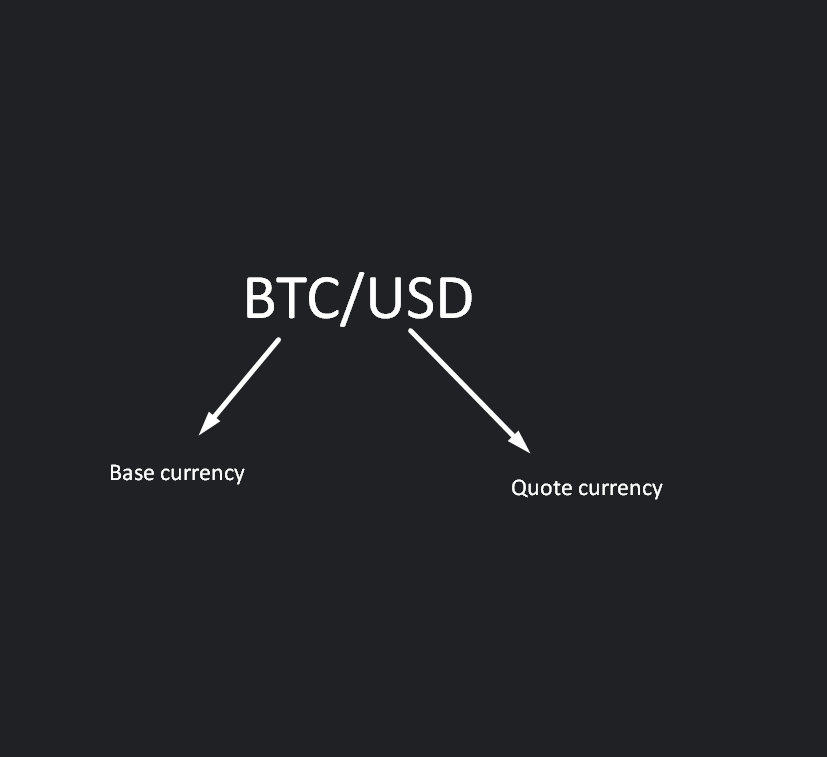
For any inverse futures contract you will trade, the first will be your base currency and the second the quote currency.
So, for example, trading an inverse contract of LINK/USD means that the chart itself is quoted in US dollars, but you will use Link as your collateral.

Trading inverse contracts can be tricky since you have constant exposure to the underlying coin, but if you are, for example, bullish on a long-term and want to grow your coin holding, the inverse contract can be great for it.
Also, if you think the underlying coin will go down, you can open x1 short position to hedge your holdings.
If you, for example, go 1x short on an inverse BTCUSD contract at $20,000 with 1BTC in your account and the price falls to $19,000, you made $1,000 on your short trade even though you technically lost $1,000 value from your BTC holding.
Inverse contracts used to be much more popular during the Bitmex and early Bybit days, but with the rise of the popularity of FTX and Binance in 2020, most of the volume moved into Linear contracts.
Linear futures
Linear futures is where the most volume happens. They are very straightforward, making them the most popular instrument to trade.
They are both settled and quoted in quote currency, and exchanges use stablecoins, with Tether being the most popular as their quote currencies.

So if you have $100,000 USDT in your account, you will open 1x long on BTCUSDT at $20,000.
You will provide a $20,000 margin; any profit or losses will reflect your USDT holdings.
If you close your position at $21,000 for BTC, you make 1000 USDT; if you close your position at $19,000, you lose 1000 USDT.
Bare in mind that volume and open interest for any linear contract will be denominated in coins, as you are going long or short a certain amount of coins, but most exchanges will convert this to USDT.
Besides linear and inverse, there are also Quanto contracts, but they are quite confusing, and no one really trades them, so we will just act like they don’t exists.
Open Interest
Open interest measures the number of outstanding contracts that exist for a given market. In other words, the positions people still have open that have not yet been closed.
The calculation for open interest is as follows:
Open Interest = (Net Open Long Positions + Net Open Short Positions)/ 2
People often say that there are “more buyers” or “more sellers” in a given market, but this is not true.
When it comes to open interest, you need to understand that for every buyer, there has to be a seller and vice versa.
To understand this, let’s say that we have three traders that meet in a new market with 0 open interest and is priced at $100.
Trader A thinks this market will rise, and Trader B thinks this market will fall.
Trader A places a limit buy order at $100 to buy, and Trader B decides to match the bid and open the short position.
Open interest for this market now changes to 1 as there is currently one long and one short position opened simultaneously.
The market rises to $150, and Trader C decides to get long as well.
At $150, Trader A decides that $50 profit is enough for him and places a sell order for his one contract. Trader C matches this order and is now a long one contract.
Did the open interest change? No.
We had one long exiting (remember you go short when you sell the opened position) and one long entering.
The market rises more, and at $200, Trader B decided he had enough and wants out.
Trader B placed a limit buy order at $200, and Trader C decided to match him to realize a $50 profit.
In this case, both trader B and Trader C exited their position, and because of that, Open interest decreased back to 0.
In this case, you can see that we can have three possible outcomes regarding Open Interest.
- If both the buy and sell sides increase, the open interest rises.
- If both the buy and sell sides are closing their positions, open interest will decline.
- If one side opens a new position while the other side is closing their position, open interest remains flat.
So why do underlying asset prices change when every buyer has to be a seller (and vice versa?)
One of the reasons you can trade most markets very easily is that there are always market participants that are delta neutral.
These are called market makers.
No, they are not some evil entity manipulating prices. They make markets by providing liquidity.
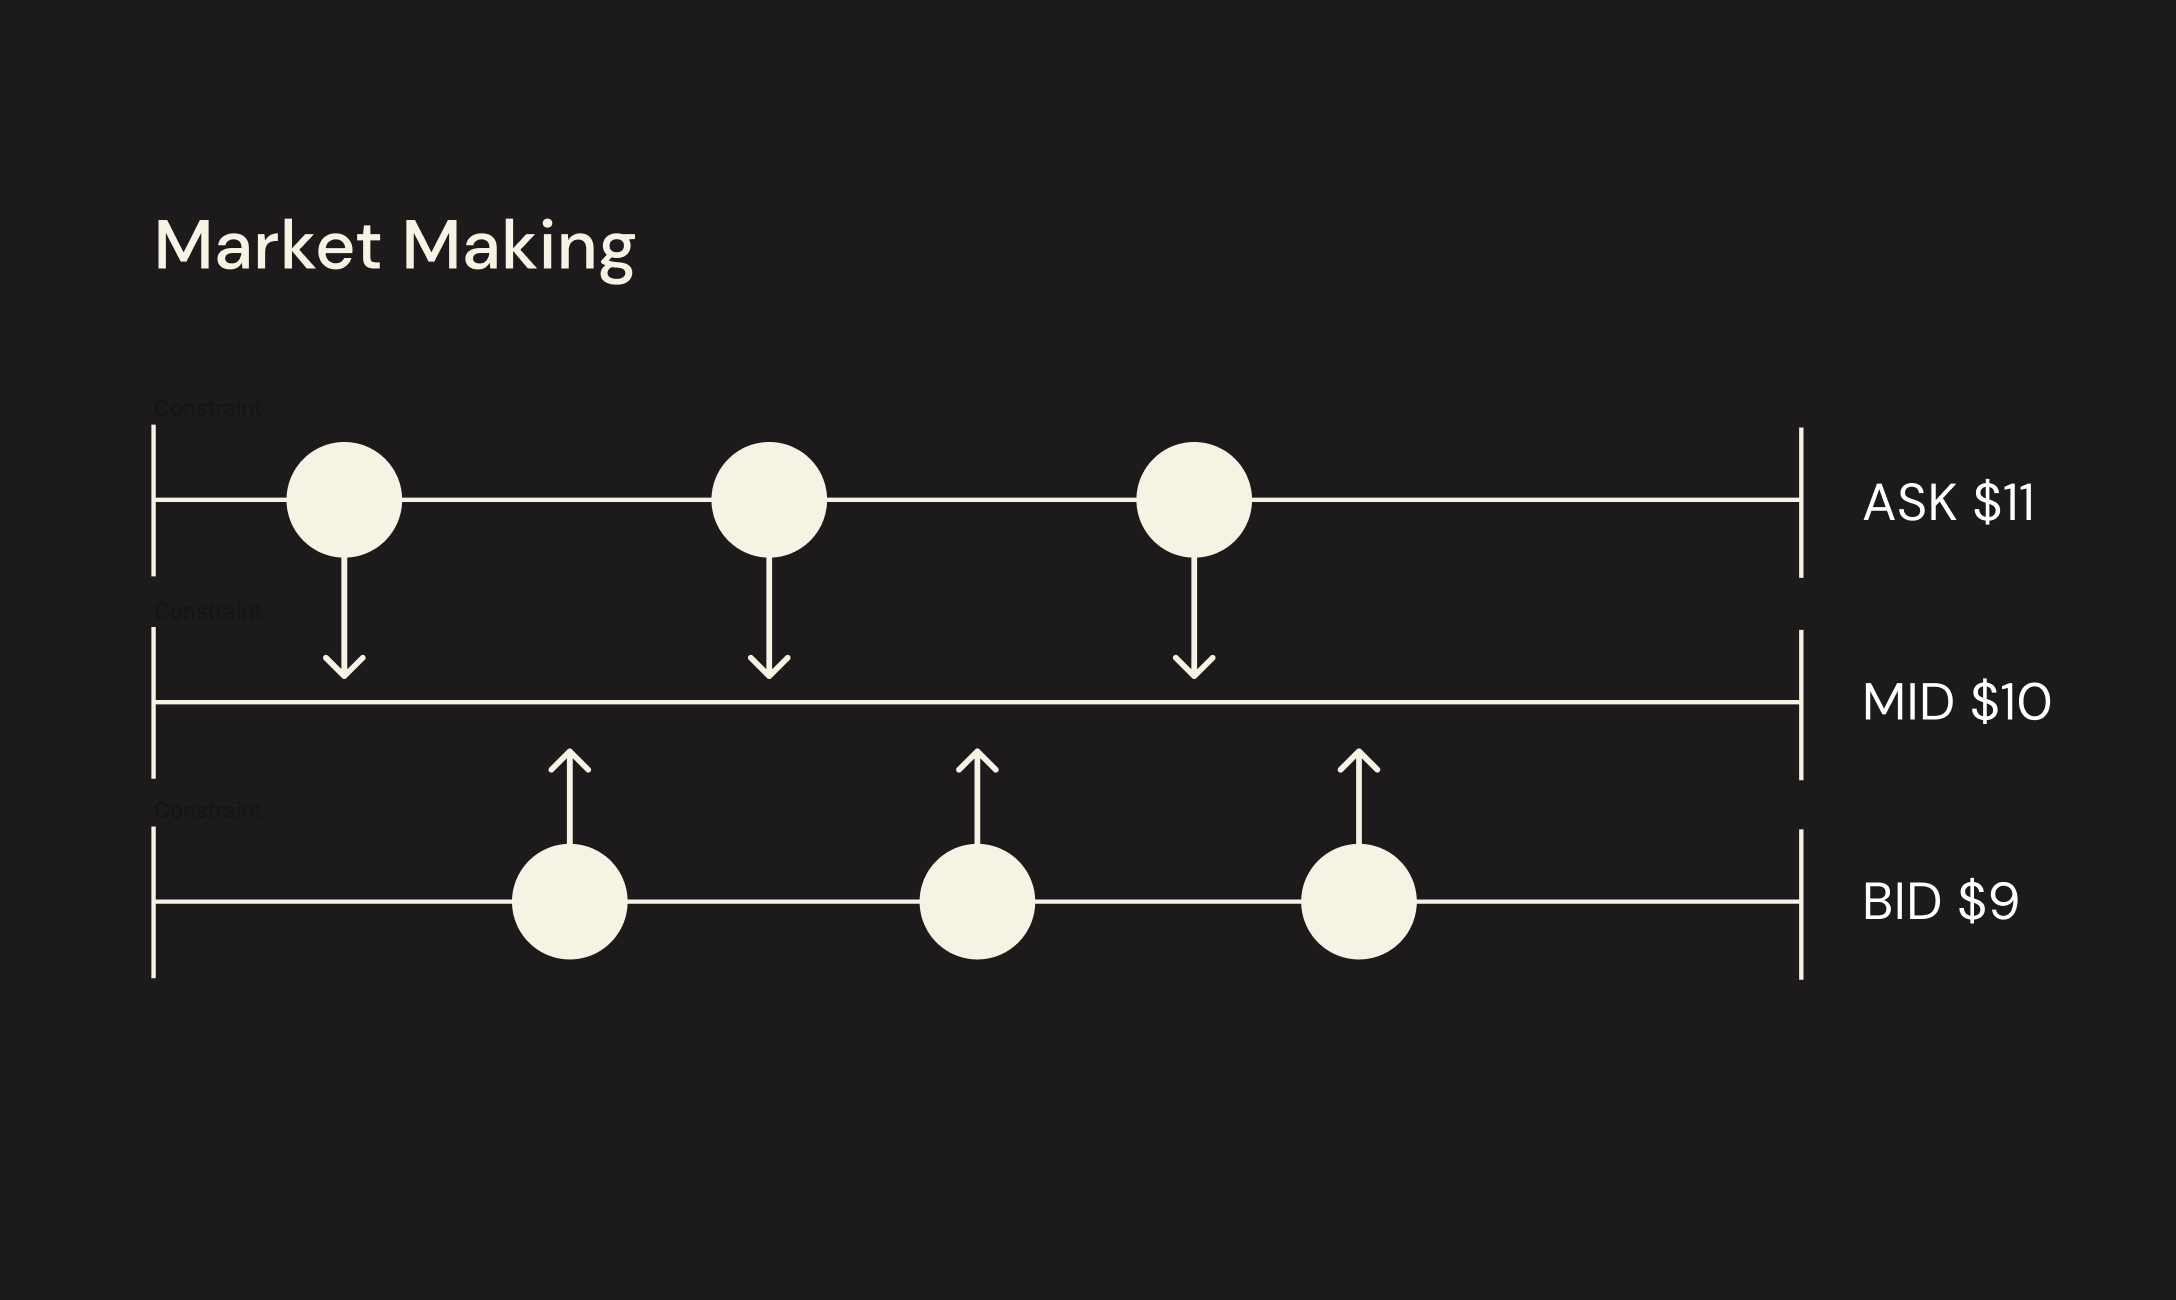
Every market you trade will have a spread. BTC has a $0.5 spread, for example, and market makers will make money by collecting this spread from aggressive traders that are crossing bid and ask.
The image above shows the ideal scenario for market makers. They quote both bid and offer and collect spread.
The image above also represents the perfect scenario which is not often the case as markets constantly react to new information.
When this happens, and traders want to get exposure to the downside, for example, prices will fall with Open interest increasing, which means that market makers (and other delta-neutral traders) have inventory that they need to unload because they want to stay neutral.
If traders want to be short on falling prices, they directional short position into the delta-neutral long position, meaning the market is directionally short.
This is how open interest will look in real market conditions.
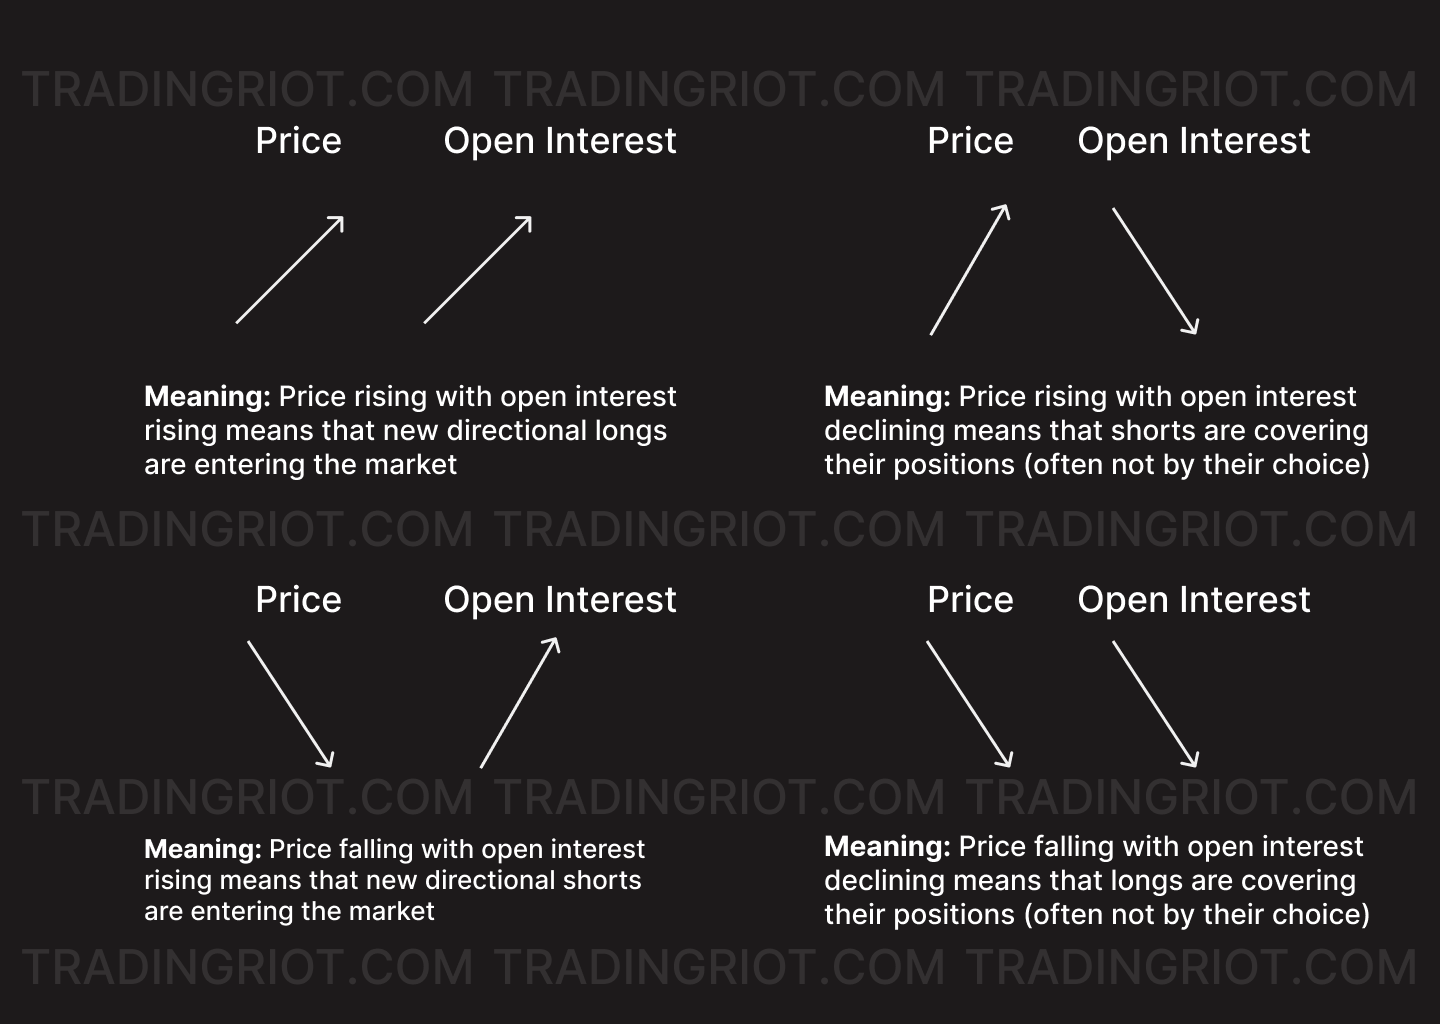
When prices are going up/down with increasing open interest, it means there is new demand/supply entering the market.
If markets are going up/down with decreasing open interest, it means the traders are closing their positions.
Especially in crypto, you will see explosive moves with a large decrease in open interest, these are known as liquidation cascades, and we will cover them later on.
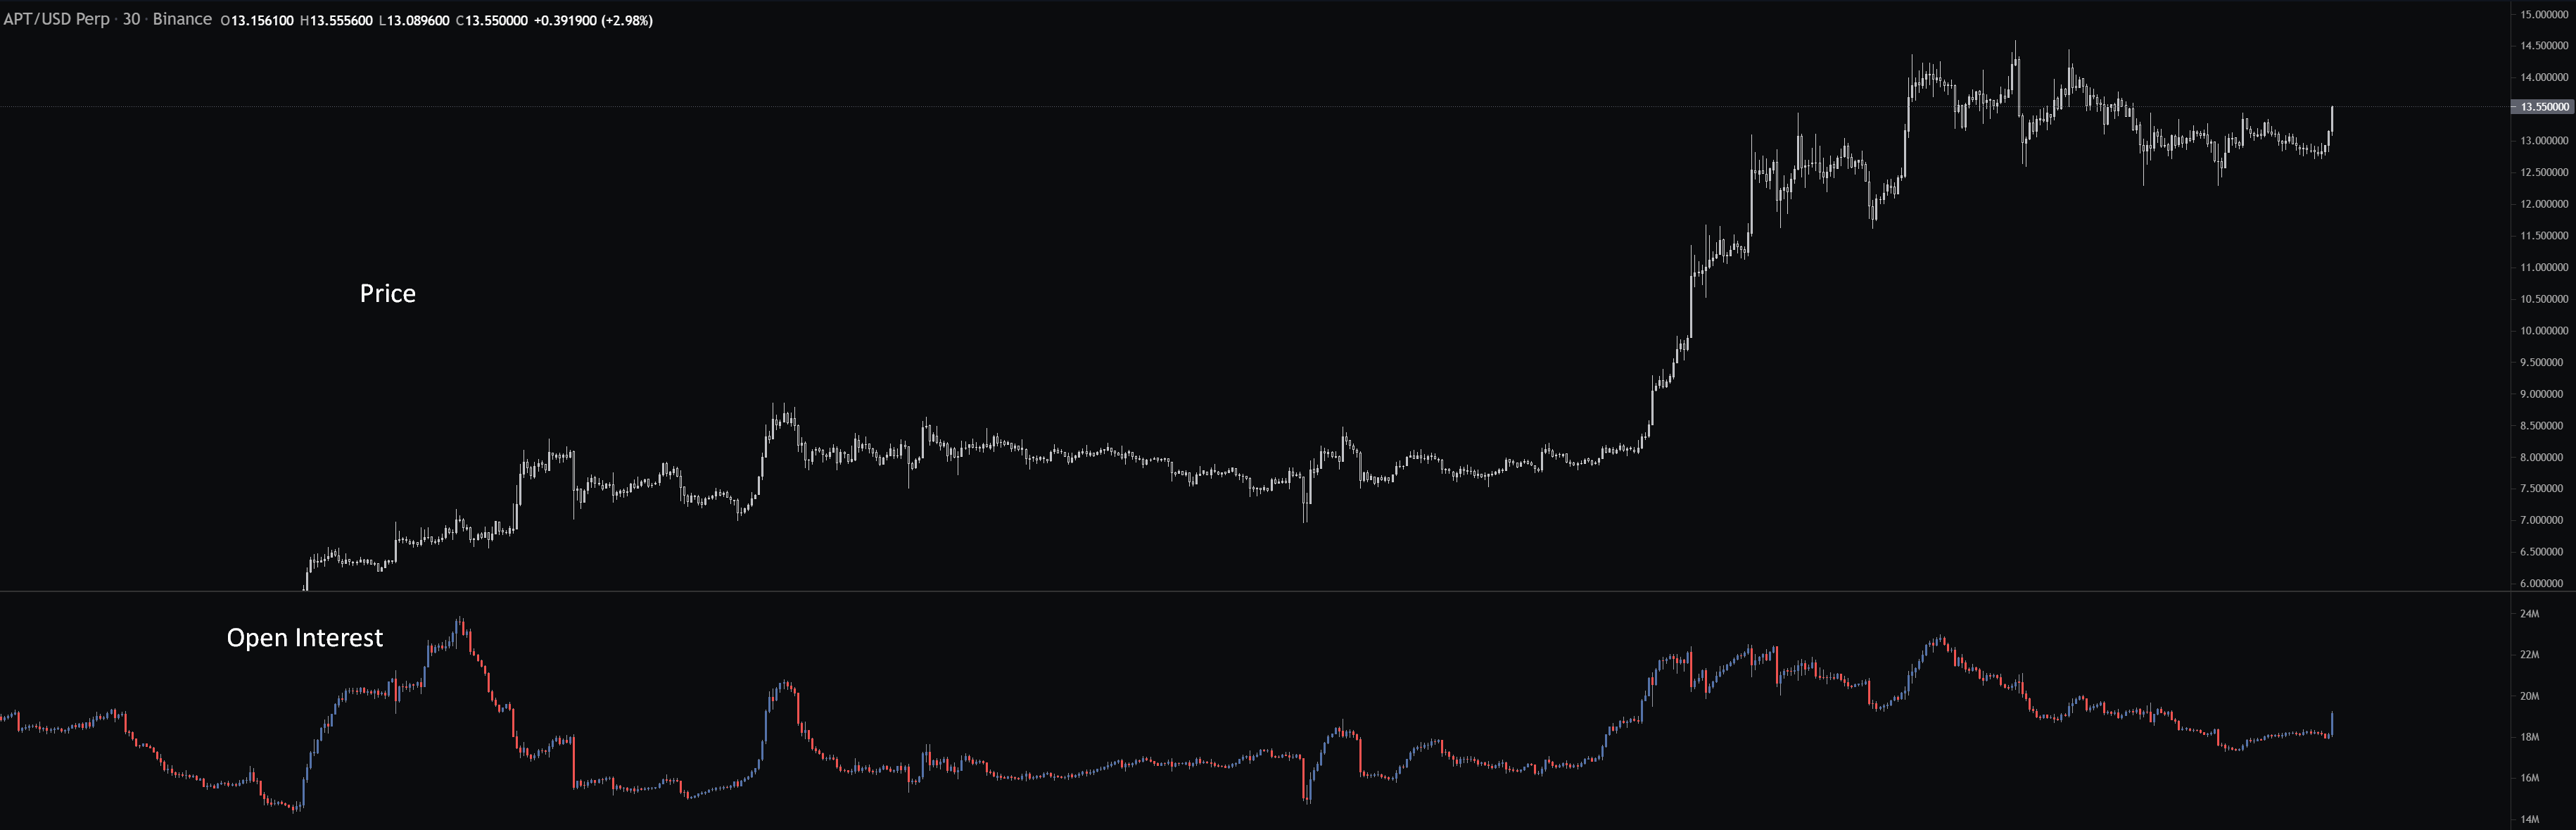
You can have a look at this APT chart during the uptrend that the market was constantly rising on new demand (directional longs) stepping in.
When we had a large decrease in OI on the left side of the chart, you can notice that price barely moved compared to the decrease in OI.
It is because someone was willing to provide liquidity at the bottom of the range and absorb the covering.
The areas of large OI changes will often act as pivots for price.
The sharp declines in OI from the chart above are coming from liquidations.
As with other indicators, it is worth watching for anomalies.
Using common sense when you see a large decrease or increase in Open Interest and looking at how the price behaves based on that.
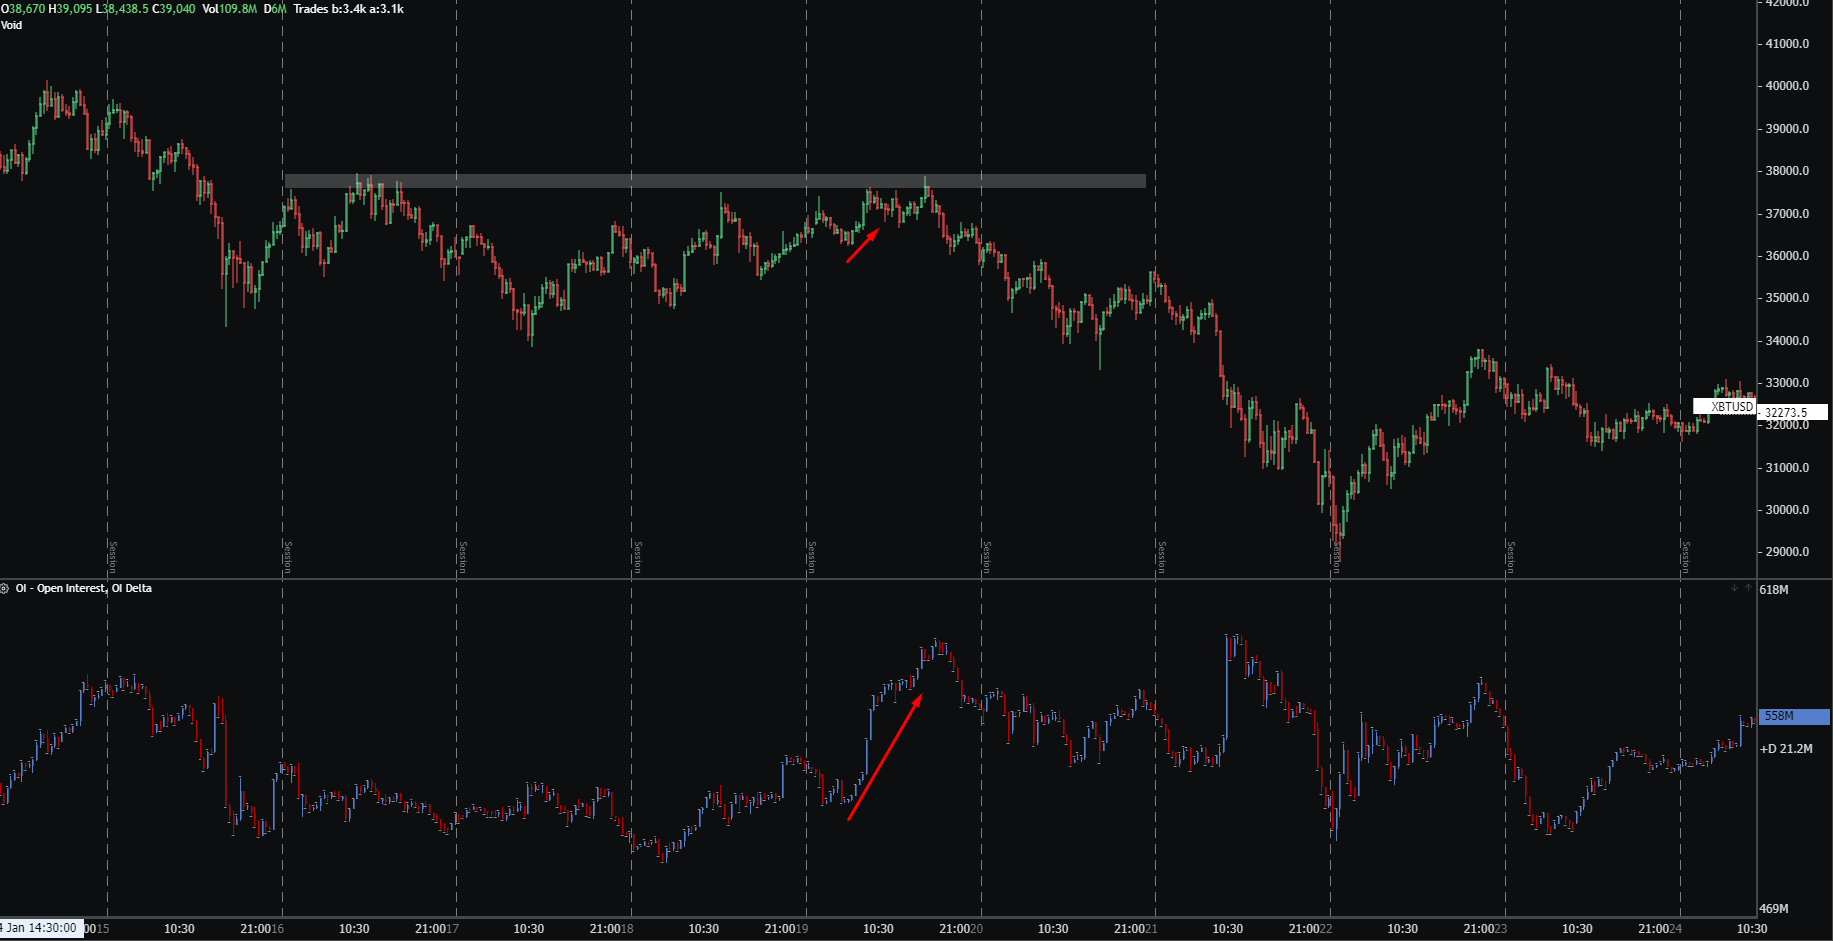
As you can see here, a large rise in open interest as the price barely moves up tells us that we had many directional longs stepping in. If that’s the case, we should be trading much higher.
This is because someone on the opposite side was filling the passive sells into rising prices. This could happen on the same exchange or spot market.
Liquidations
Perpetual swaps are traded on leverage.
If you want to long one Bitcoin futures contract currently priced at $20,000, you do not need $20,000 in your account.
The exchange will provide you with leverage of your choice that, for most exchanges, ranges from 1-100x.
Let’s say that you have only $2,000 in your account, so if you want to long 1BTC, you will need to use 10x leverage. The exchange will provide the rest.
The $2,000 margin will be used to open 1BTC long position.
If Bitcoin falls to $18,200, you are down $1,800, and because exchanges don’t want to lose their own money, you will receive a margin call.
A margin call means that the exchange will tell you to deposit more money to the exchange; otherwise, they will close your position for you if it reaches the $2,000 loss.
You will get liquidated if you don’t deposit anything and BTC falls to $18,000.
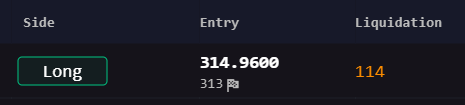
As you can see from this position, the market is currently trading at $314, and we have a long position open.
Based on the leverage used and the overall balance in the account, the platform calculated that at $114 whole account gets liquidated.
In crypto, we have a lot of retail traders trying to make it quick and using large leverage to increase their position sizes.
Bare in mind that, for example, if I used 10x leverage, the market had to move 10% against us to get liquidated; if you use 100x leverage, you will get liquidated on 1% price movement, which, as we all know is nothing unusual in crypto.

As you can see from this example, the market has been slowly rising, with open interest rising as well.
On the flush down happened, we had a large decrease in the open interest all of a sudden.
This happened because people were not only going long, but they were going long mostly on high leverage, which means even a small price decrease would cause their liquidation.
The platform automatically executes a market order to take you out of the position when you get liquidated.
If many liquidations happen at once, it can cause a large move as the number of liquidations exceeds the current liquidity of the given market.
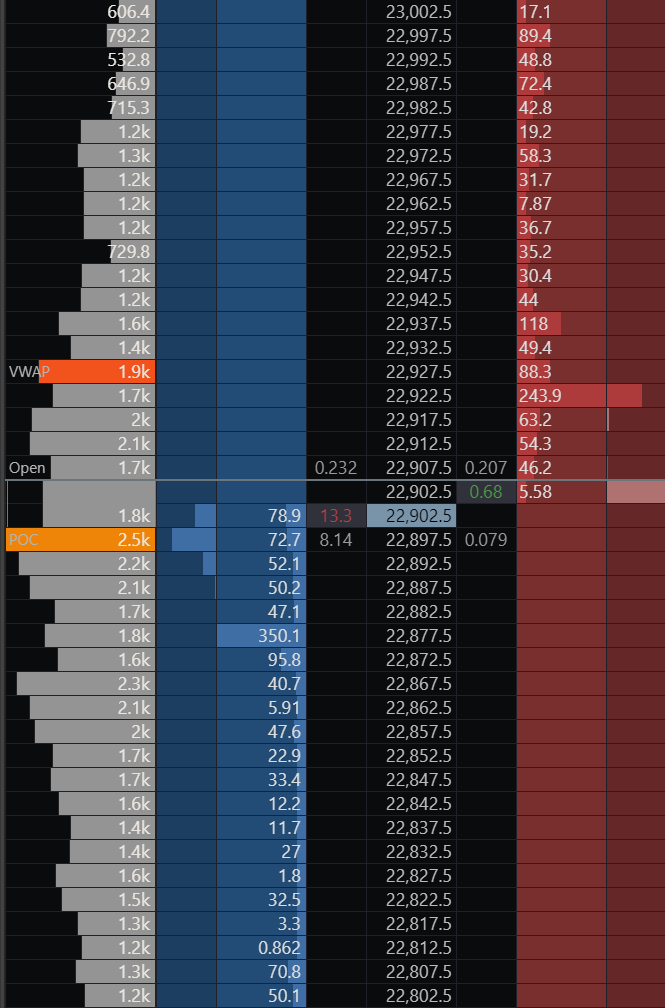
Let’s say; for this example, with Bitcoin trading at $22,902, there would be a large decrease in price that would cause 1000 BTC to get liquidated very close to each other.
This can happen during the news release or new supply steps in.
You can see that to match those 1000 BTC from the bid side. We would immediately jump down approximately $100 to around $22,800.
This would happen within seconds, and if prices continued going down and more liquidations would cascade, prices would drop very fast, very quickly.
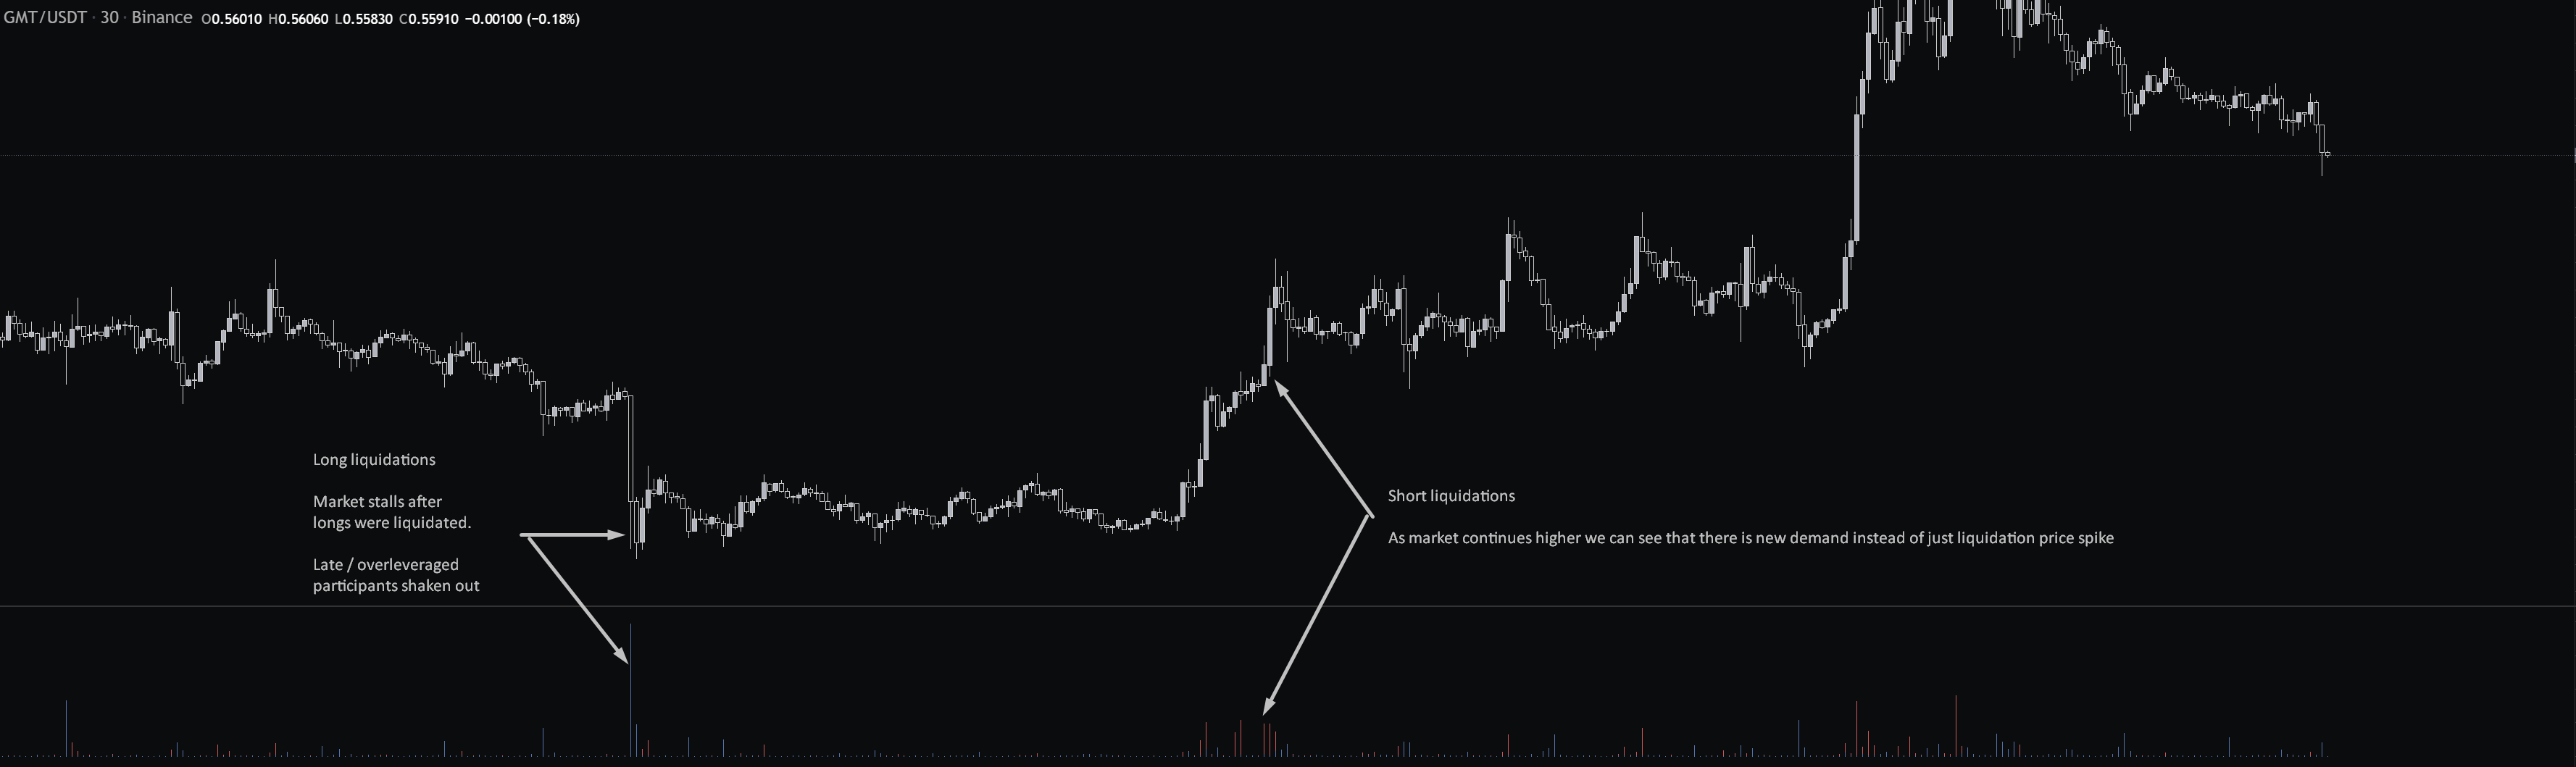
Liquidations can act as good indicators to see the market sentiment.
In ranging markets, you can use liquidations as your mean-reversion tool.
Suppose markets are in an uptrend (or downtrend), and you want to participate in the trade. In that case, you can wait for late/overleveraged traders to get liquidated and provide liquidity for forced sellers.
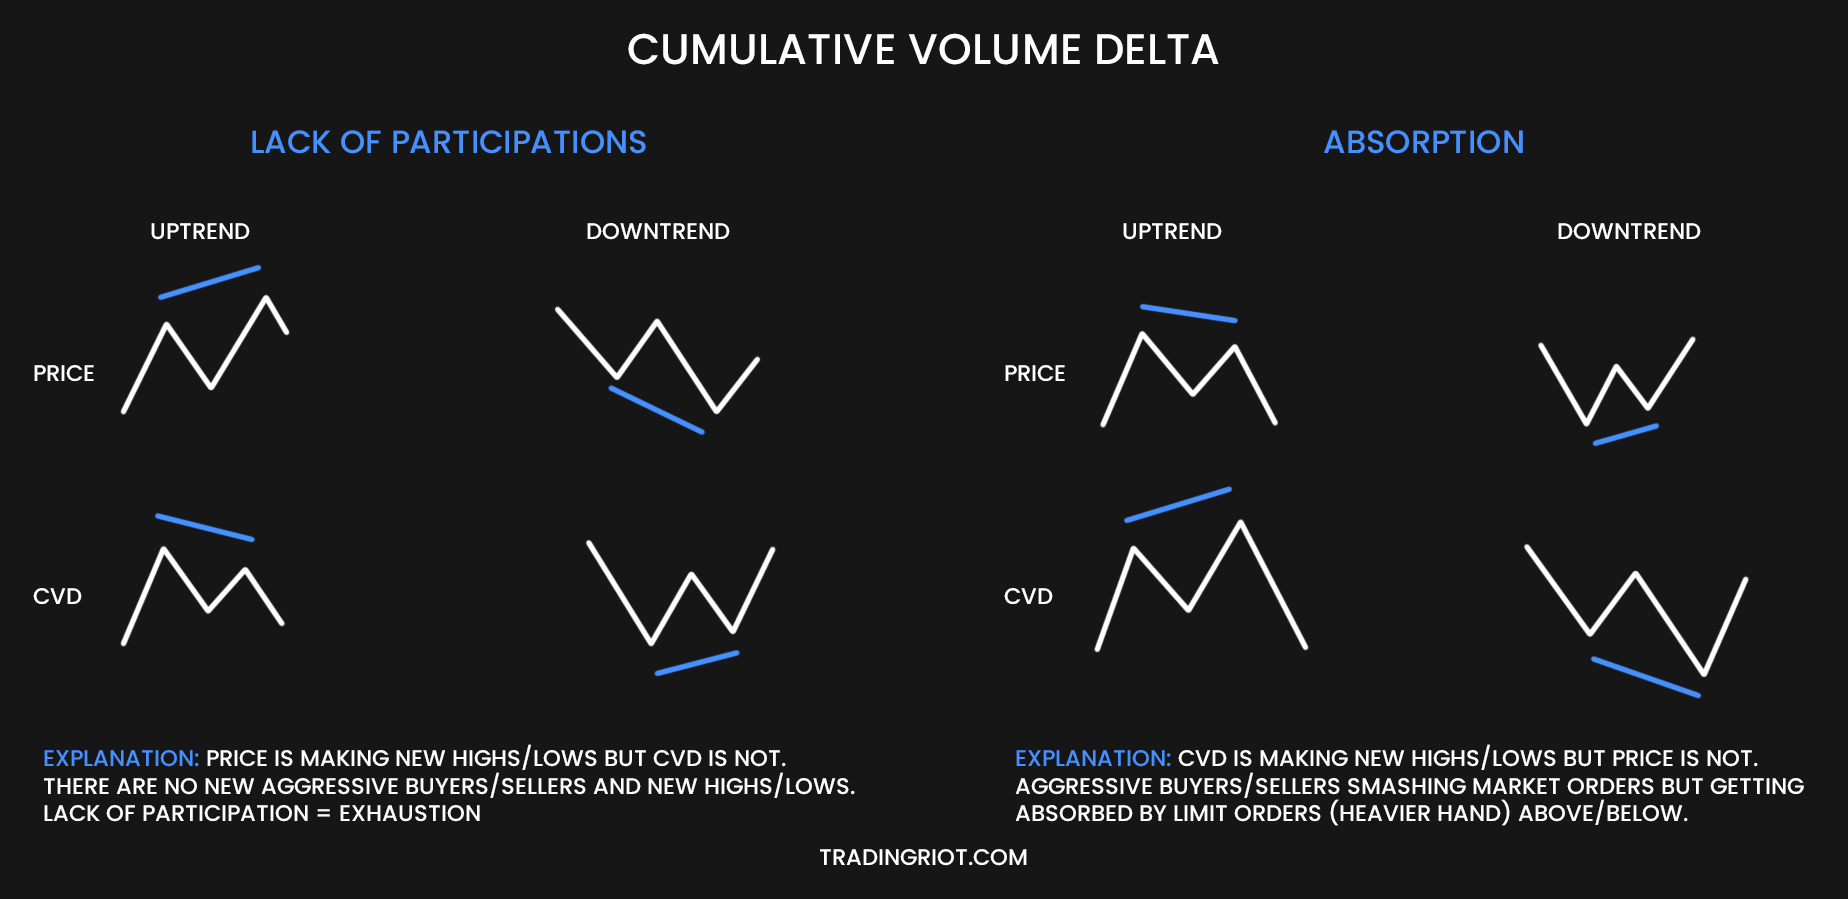
Cumulative Volume Delta
Cumulative volume delta (CVD) plots a running indicator showing a total of finalized executions at the bid and ask.
In other words, the market orders.
When I first learned about CVD, it was in regard to day trading, where CVD is mostly used for spotting divergences.
I already covered that in a post about Orderflow trading.
If you use CVD to try to understand the bigger picture, this can get a little complicated.
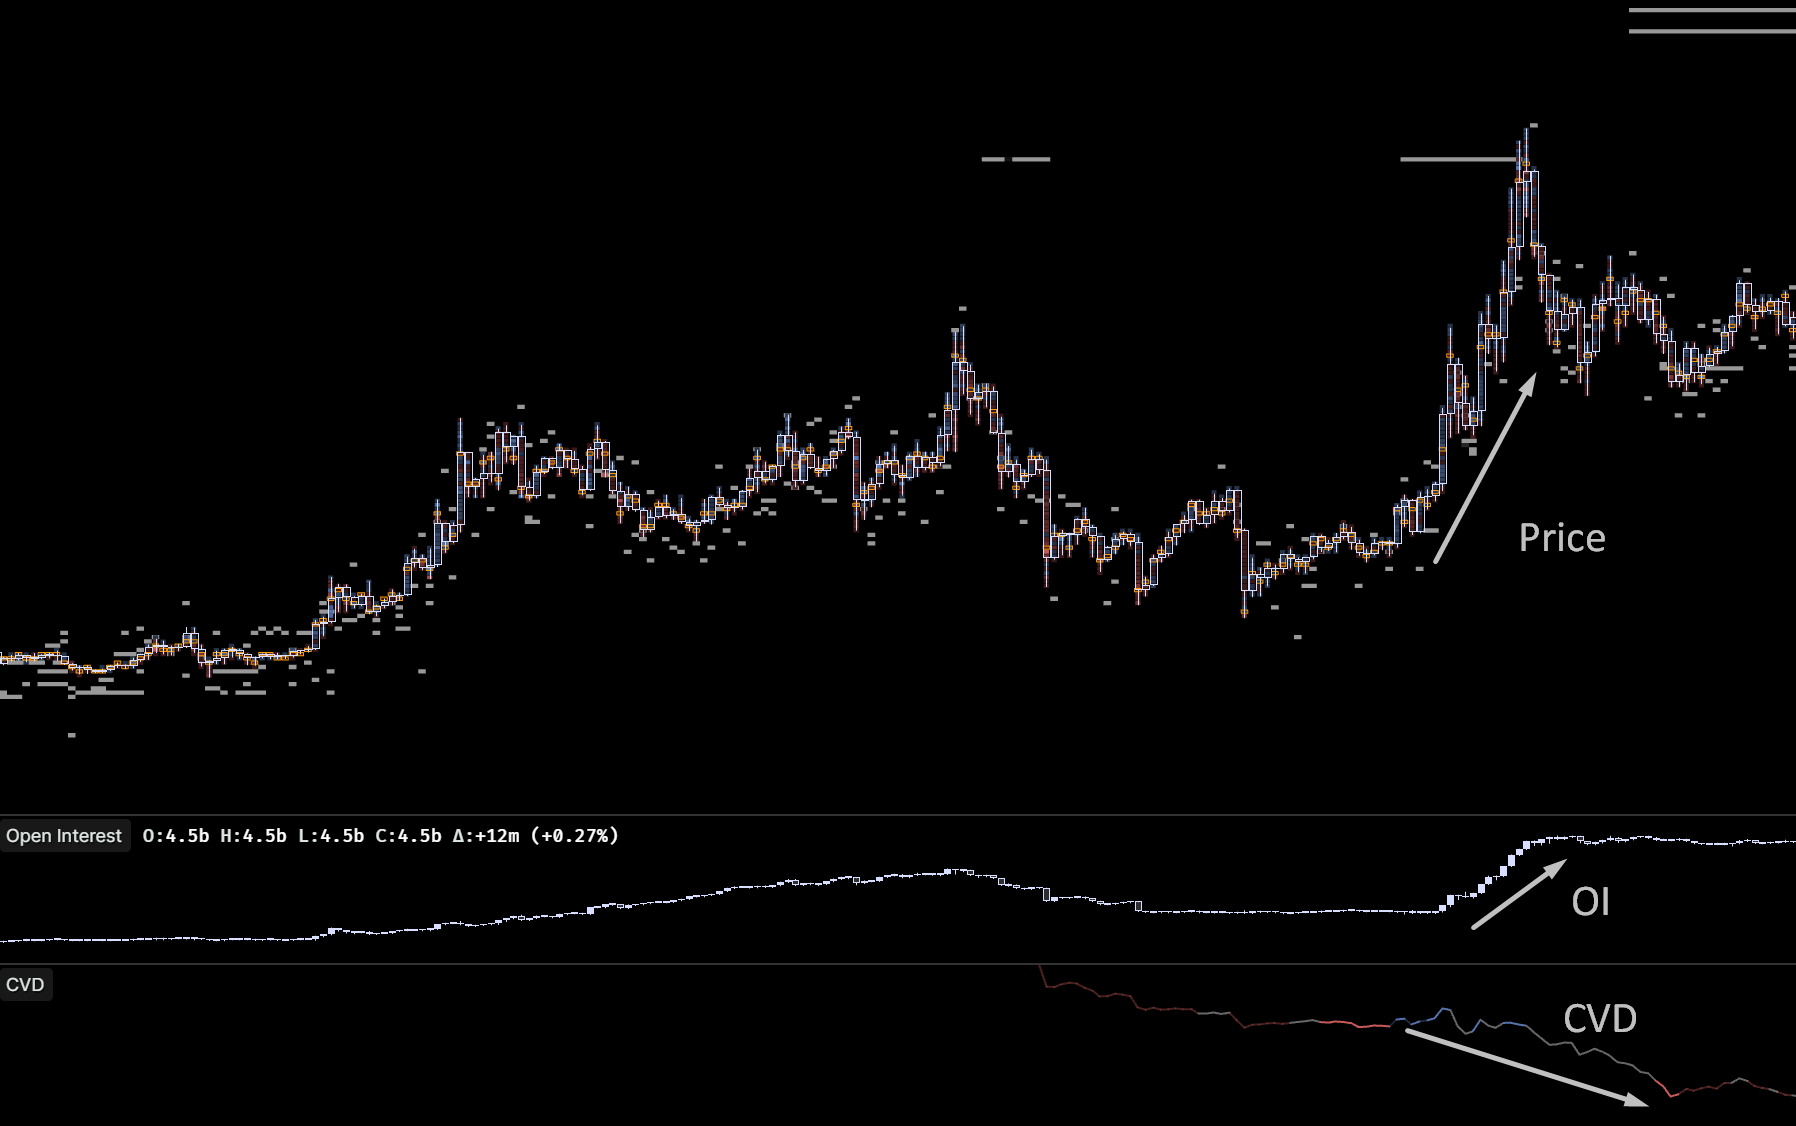
As you can see right here, the price went up, open interest went up, but the CVD went down.
If you don’t understand how the market could move higher when there were more market sell orders, you remember that for every buyer, there has to be a seller and vice versa.
Because of that, this means that the market moved higher on aggressive selling into passive bid.
On top of that, the limit orders are usually used by large players. Therefore, this scenario is quite bullish.
You also need to know that we have spot and derivatives markets in crypto, with spot often playing a bigger role (larger players using spot markets instead of futures).
So watching the relationship between spot and perp CVD can give you the most insight.
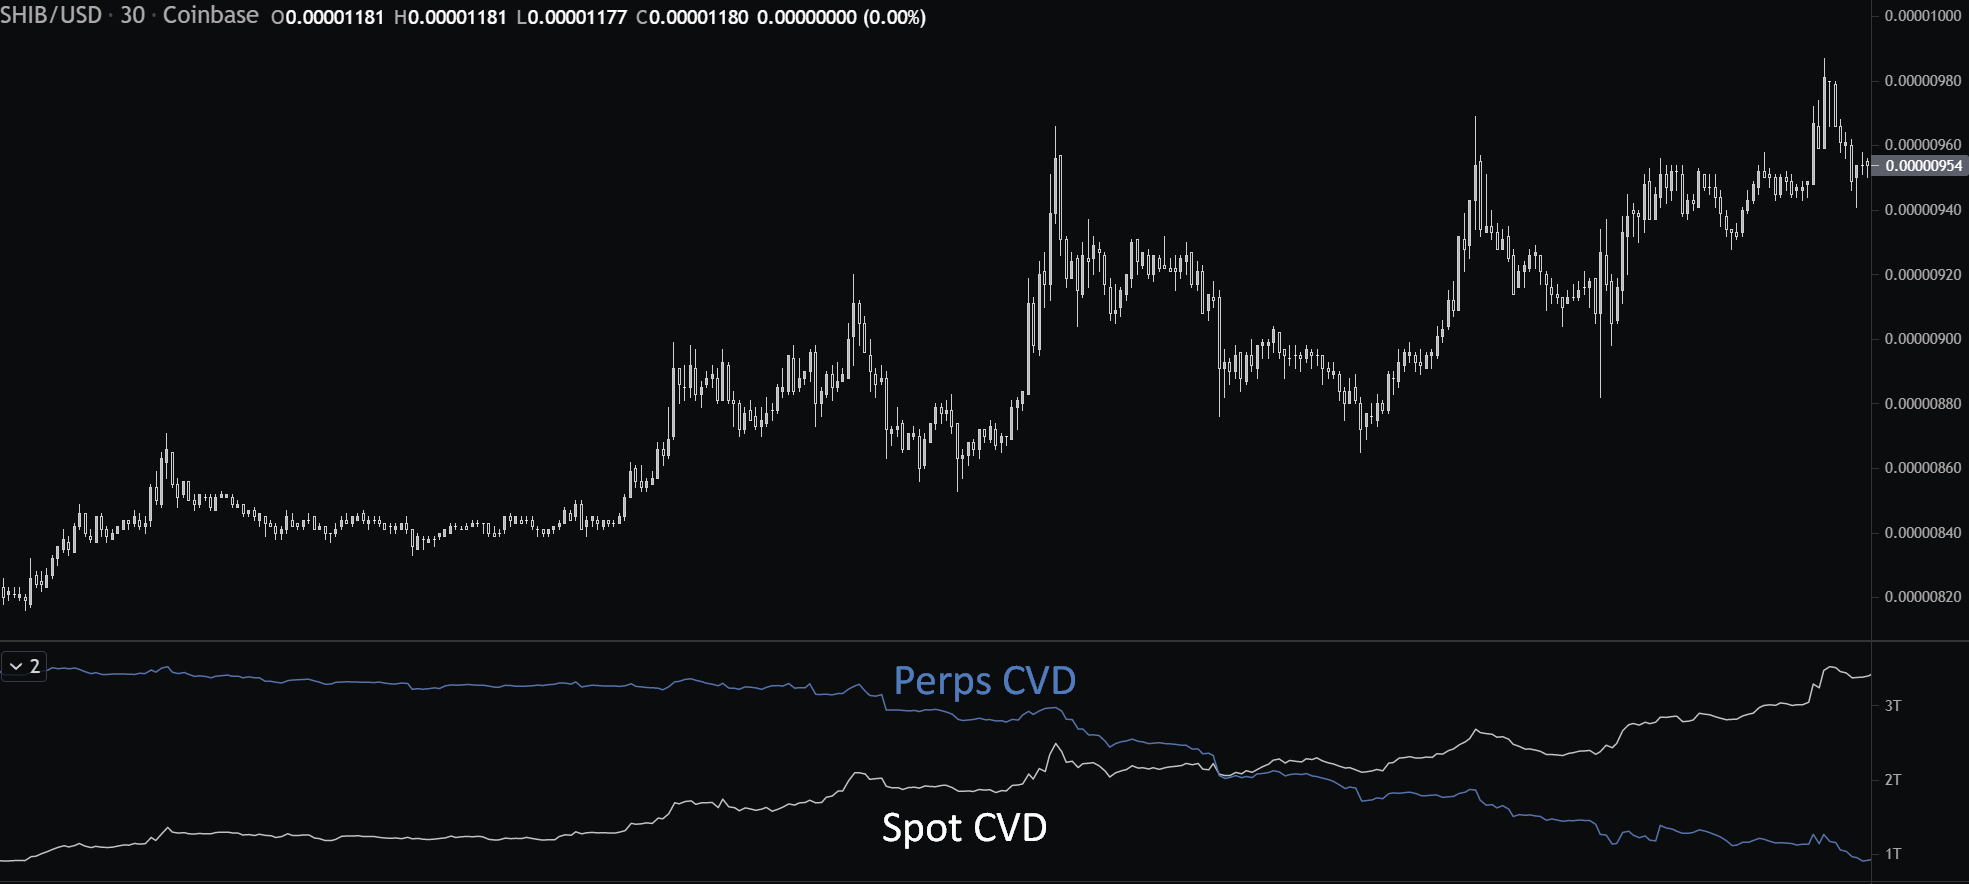
As you can see, as the CVD for perpetual futures went down, the spot market was actually bullish, creating demand for the market.
Remember that when spot CVD is going down, there are no new shorts entering the market as you can’t open a short position on the spot market; you can either go long (CVD goes up), or close your long (CVD goes down).
For short-term trading, you can use CVD divergences between price and CVD to spot possible reversals.
Funding Rates
The funding rate is a crypto unique mechanism that incentivizes traders to open longs and short positions to ensure that the value of the underlying perpetual swap remains close to the spot market price.
If funding is positive, it means that the perpetual swap is trading above the spot price, and if funding is negative, it means that the perpetual swap is trading below the spot price.
- If funding is positive, longs pay a fee to shorts.
- If funding is negative, shorts pay a fee to longs.
This payment happens every 8 hours on most exchanges.
Most people think that if funding is very high or low, it is immediately bearish/bullish because everyone is long/short, and people tend to be wrong so that the market will revert.
This is not true, and high funding can be seen as a cost of doing business.
In other words, if I think the market will rise significantly, I won’t mind paying funding every 8 hours, which keeps me in position.
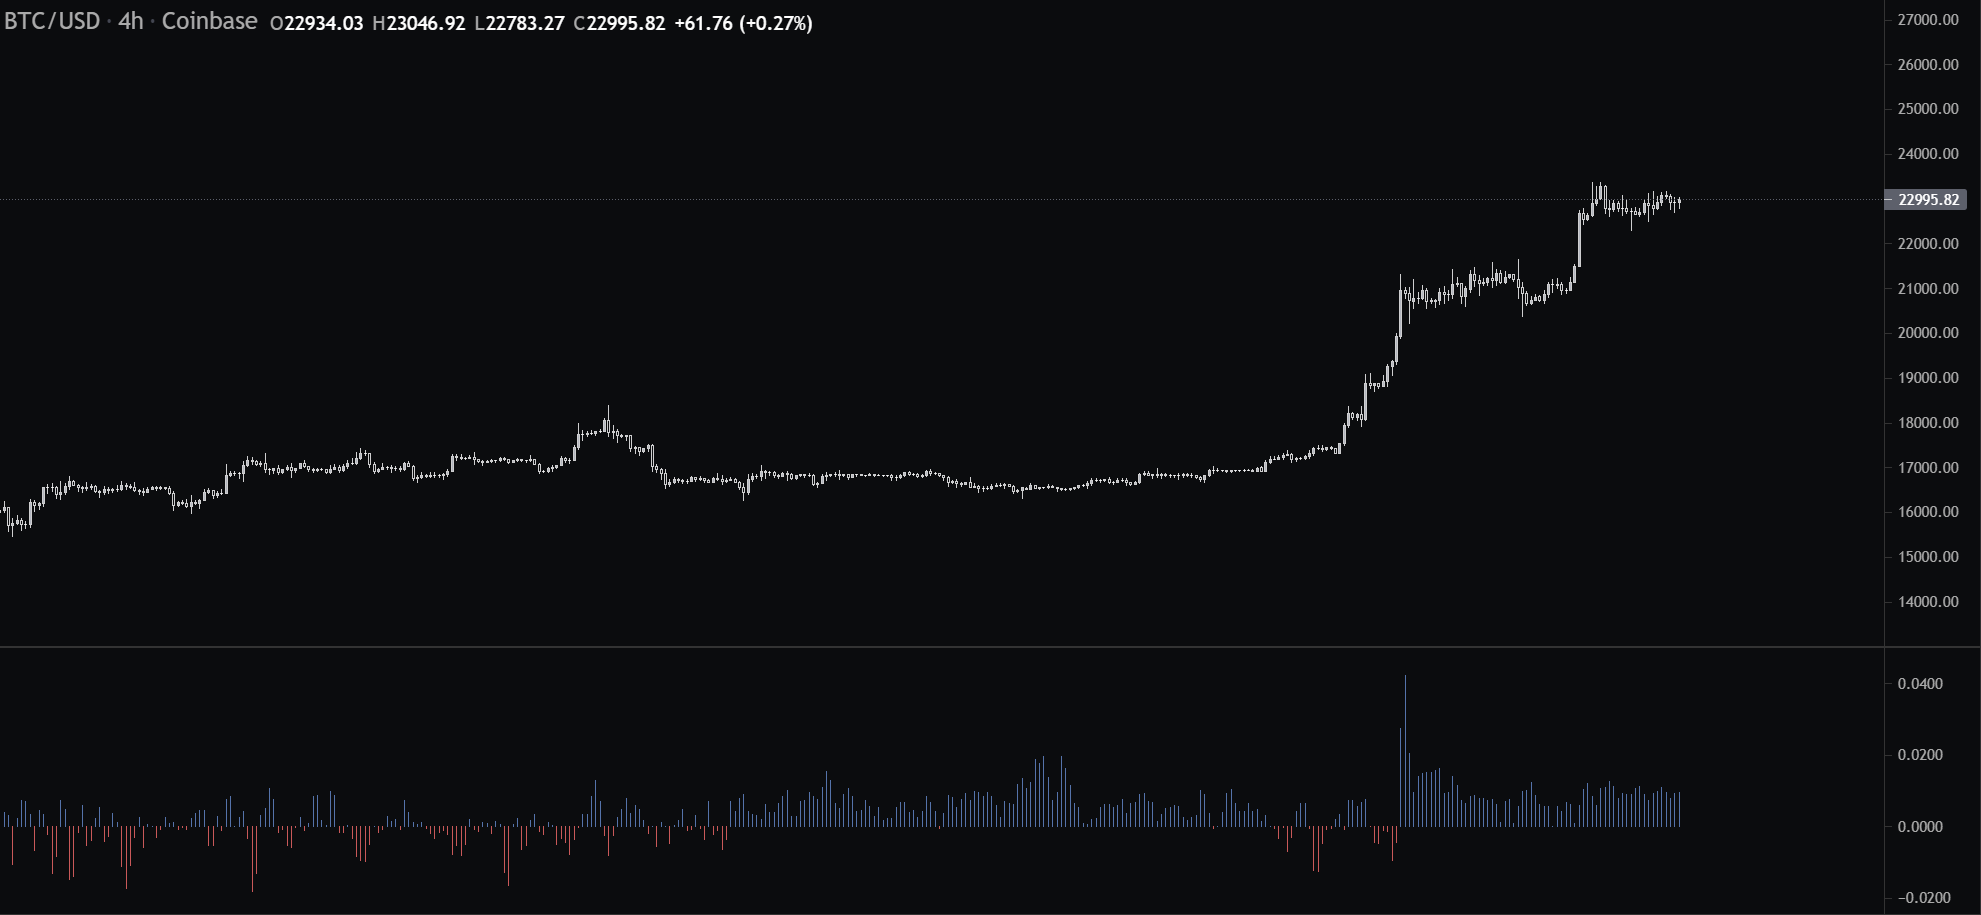
As you can see, during the recent Bitcoin rally, funding remained positive the whole time.
We can look at funding as a counter-trend indicator only if it is extremely high/low and sustains for a longer period.
It is best to pair funding with other indicators, such as Open interest or Liquidations.
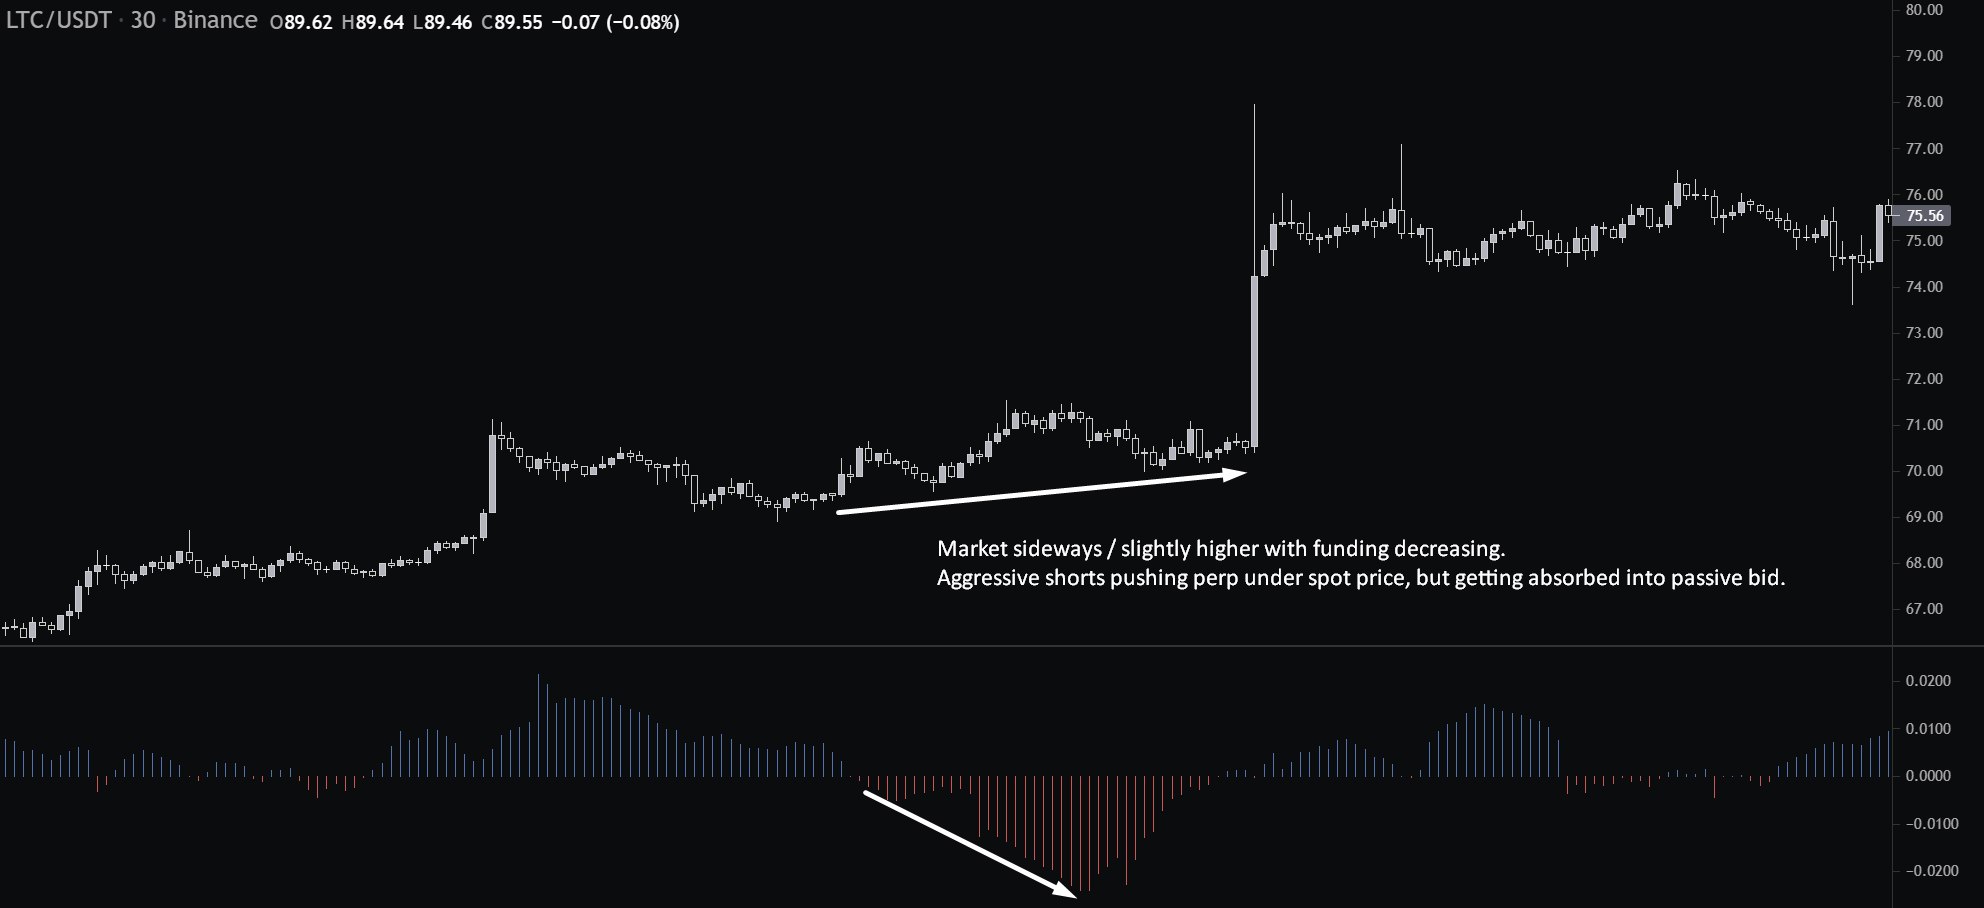
Funding can also be useful during sideways consolidations to see what side is more aggressive and how they get rewarded for their effort.
Because of that, it is better to use the Predicted Funding Rate indicator that automatically calculated predicted funding rates based on current price action.
Tools to use
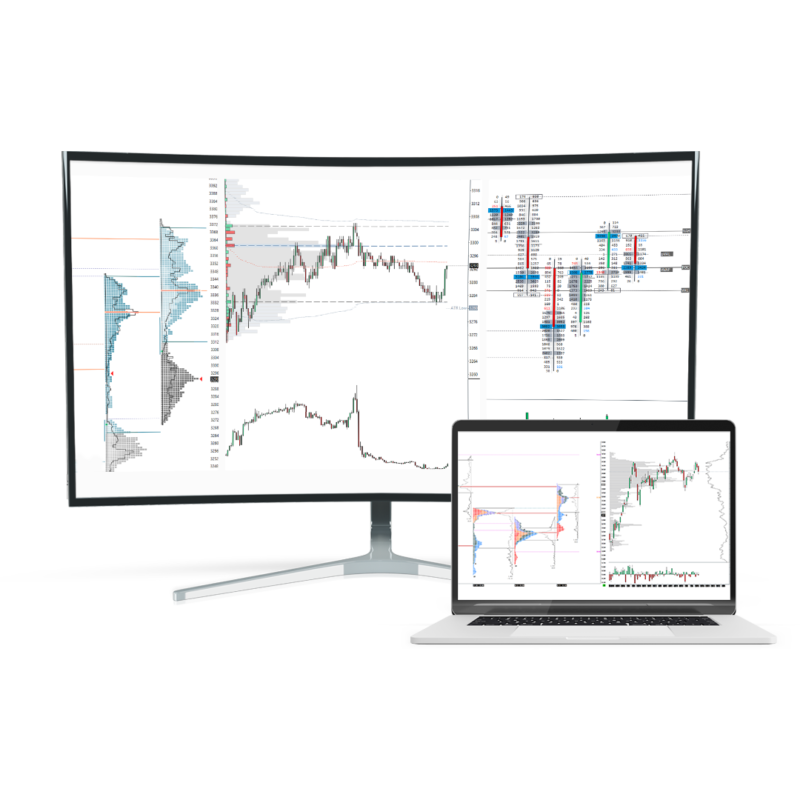
Best tool for charting
With Tradingview being the most popular platform, it has limitations regarding these more advanced indicators.
Recently they have added an Open Interest indicator for Binance futures.

Although Binance is the exchange at the moment regarding volume, you still might miss some details from other venues.
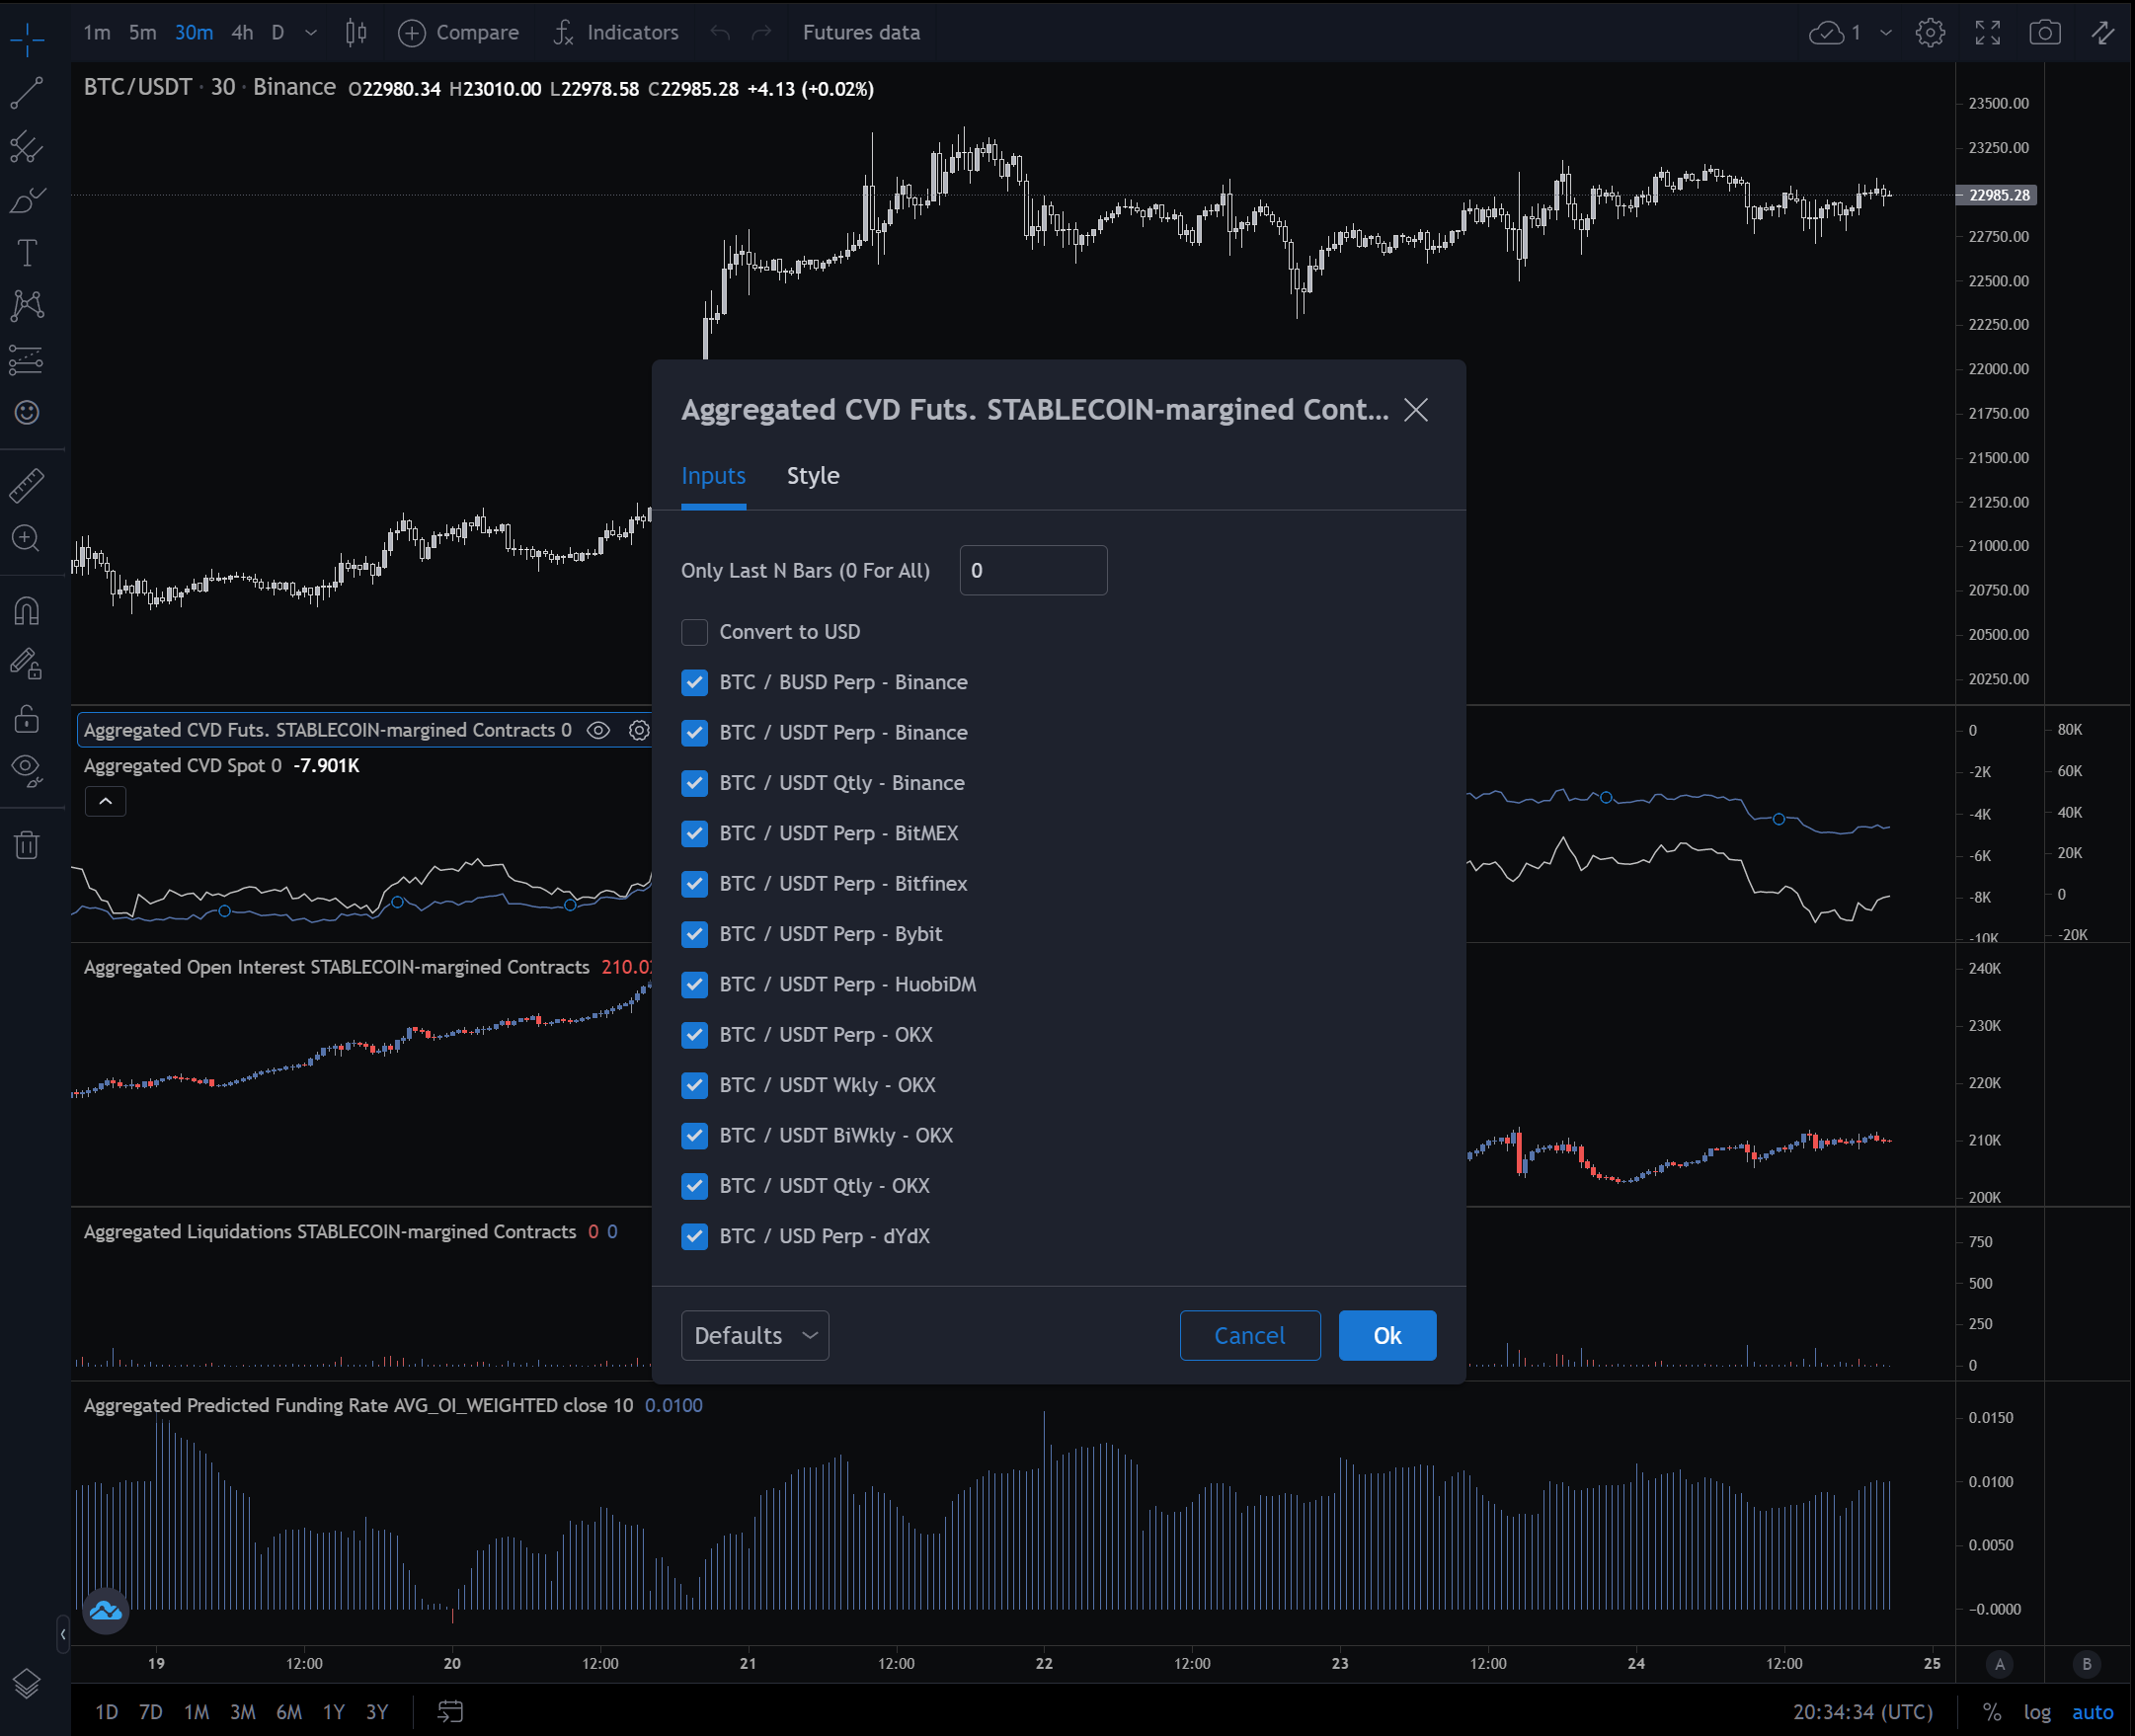
This is when Coinalzye comes in.

It is a free platform that uses Tradingview UI but brings in its proprietary indicators that plot aggregated Open Interest, Liquidations, CVD and Funding rates.
This means that you can use indicators that automatically collect data from all places where a certain coin is traded.
Best tool for research
You might have noticed that there were a lot of altcoins throughout this article.
Also, all the indicators I mentioned are often used to go against retail traders as they are often wrong.
Because of that, the orderflow tends to often be much cleaner on altcoins than BTC or ETH.
You, of course, need to understand that with very high correlations, these inefficiencies are often very short-lived; therefore, it is best to trade things more on an intra-day or intra-week basis, especially if you go against the general trend.
The issue with altcoins is that there are too many of them.
One way you can do this is to spend hours on Twitter/Discord to catch up on current narrative plays constantly, but that can be extremely exhausting and time-consuming.
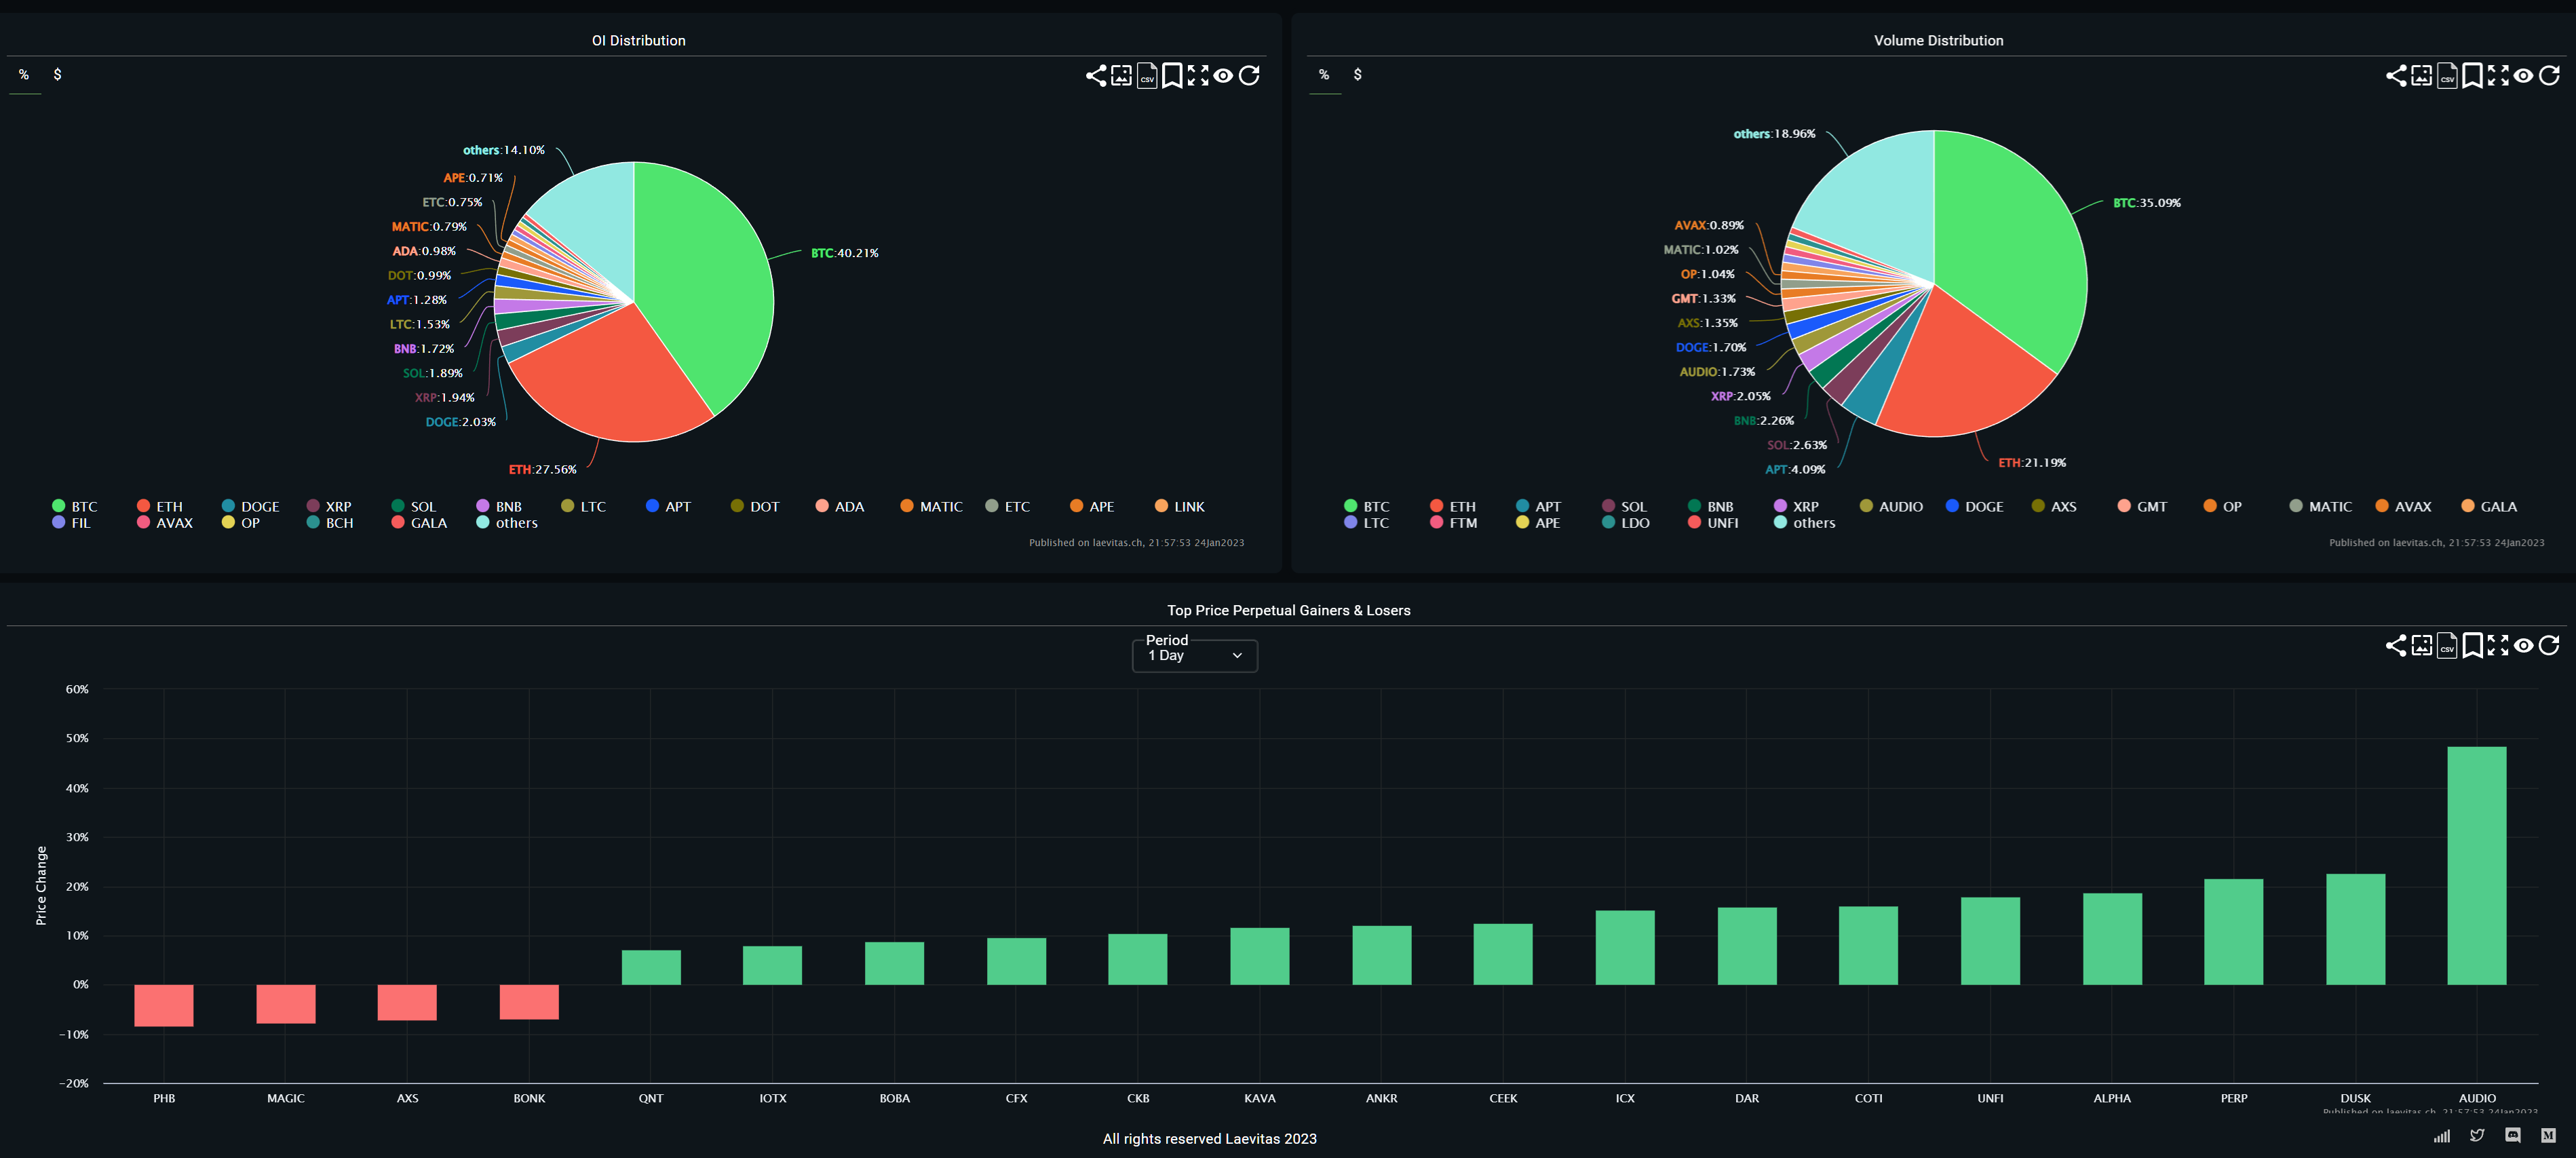
Or you can use a free website like Laevitas, which allows you to easily track large changes in Open Interest, Funding Rates or Liquidations.

The website offers many different options and dashboards that cover much more than just altcoins. They also have deep analytics of options and much more.
Trade Example – ENS Orderflow
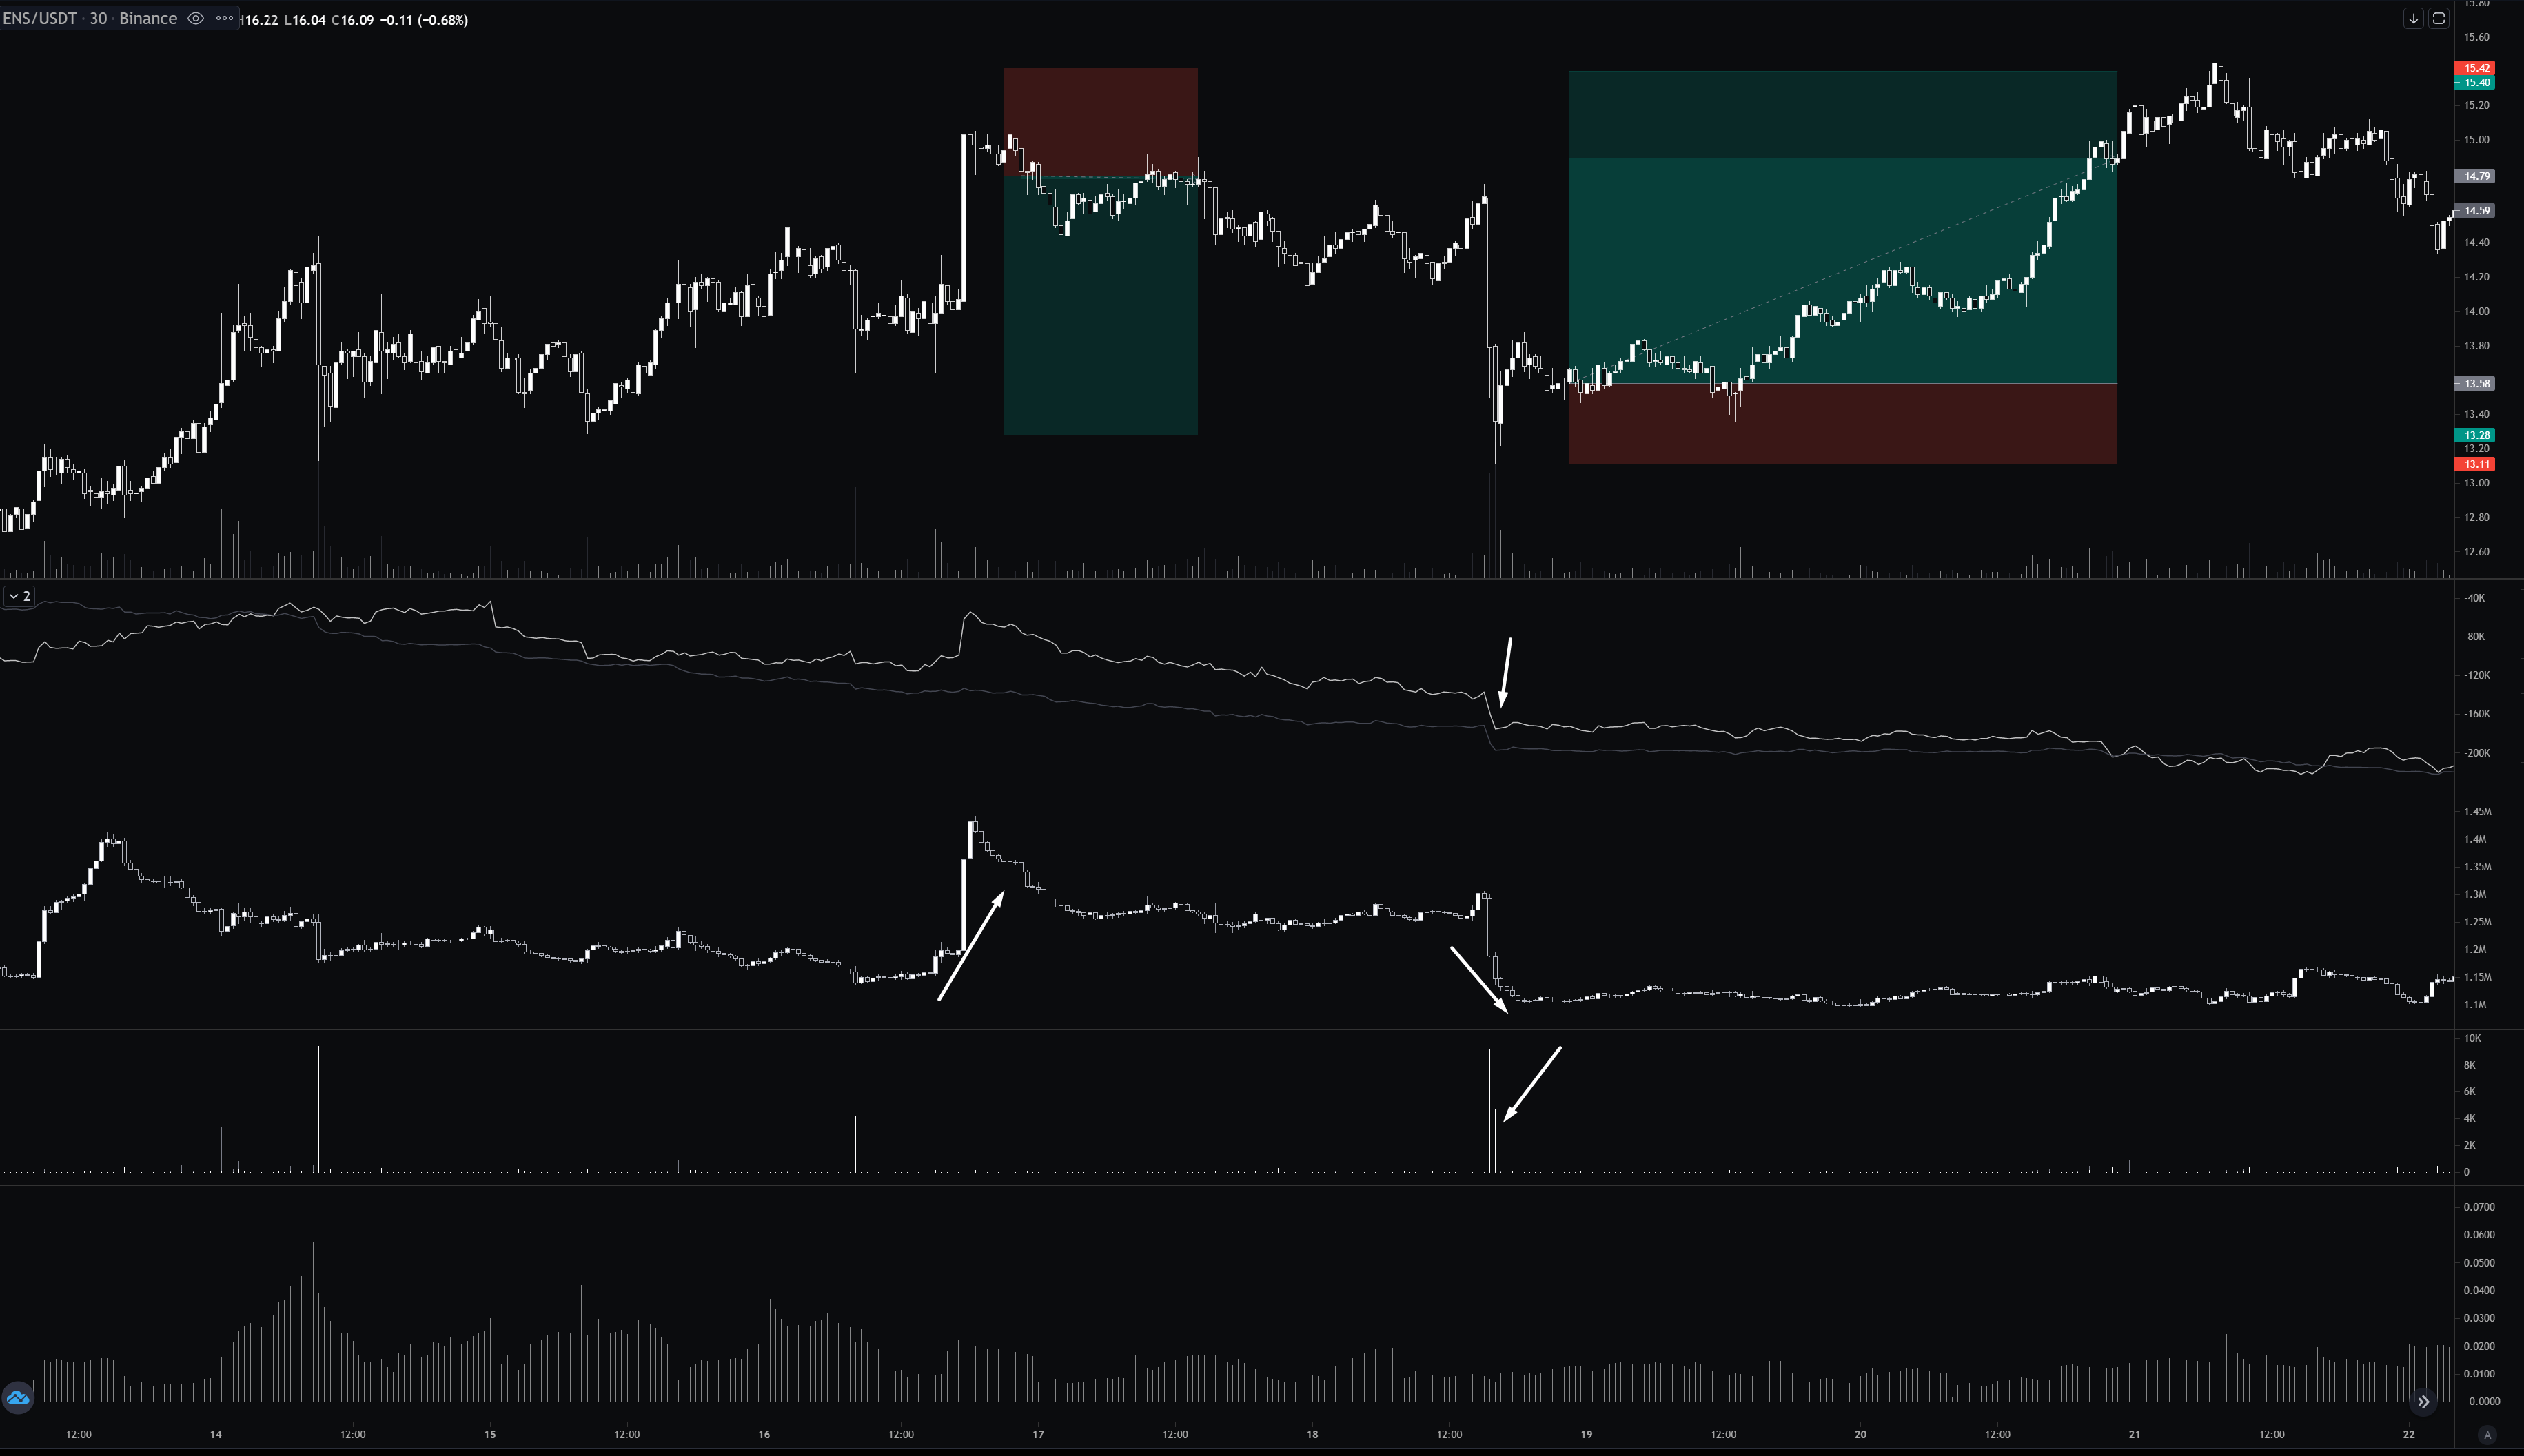
In this example, you can see a typical “retail FOMO”.
ENS broke above previous resistance on the large increase in open interest and jump on predicted funding.
Although spot CVD (white line) rose as well, the market started to stall almost immediately.
This tells us that someone on the opposite side used those buy market orders to fill their passive offers.
This can give you a great opportunity to go short betting on longs to puke their positions.
As ENS was in more of an uptrend lately, going long might make a little more sense.
One of the good things to always pay attention to is to enter the trades when others are forced to exit.
Because of that, buying after the OI rises with everyone else doesn’t make sense.
What is a much smarter approach is to wait for Open interest flushed paired with liquidations and a slight decline of funding (perps are trading closer to spot price).
As you buy into liquidations, you are providing liquidity for those forced to exit, i.e. buying when others have to sell.
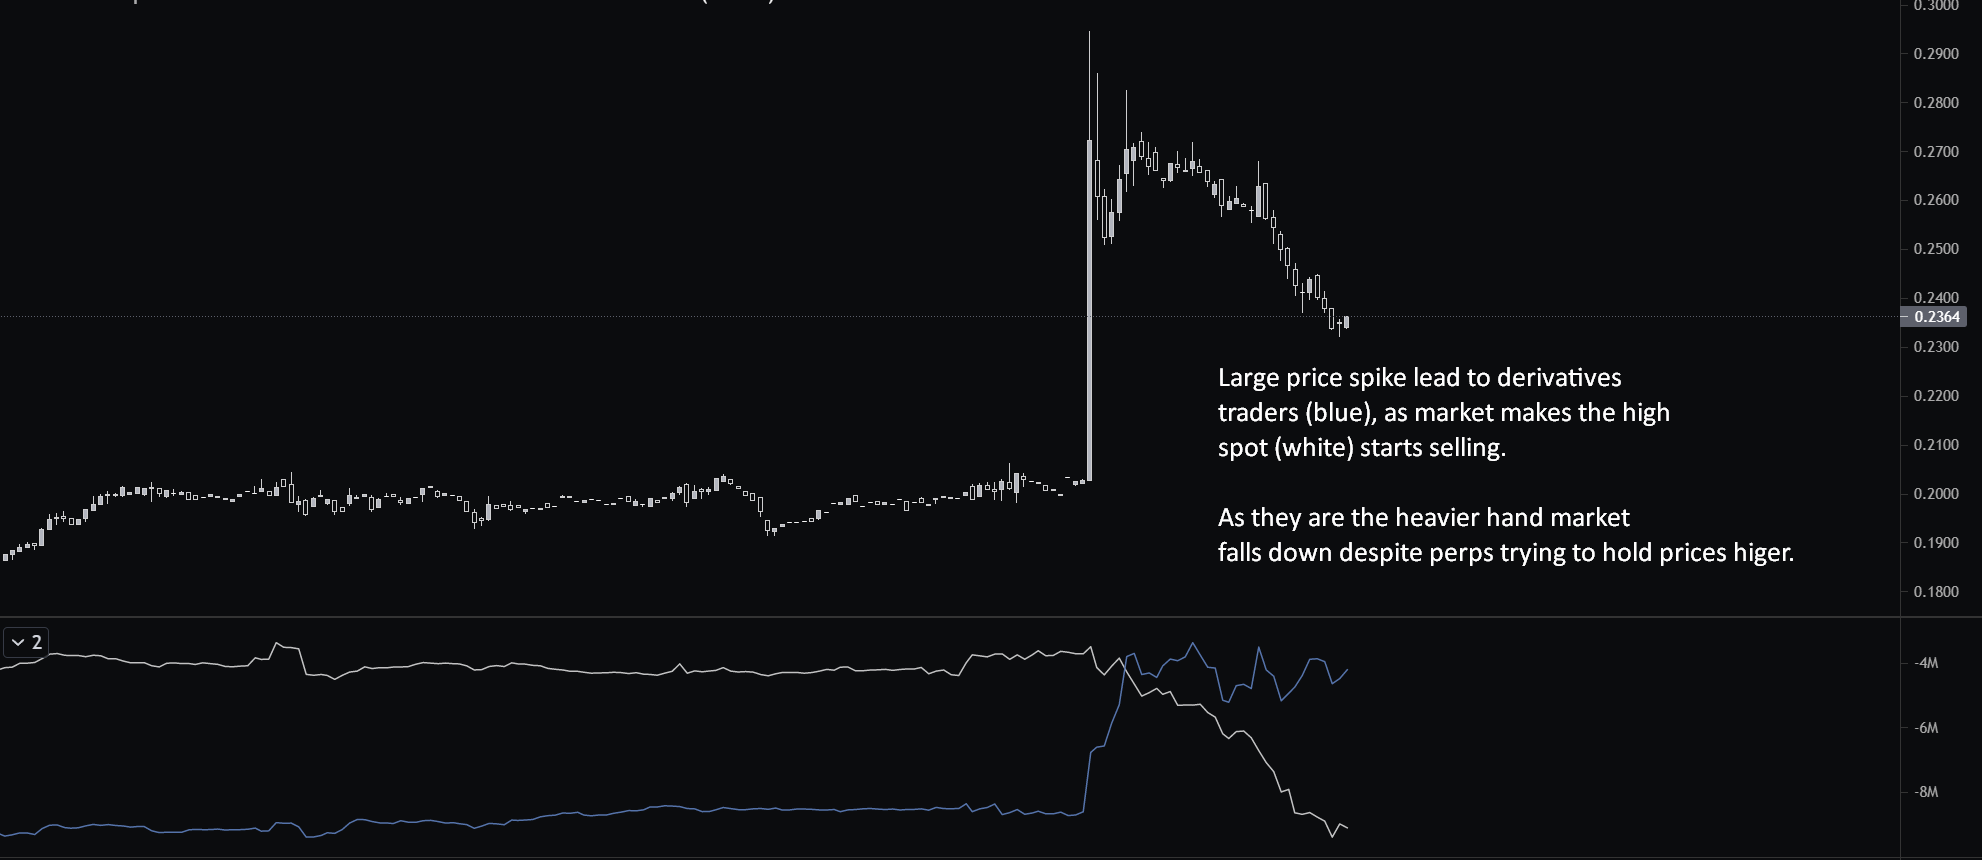
Trade Example – Waves Orderflow
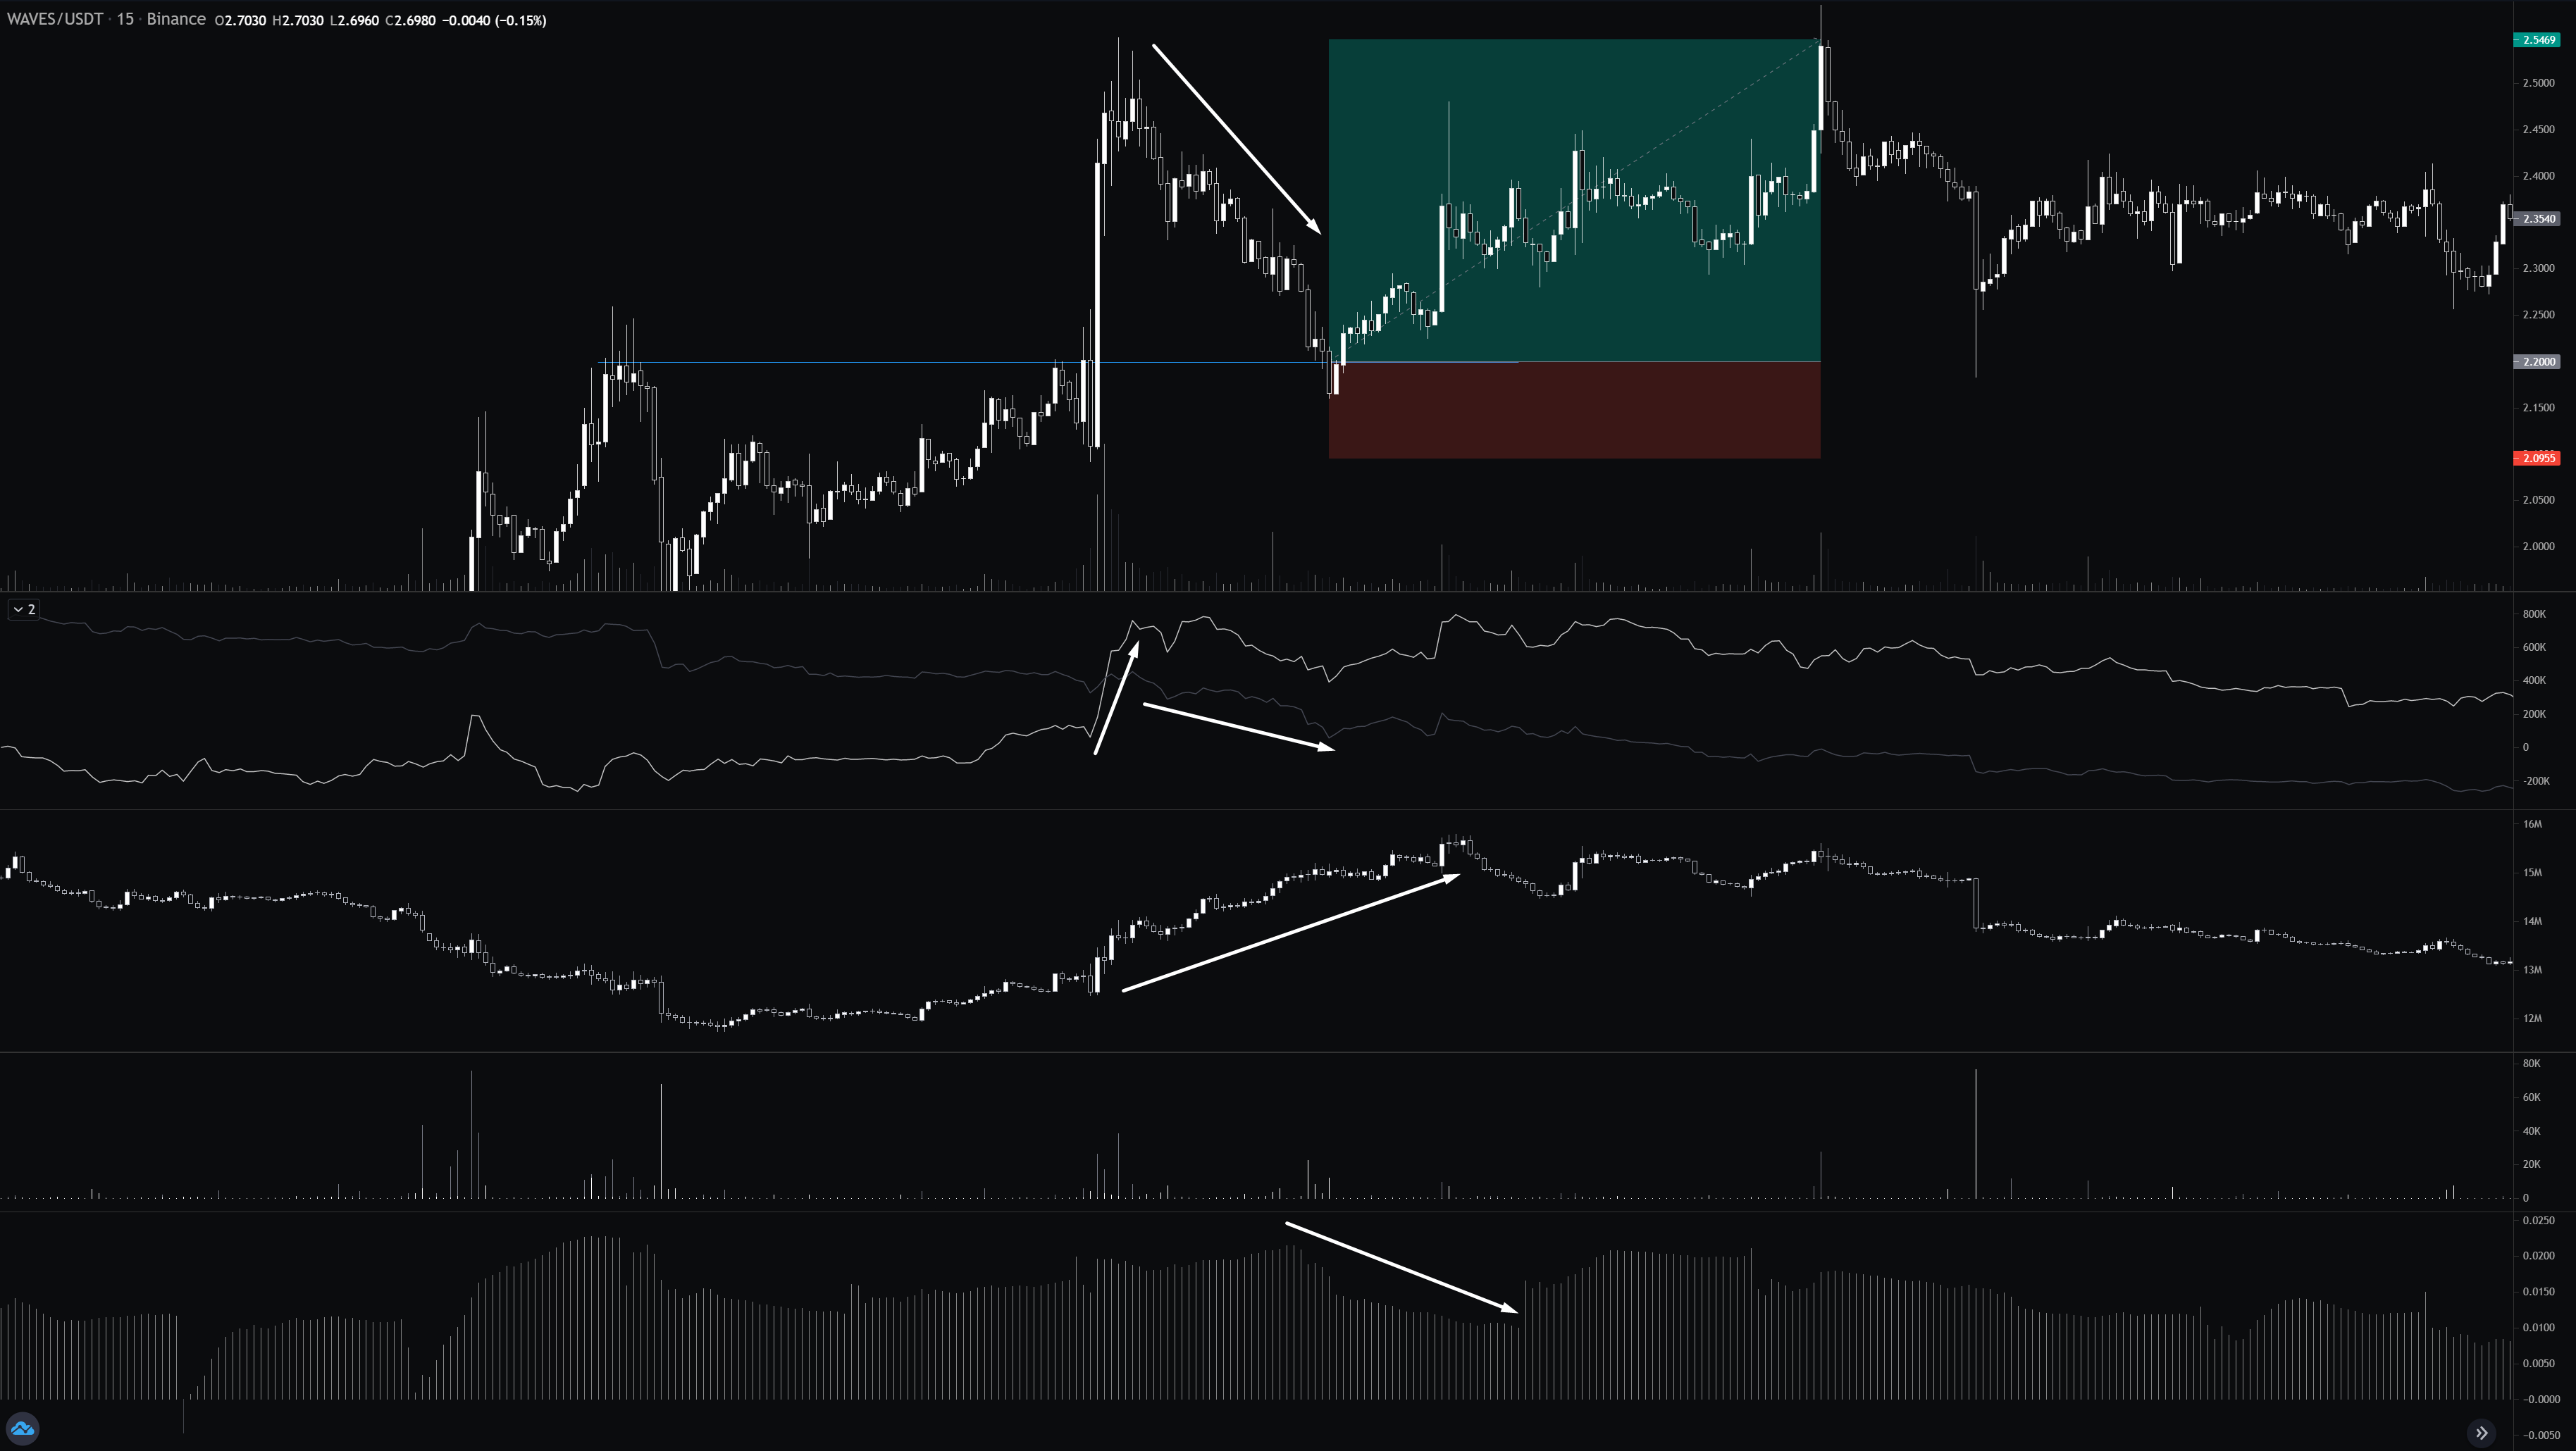
Like ENS, Waves had a strong push to the upside, but the orderflow dynamic of this move is completely different.
This move was mostly spot-driven, and perps only decided to step in at the top with heavy shorting.
I hate the buzzword “hated rally”, but if you could put it on the chart, this would be it.
Market retracing toward the previous S/R level on rising open interest, CVD going down, and funding declining tell us that Perps are trying way too hard to move this market down.
Once the market reaches the S/R level, spot CVD returns to bid, making this an even better opportunity to go long.
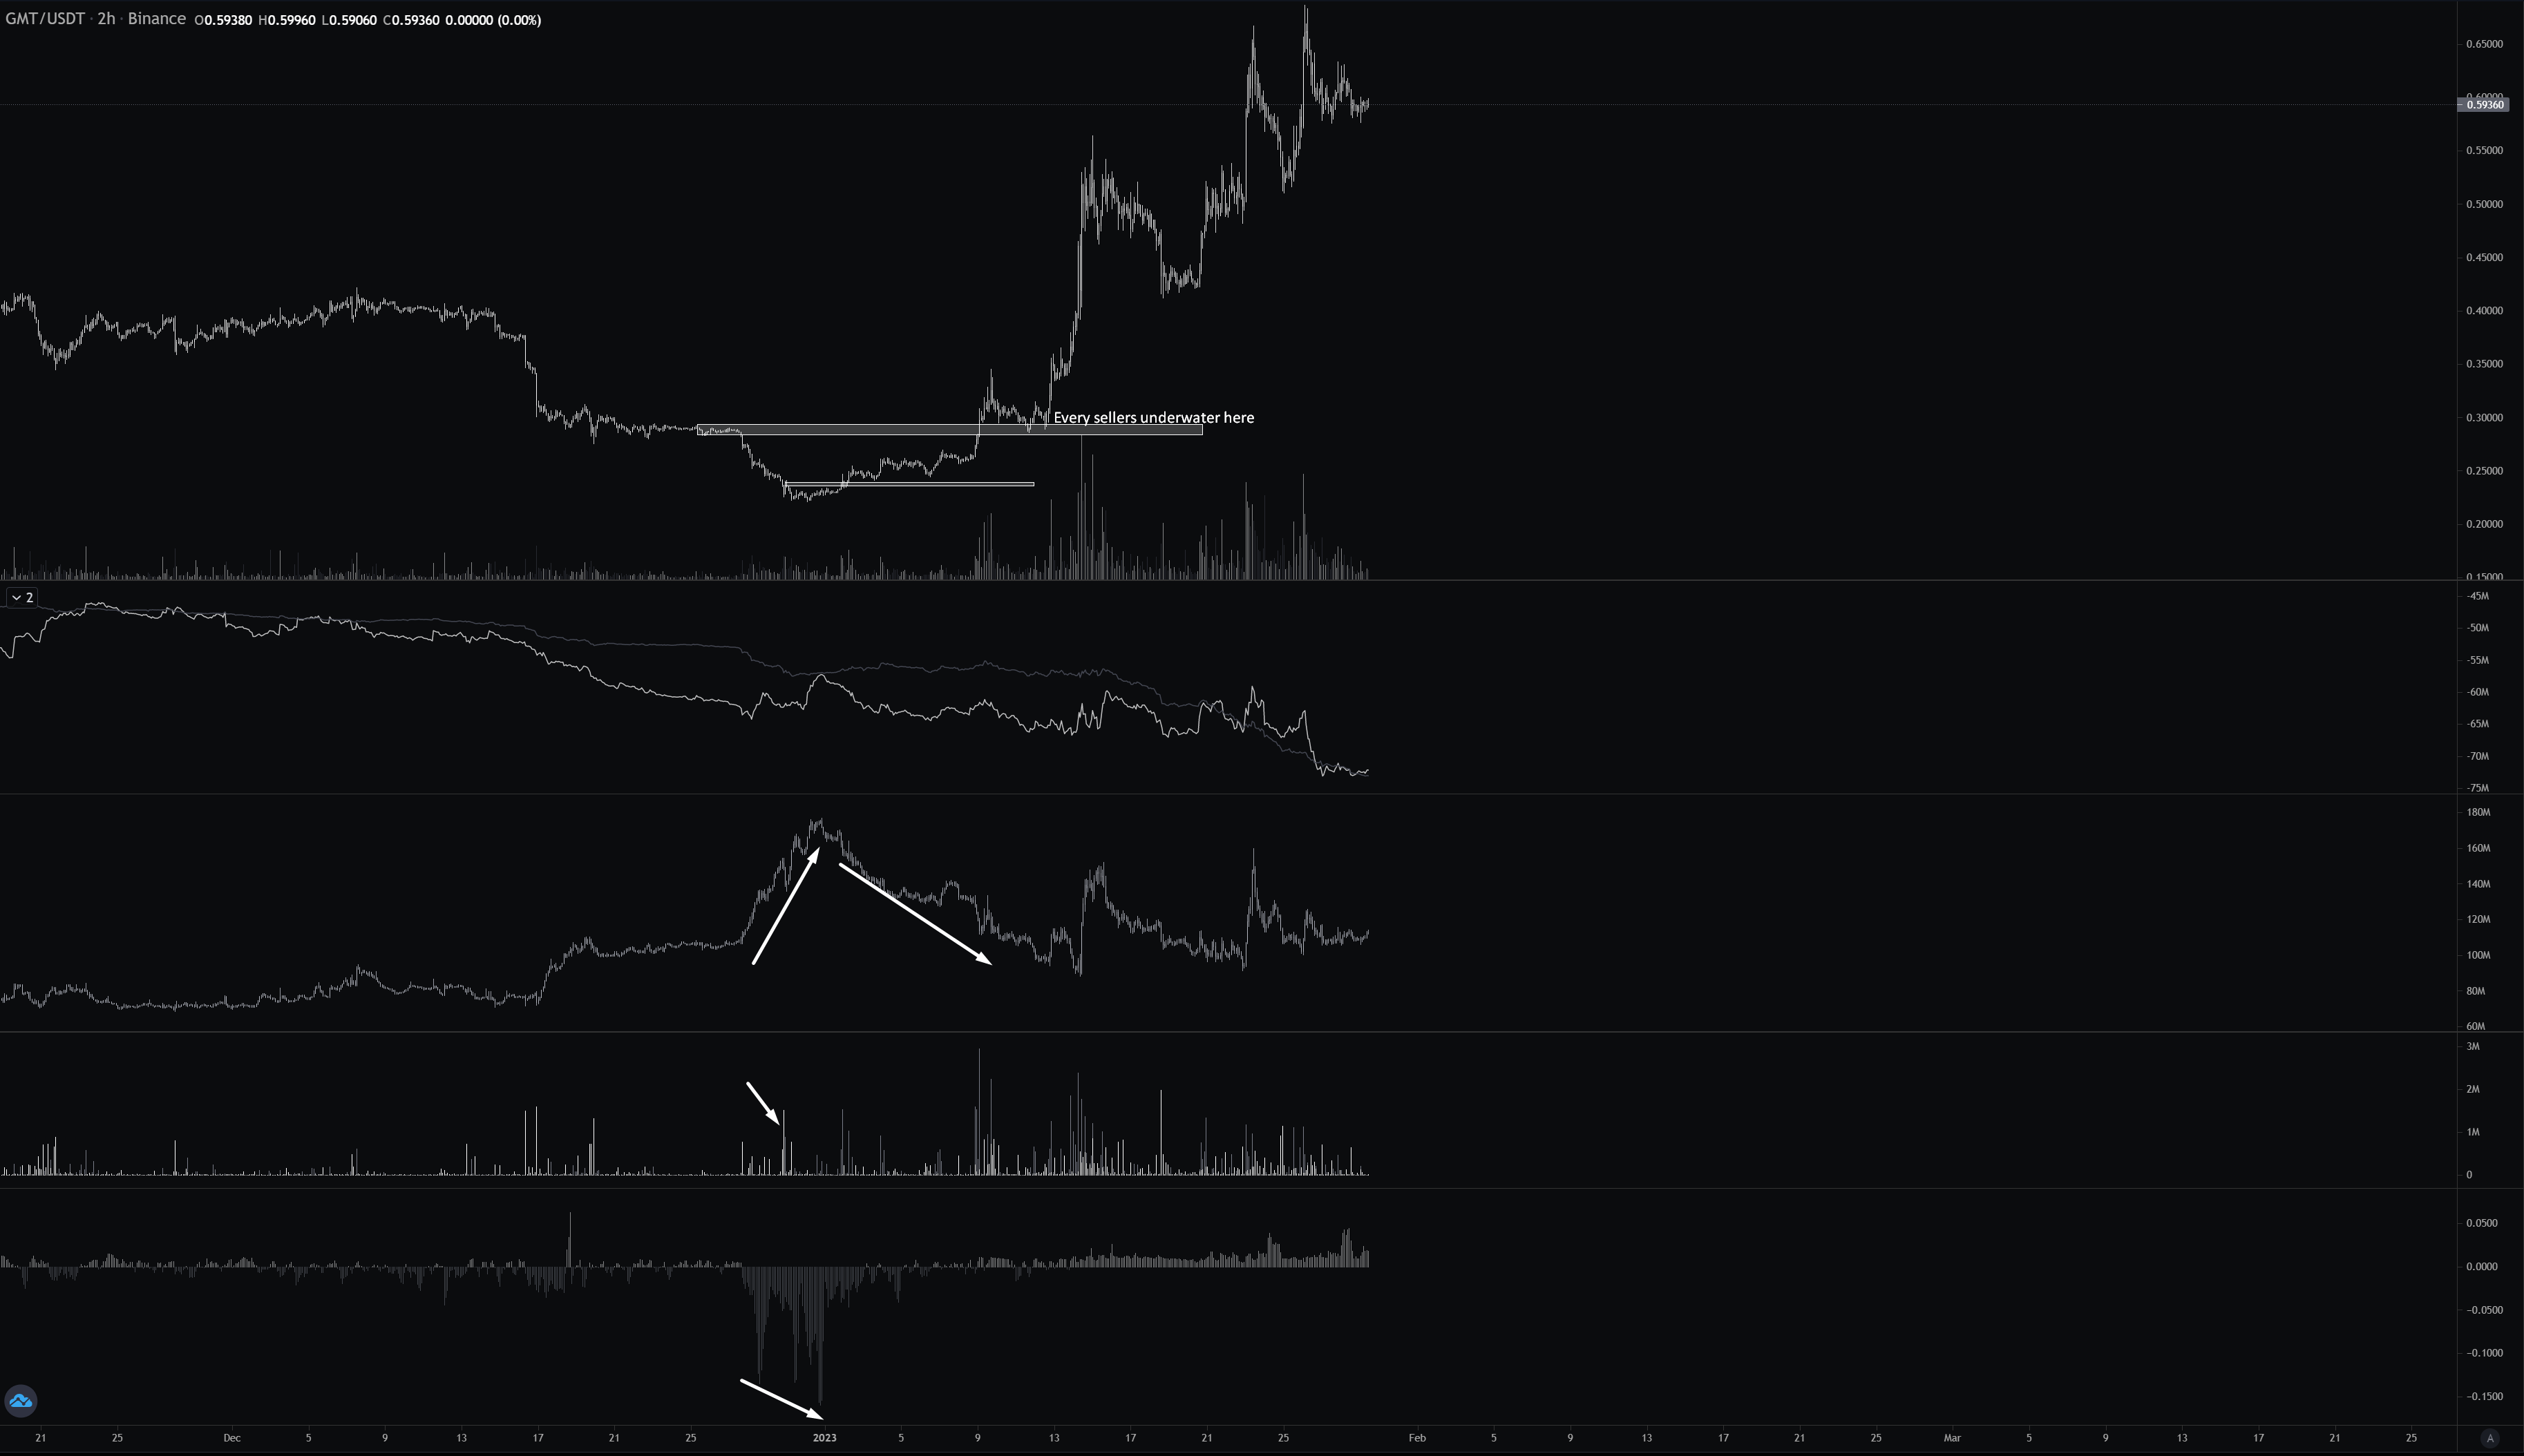
Trade Example – GMT Orderflow
Crypto is extremely correlated; when coins go up, they usually go all up together and vice versa.
But there are nuances. Some coins go up more than others.
This is because of three things:
- Available liquidity in a given market – Thinner (less liquid) markets will go up and down much more because it takes less effort to move them
- The narrative – fundamental based event surrounding any given coin
- Orderflow
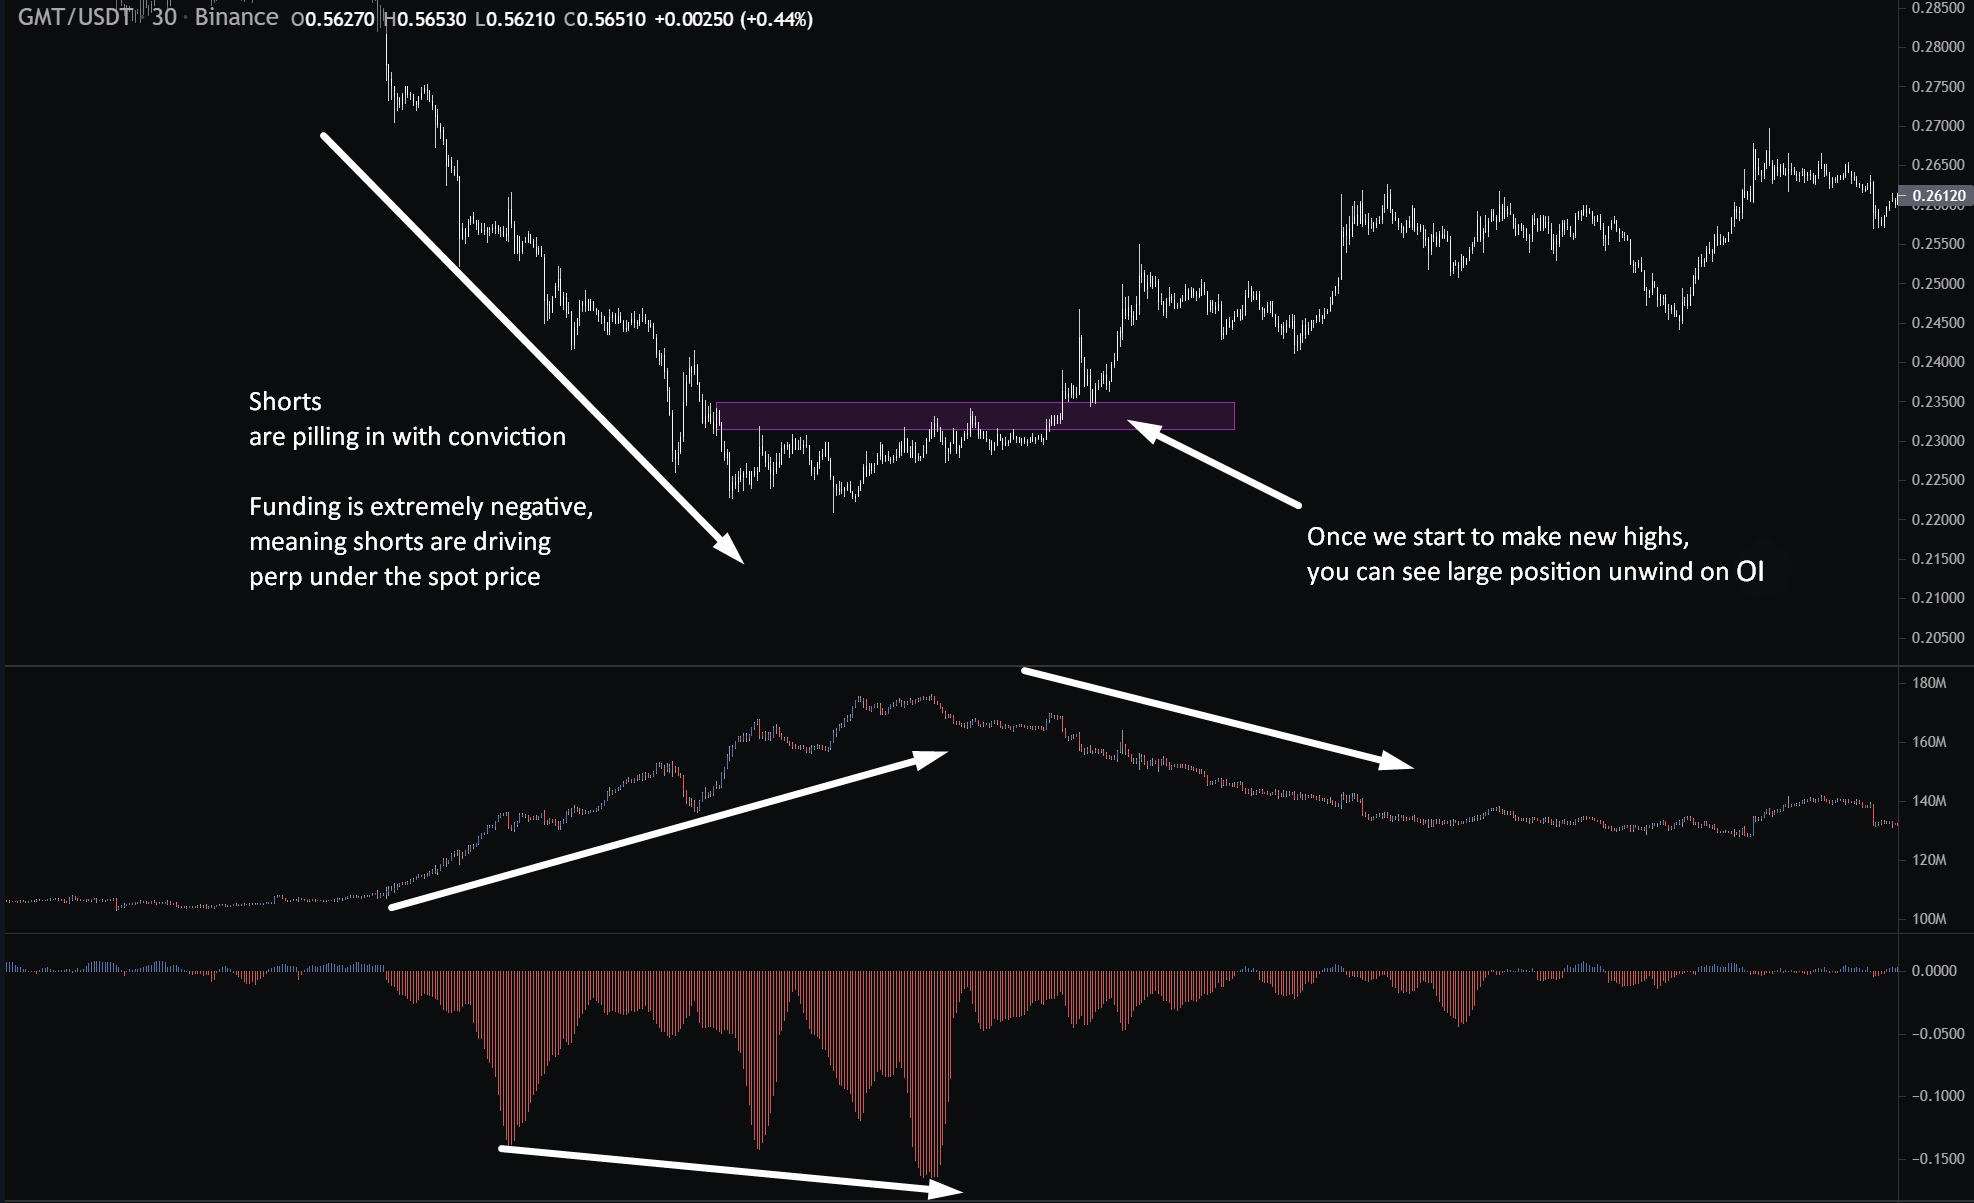
If we are going to have a look at GMT here, you can notice that from the end of December towards the New Year, a large amount of shorts stepped in.
What is interesting to see here is that this move is highly perp driven as spot CVD remains flat with perps OI highly increasing with large negative funding.
As the whole crypto market turned bullish, this would make a GMT perfect bet for the long side as you are not only playing the strength of the overall market but also picking up the coin that was heavily shorted before the move up, meaning the short liquidations will likely drive it much higher.
This was definitely one of the contributing factors to the fact that GMT was one of the best performers of the recent rally.
Conclusion
This covers the basics of cryptocurrency derivatives that I think everyone who decides to trade these should know.
For additional resources, make sure to read the article about Open Interest by Austerity Sucks, Derivatives Excercise by ByzGeneral, and Utilizing Orderflow for Altcoin Trading by RunnerXBT.
Do not be that guy who goes, “Oooooh, funding negative; I’m all in long.” without looking at anything else.
Use all the tools together to have a bigger context. Ideally, you want to implement them with some simple technical analysis or fundamental reasonings.
If you are interested in how I use these indicators and websites like Laevitas to find trading opportunities, I will cover that inside Tradingriot Bootcamp.