

Definitive Guide to Trading Supply and Demand – Does it work?
Trading supply and demand is considered to be a holy grail in price action concepts.
Over the years, it was rebranded, repackaged, and resold by many educators.
But can you make money by drawing rectangles on your chart?
This is what we are going to explore in this article.
At first, I planned to make this simple supply and demand trading guide.
But because I used to trade these concepts myself in the past, I went through many different videos, forum posts, or courses and some of the things I have seen through the years are absurd and funny.
That’s why before learning the strategy, I will shed some light on the supply and demand trading gurus and some crazy things surrounding them.
Nowadays, I use much more than price action in my trading.
However, I’d say that I still have a very decent knowledge about the trading strategy itself. I also think that once you get rid of all nonsense, trading supply and demand can achieve profitable results.
If you like this article, read the rest of the blog or join the Tradingriot Bootcamp for a comprehensive video course, access to private discord and regular updates.
For those who are looking for a new place for trading crypto, make sure to check out Woo. If you register using this link and open your first trade, you will get a Tier 1 fee upgrade for the first 30 days, and we will split commissions 50/50, which means you will get 20% of all your commissions back for a lifetime. On top of that, you will receive a 20% discount for Tradingriot Bootcamp and 100% free access to Tradingriot Blueprint.
You can either read the article or watch the video version on Youtube
Table of Contents
Supply and Demand Trading Gurus and Paid Courses
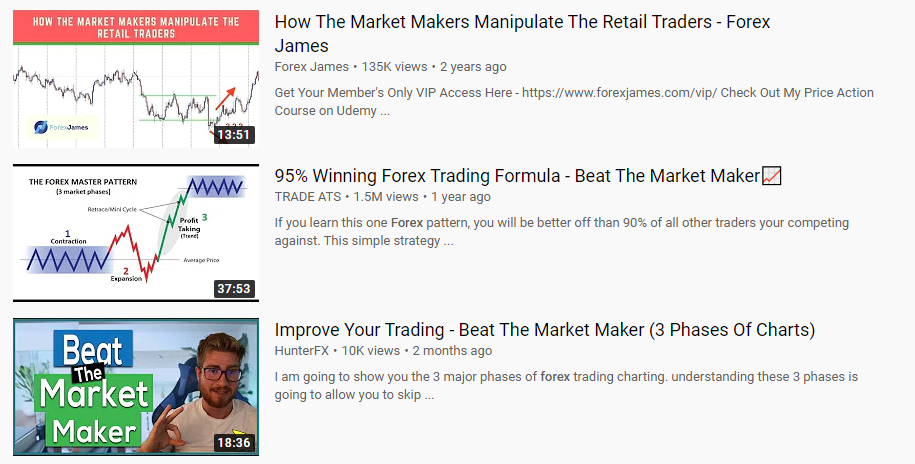
Every price action course will probably have supply and demand trading inside it, and there are millions of them.
If you think a million is a little bit stretched out, take a look at google search.
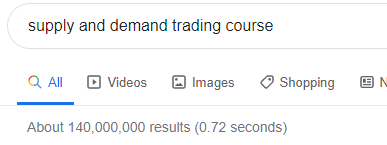
One hundred forty million search results are an imposing number in the trading sphere. It also beats results for Support and Resistance Trading, one of the most known trading concepts.
Why is that?
Simply because support and resistance are hard to sell as everyone thinks they already know it.
Because price action trading is relatively simple and easy to sell, the amount of subscription-based groups offering signals or some form of education is over the top.
Obviously, as most people offering these groups are either not trading at all or using tiny accounts.
All they do is sell you the idea of massive market manipulation as they know where the big banks and institutions are placing trades and how you can follow these big players.
Does a 20-something-year-old who often hides behind an anonymous Twitter avatar or posting pictures on Instagram where he presents trading as an easy job you can do from your smartphone know-how “big banks and institutions manipulate the financial markets and how you can profit on that for just $99,99 a month?”
That is up to your common sense to decide.
As there are so many of these people, there is no reason to uncover every single little scam I see on social media daily.
That might be for some future articles.
What I will do instead is to shed some light on the most famous figures in supply and demand trading.
There are two reasons why I do this rather than jump into the whole strategy.
- Show you how money is really made in the trading space.
- Provide the needed amount of scepticism which you should have before learning any new concept that is presented as a holy grail in trading
Sam Seiden Supply and Demand Trading
If you have only a slight knowledge of supply and demand trading, you know Sam Seiden.
Sam Seiden is a well-known name in the trading industry, which is understandable as his FXstreet webinars from 2013 have around million youtube views combined.
I have seen some of his webinars, explaining supply and demand logically without too much nonsense.
I think you can learn a thing or two in his webinars as well.
So what is the problem here?
Not much besides Sam Seiden ripping thousands of his students for close to $670 million since 2014.
Yes, 670 million dollars for drawing boxes on the chart.

The story broke down on April 9th of 2020, on the forex factory.
I will spare you the details that you can read at forex factory thread, but Sam Saiden and his educational group charged for courses or took money from people as an investment over the last ten years.
During the years, they ripped primary older consumers, who lost their life savings.
Price is everything Supply and Demand Thread.
In April 2010, someone with the name redsword11 created a new forex factory thread.

Although the last post by redsword11 is from 2011, the thread is still active ten years later with over 1500 pages.

So what makes it so unique?
Price is everything is pretty much a Supply and Demand trading hub, I have spent a decent amount of time learning there myself as so many people used it as a free resource where they posted their own trades and different tips and tricks they use.
But with so much free resources, it’s just a matter of time when someone will show up and try to monetize it.
Here comes the read the market academy.
Made by IFMaynte, what started as another free thread quickly turned into one of the most expensive educational courses I have ever seen with a price tag of €24,997 for a one-year membership.

Why am I mentioning this?
As IFMaynte took and renamed all free resources from Price is everything thread, the famous Quasimodo setup was taken from Paracurves Over/Under.
I am not going to mention the price tag for the course as that is just crazy, but IFMaynte wasn’t the only one who did that.
Over the years, I have seen many people bragging about learning from the course priced at €25,000 and how secret trading recipes they can sell you.
The truth is, you can learn everything for free in the Price is everything thread.
This is just another example of taking something which started as a free genuine resource and trying to squeeze every dollar from it.
The perfect example of why you always should do your research before spending money on any course, especially one that costs 25k.
ICT and order block saga
Michael Huddlestone is commonly known as an Inner circle trader.
ICT took things to a whole new level in supply and demand trading when he stole everything and just renamed it.
This is a brilliant marketing idea for someone, such as ICT.
Who never shown single live trade, was exposed several times to many different things, blew every myfxbook account when he tried to prove he is profitable, and switch social media every month where he goes through several beefs and mental breakdowns every week to attract more attention to him.

But with all the proof of this guy being sketchy at best.
There is still a considerable cult that blindly follows this 50 something-year-old manchild.
Why is that?
Simply because genius idea ICT had to brand everything as market manipulation of “smart money” who spend their every single living minute to catch retail traders stop-losses.
And it worked perfectly.
Once I have seen ICT posting a tweet where he bragged, having over 10,000 students over the years.
Since his course cost $1500, this puts us to $15,000,000.
As the idea of “Beating the market makers” showed to be such a great marketing strategy, it didn’t take long until other people started profiting on it as well.
This usually drives ICT to start his social media rant, where he calls every out and challenges them on the trading competition.
This trading competition never happens due to some excuse, but it drives more eyes and customers in the end anyway.
To end this, funnily enough, ICTs methods are working, and you can make money trading it.
But no evil market makers are hunting your one lot positions day in, day out.
This article will not explain stop hunts and how orderflow dynamics work; this might be for another day.
But once you learn the supply and demand trading from this article, you will see how much nonsense ICT is selling to you.
Supply and Demand Free Trading Course
Do you know why markets are moving?
Forex, Cryptocurrencies, Futures, Stocks, Commodities, or any other market; they all have one thing in common.
They move due to the supply and demand trading dynamics.

What is Supply and demand trading?
Every market in the world, financial or not, is being moved by supply and demand.
Imagine a situation where Apple releases a new iPhone, but this time they will announce that there will be only 10,000 pieces available for sale.
What do you think is going to happen? As there is a limited supply, there will be a much higher demand for it.
Price is going to be driven by high demand for an item with a limited supply.
In this case, imagine that these phones start to sell at $1000, but as those who were able to buy them first start to resell them, they can ask for higher sellers’ prices.
Once price reaches the $10,000 mark for one iPhone, Apple comes out and announces they put another 200,000 pieces in the market.
There is a new supply entering a market, and demand will drop significantly.
Those who bought the iPhone for $10,000 will have a tough time selling it because there is much higher supply in the market.
Although this scenario is not likely to ever happen, I hope you can see how the price is driven by supply and demand.
Buyers (demand) and sellers (supply) are moving prices.
I am coming back to the Apple example.
In the real world, when they release a new iPhone, the supply is so ample that buyers and sellers are in balance, and prices don’t fluctuate.
When supply and demand are balanced in the financial markets, the markets balance and are ranging.
Once there is an imbalance between buyers (demand) and sellers (supply), we can see markets to trend.
- When demand exceeds supply, prices are going higher.
- When supply exceeds demand, prices are going lower.
Entering short trades at supply or entering long trades at demand offers the best trading opportunities.
It is simply because you are entering the areas with many resting orders from large participants.
And at the same time, you will have traders sitting offside trying to exit, which will add another fuel to the anticipated moves.
Demand (Buy) = Bullish as buyers exceed sellers. Demand is found at consolidation before the huge move up.
Supply (Sell) = Bearish as sellers exceed buyers. Supply is found at consolidation before the huge move down.
How supply and demand zones are created
As I just mentioned, the demand is consolidation before the market rallied, and supply is consolidation before the market dropped.
Don’t worry; I will explain these more in-depth later on.
But right now, I think it is important to understand the key fundamentals of why these levels exist.
I will do my best to explain these logically as possible without using manipulation, smart money, market makers, etc.
These are often used to dramatize these concepts to make you believe that you are joining some elite club and know more than the guy sitting next to you.
If you didn’t know by now, you as a retail trader, don’t impact the market.
Matter the fact most of you that are trading forex are not even trading at the real market, but that’s a topic for another time.
Those who really move the markets (Banks, funds, etc.) have more challenging times executing their positions than retail traders.
That is simply because they can’t post their size into the books for anyone to see.
They would get quickly front-run, and they also can’t just enter wherever they want due to the significant slippage.
Because of these two issues, they need to execute their positions in areas with enough liquidity (resting orders) to meet counter-party for their trades.
When price moves away from the supply or demand zone, large players cannot unload their whole positions at once.
This is why they have to stack their orders in those liquidity areas.
Young Tilopa explained this concept of order-stacking in a Youtube video.
But the stacked orders are not the only reason why these zones work.

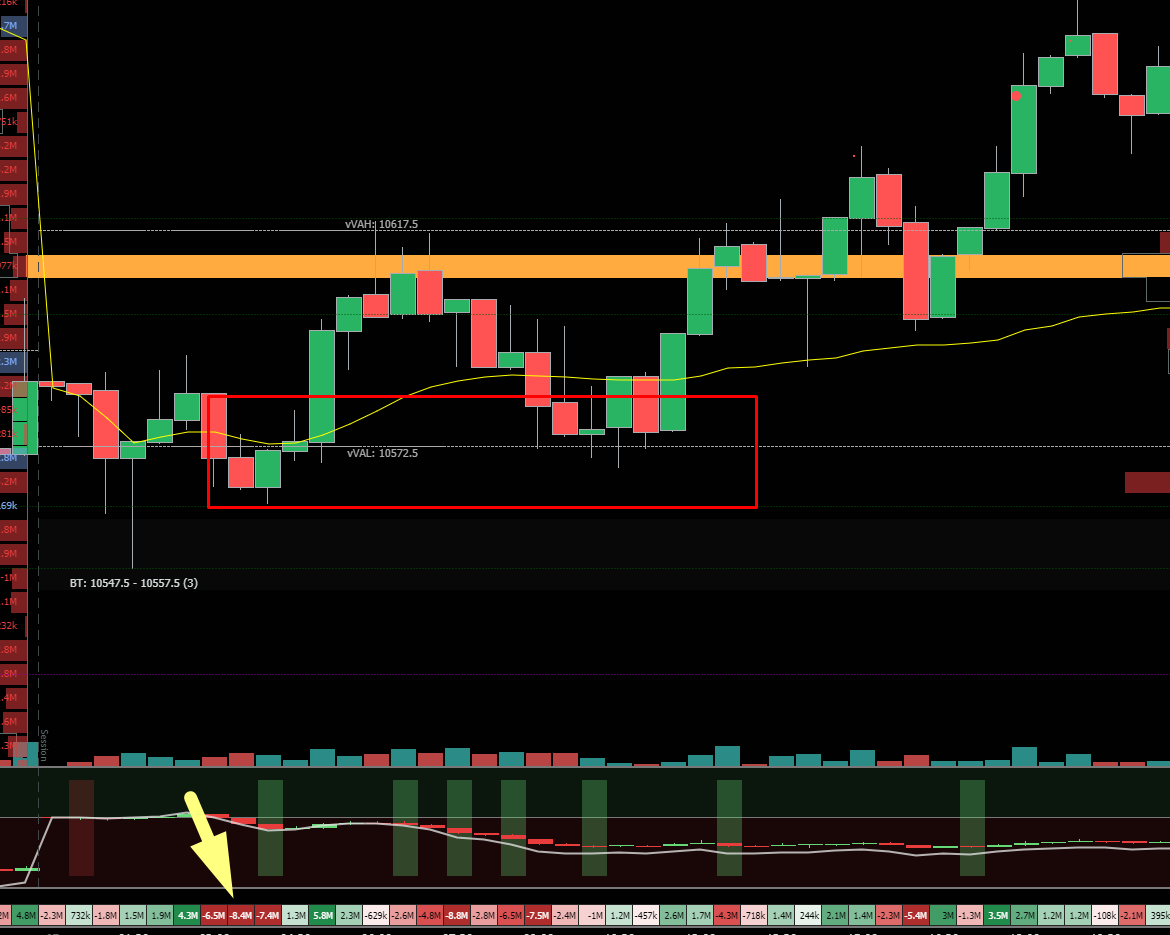
This is the same chart as one posted above, but with a little bit more information.
At the bottom of the chart, we have a delta for each bar.
Delta is the difference between finalized executions on the bid and offer.
In other words, it shows the difference in Market orders that were executed.
For example, if you have 50 deltas on the bid and the 20 deltas on offer, the final delta will be 30.
I have touched on Delta more in my Footprint Charts article.
If you want to learn how to utilize Delta with a real trading strategy, check out my Trading Blueprint.

Once we zoom in on the delta, we can see that the big down candle had a negative 7.5m delta, and more importantly, the up candles before had over 1.5m positive delta.
This means that before the sharp sell-off, there was an over 1.5m in buying, which now sits underwater.
Once price revisits the supply zones, those buyers start to exit their long positions at break-even or slight loss.
This will eventually add more pressure to the downside as they will turn their longs into shorts.
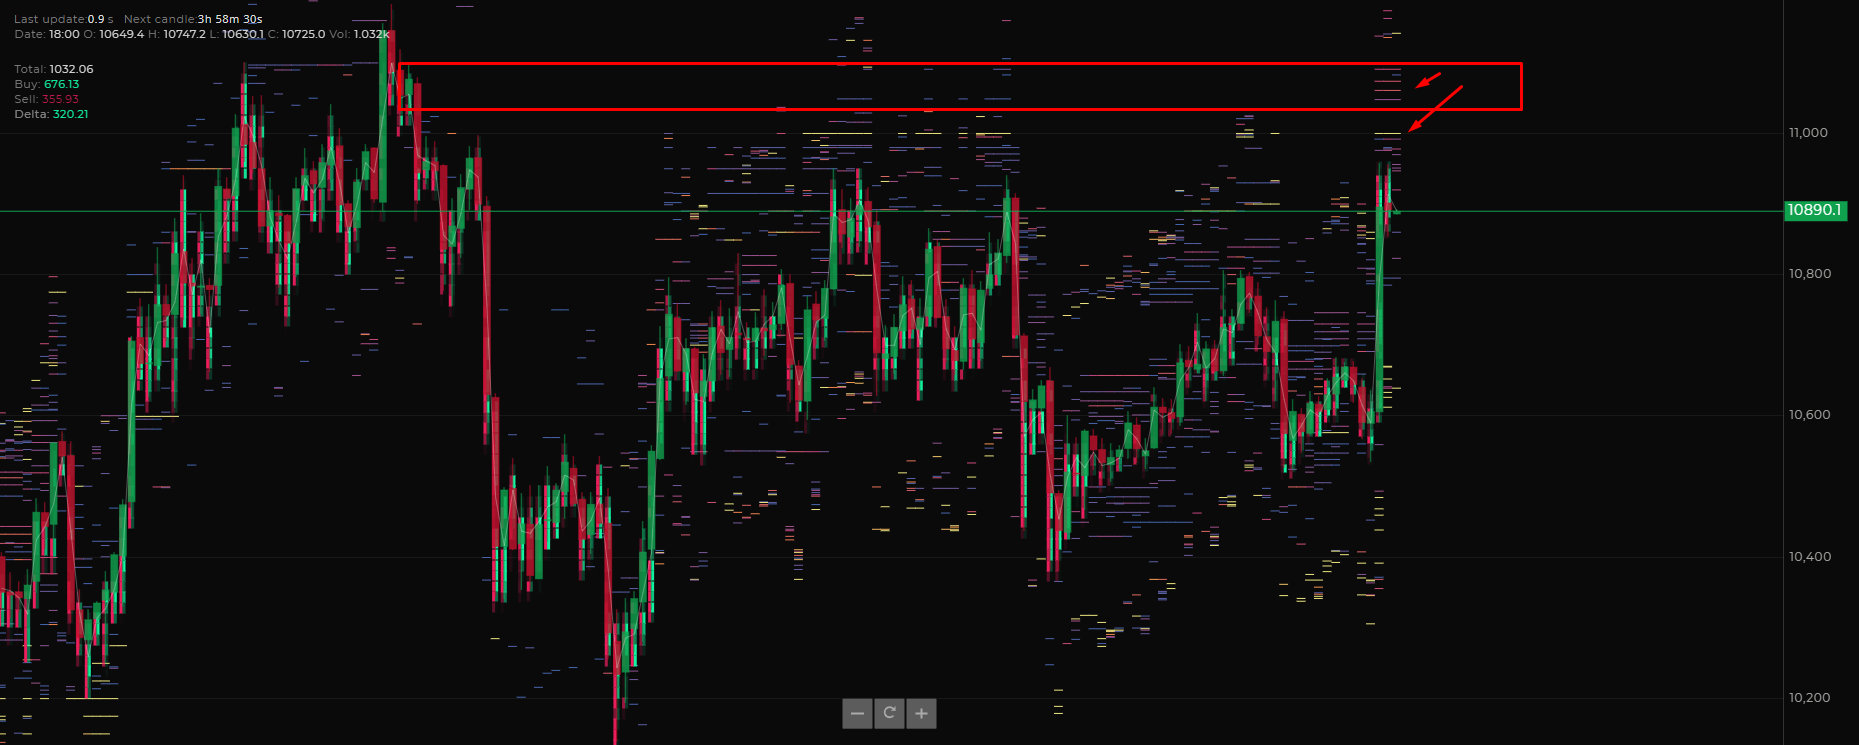
Yet another example right here on Bitcoin.
Before the move up, we had over 20m negative delta.
These shorts will be getting out and turning their shorts to longs once the price revisits the demand zone.
Adding the stacked buy orders already waiting at the zone, this will result in the upside movement.
To sum things up, there are two reasons why supply and demand zones work.
- Stacked orders
- Underwater traders exiting at the break-even
Does this work out all the time?
Not really.
Matter the fact. I would say supply and demand zones traded solely with candlestick chart as many people do and teach is a very mediocre strategy at its best.
In other words, by buying every demand zone and selling every supply zone, you will end up with poor trading results.

If you are watching orderflow in your trading, I highly recommend watching delta for different candles.
If you are trading only price action, some other rules can be implemented.
Before we move any further, I want to point out a good video by Bitdealer, which I have seen a few months back.
An hour and a half long presentation explain a lot of similar things you will learn in this article, so if you are interested in supply and demand trading, make sure to give it a watch.
Trading Support and Resistance vs Supply and Demand
There is a lot of price action concepts that traders use when they want to find tradeable levels.
Support and Resistance with Supply and Demand are the most popular.
So why is trading Supply and Demand can be chosen over Support and Resistance?
Because it is less subjective.
When you are trading support and resistance, are you using candlestick bodies, wicks, or something in between?
Does it ever happen to you in the past that you tried to mark out the support and resistance area but wasn’t sure how to precisely mark it out?
Because supply and demand zones are much more rule-based and less subjective, you will less likely get it wrong.

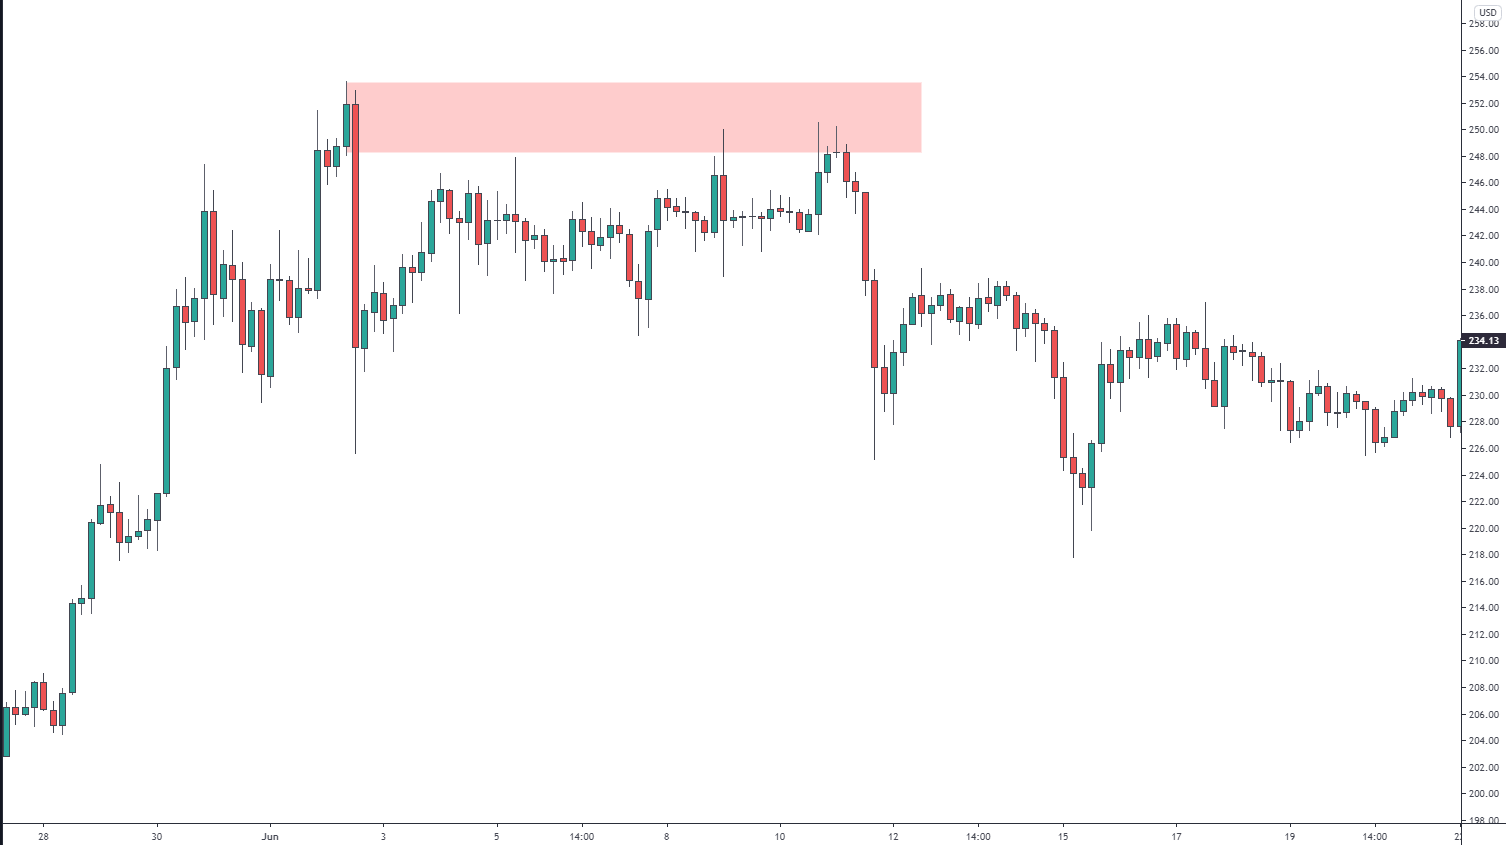
As you can notice on this chart, we have three levels that could be considered a resistance area.
Which one is the best?
The highest high on A?
The middle line on B?
Or the lowest point on C?
This subjectivity with support and resistance trading will lead to a lot of panic and failed trades.
But what is one of the things that support and resistance traders didn’t notice?
Supply area above the level.

It doesn’t matter if you would pick a) b) or c).
The market eventually probed all these levels into the supply zone.
As you can see in the chart above, there is an apparent resistance to the left.
This is a heatmap chart that displays resting orders.
Where are these orders resting? Above key resistance and below key support.
It is simply because there is enough liquidity to fill these prices, not only from traders wanting to get short but also those that are already short and will be stopping out of their positions if the price goes there.
More often than not, above these key support and resistance levels, you will have a supply and demand zone which wasn’t tested before.
If you are a support and resistance trader and you are trading those levels from the same side, i.e. buying previous support or selling previous resistance, I highly recommend anticipating those false breakouts first.
There is nothing false about them, and the market is just reaching to grab enough resting orders (liquidity) to fuel the move.
How to identify Supply and Demand Zones in your Trading
Finding a good Supply or Demand Zone isn’t that complicated.
First things first you want to look at the chart and find out the areas where the market rapidly moves either up or down.

As you can see, the price went up in this case, and this is why we are looking for a Demand Zone.

In this case, the market went down; this is why we are looking for Supply Zone.
Once we define the fast move, we are looking to the left to define base.
The base is basically the zone where the market traded sideways before the sharp move.
The base is important because large players accumulated their orders and created an imbalance between supply and demand.

In the picture above, we can see a Demand Zone.
The demand zone is defined by down candle/consolidation before the impulse move to the upside.
You want to see a large green candle leaving this consolidation, after that you mark out last down move before the rally.

The picture above shows Supply Zone.
The supply zone is defined by up candle/consolidation before the impulse move to the downside.
You want to see a large red candle leaving this consolidation, after that you mark out last up move before the drop.
Those supply and demand zones are only valid if the move was significant enough to break the market structure.

How to mark out Supply and Demand Zones
Once supply and demand zones are defined, we want to mark them out.
You can use a simple drawing line or famous rectangle tool to mark the clusters before the impulse move.
Demand Zone: Mark out the down move, including wicks, before breakout with a horizontal box.
Demand zones are marked out below price.
Supply Zone: Mark out the up move including wicks, before the breakdown with a horizontal box.
Supply zones are marked out above price.
You want to cover the whole area, including bottom and upper wicks, not only bodies.

Here is the example of the demand zone from previous pictures.
You can see we marked out the top and bottom of the last down candle before the impulse as our Demand zone.

The same goes for a supply zone.
We marked out last up the candle, including wicks as our supply zone.
Tested vs Fresh Supply and Demand Zones – Trading a First Time Back
When choosing a Supply or Demand Zone where we want to execute our trade, one of the most important things is to pick a fresh, untested zone.
Why?
Every touch of Supply or Demand zone consumes orders.
That gives less and less probability of reaction once the price revisits for the second, third, or fourth time.
This is a common mistake amongst traders who trade support and resistance as they think the more touches of the level mean the bigger strength of the level.
The opposite is true, and once all orders have been consumed from the zone, the price will breakthrough.
This is why it is preferable to trade the first time back (FTB) to the Supply or Demand zone.
Trading a second or third touch is also possible, but it should be view as a whole different trade when you are only entering once the liquidity above the previous test is consumed.

To recap what we know so far.
On the left, there is a cluster where supply overcomes demand and price had a strong breakdown.
The supply zone is marked as last up a candle before the breakdown from bottom to top.
After that, the market traded a First time back to the level because that gives us the highest probability trade.

There is also a demand zone at the bottom.
As you can notice the biggest rally was offered after the first time back.
All though it took a while for the market to rally, it is mostly because the market opened after the weekend.
You can also see that other tests also provided trading opportunities, but bounces were not that strong.
That is simply because fewer orders were resting at the level.
An alternative way to see Supply and Demand Zones
Another way to look at Supply and Demand Zones is looking for three price movements at once while identifying the zone.
We have two possible scenarios.
Continuation Patterns which are Rally-Base-Rally and Drop-Base-Drop
Reversal patterns Rally-Base-Drop and Drop-Base-Rally

Price Action vs Level Entry
When trading a supply and demand zones, one question that comes to mind is if you should place a limit order at the level or wait for a reaction first and then use a market order.
This is mostly up to your personal preference.
Of course, when you place a limit order at the level, there is a higher chance that the market will trade straight through it.
On the other hand, using a limit order often offers a higher risk to reward ratio as you get a more favourable entry.

A great example of this can be seen in the chart above, where price action entry gives us only 2,5 Risk to reward ratio compared to limit order entry, which offered 6 Risk to reward ratio.
So what is the conclusion of this?
Using a price action entry can save you from some losses but in the long run, entering with a limit order is better.
You are getting the best entry possible, and also it requires zero trade management compared to waiting for confirmation.
Broken Supply and Demand
As I already mentioned, Supply or Demand zones get tested multiple times. They are likely to breakthrough.
If the market break supply, we know that buyers have taken control.
If the market break demand, we know that sellers have taken control.
Once the zone is broken, it is very likely to switch its role.
Supply become Demand or Demand become Supply. This is also called a broken base.
If the level is broken, we look to buy/sell from the broken base when the price comes to visit.


Supply and Demand Trading Setup – Failure to Return – FTR
In my opinion, this is the most important and best thing you can get from learning how to trade supply and demand.
FTR is a concept that came from the Price is Everything thread if I remember correctly.
I don’t even remember how exactly it was presented there. This is just my pure interpretation of it.
Failure to return happens when the market breaks structural support or resistance.
You will notice that there is quite often a down move before the resistance is broken or up to move before support is broken.
This gives an extra amount of confluence to the idea of order-stacking and trapped traders anticipating return above support or below resistance.
That is how the name Failure to return was made.
These work exceptionally well once they break key structural levels.
I also trade this FTRs intra-day, where I look for breakouts out of balance from either daily or composite values.
More about those in the Trading Blueprint.


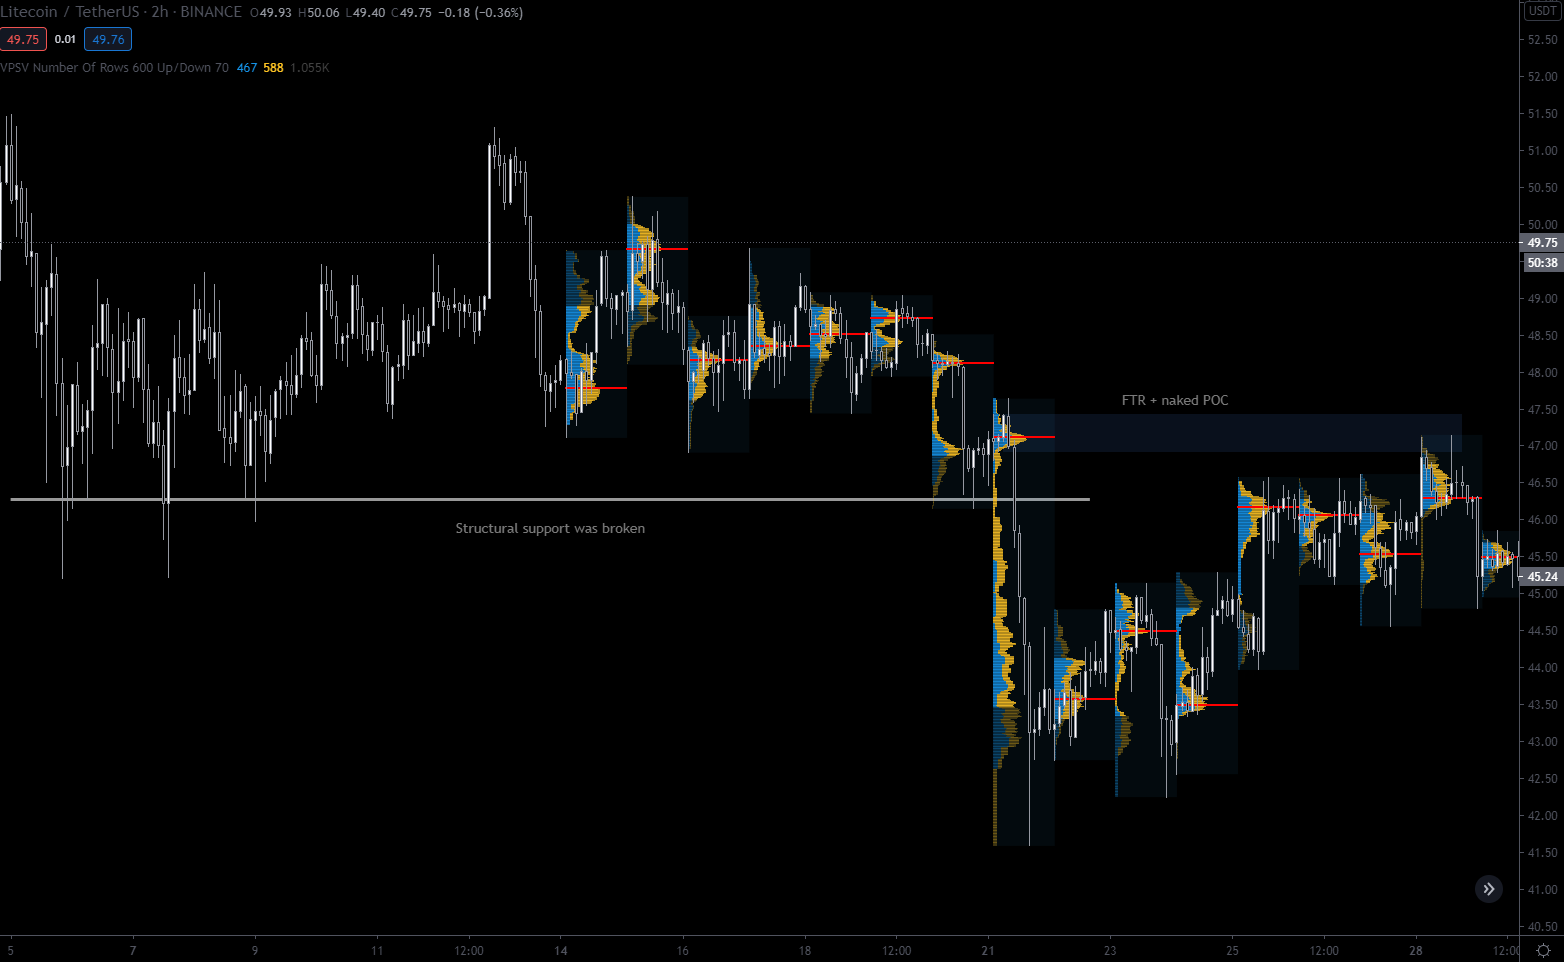
Supply and Demand Trading with Volume Profile
If you want to move things a little bit further than trading simple price action, I recommend implementing a volume profile in your trading.
I put a large emphasis on supply and demand zones with untested Points of control.
Why? Simply because the untested point of control is level with the most trade volume, i.e., the most action happened there in the past, so it is likely to happen again.
There are many more reasons to implement the Volume profile in your trading, and I plan to talk about that in the future articles. Still, the untested (naked) points of control are excellent levels that can provide support or resistance.
Before you enter Supply And Demand Trade
Before you enter any trade based on supply and demand, you can ask yourself a few good questions.
How did the price leave the Supply/Demand Zone?
The stronger move away from the zone, the more orders are likely left to the origin of the imbalance; therefore, there is a higher probability for the level to give a good reaction.
How much time did the price spend after it left the Supply/Demand Zone?
After the impulse move, we want the market to accept new prices.
The longer the time market takes to retest of the Supply/Demand zone, the higher probability it will work.
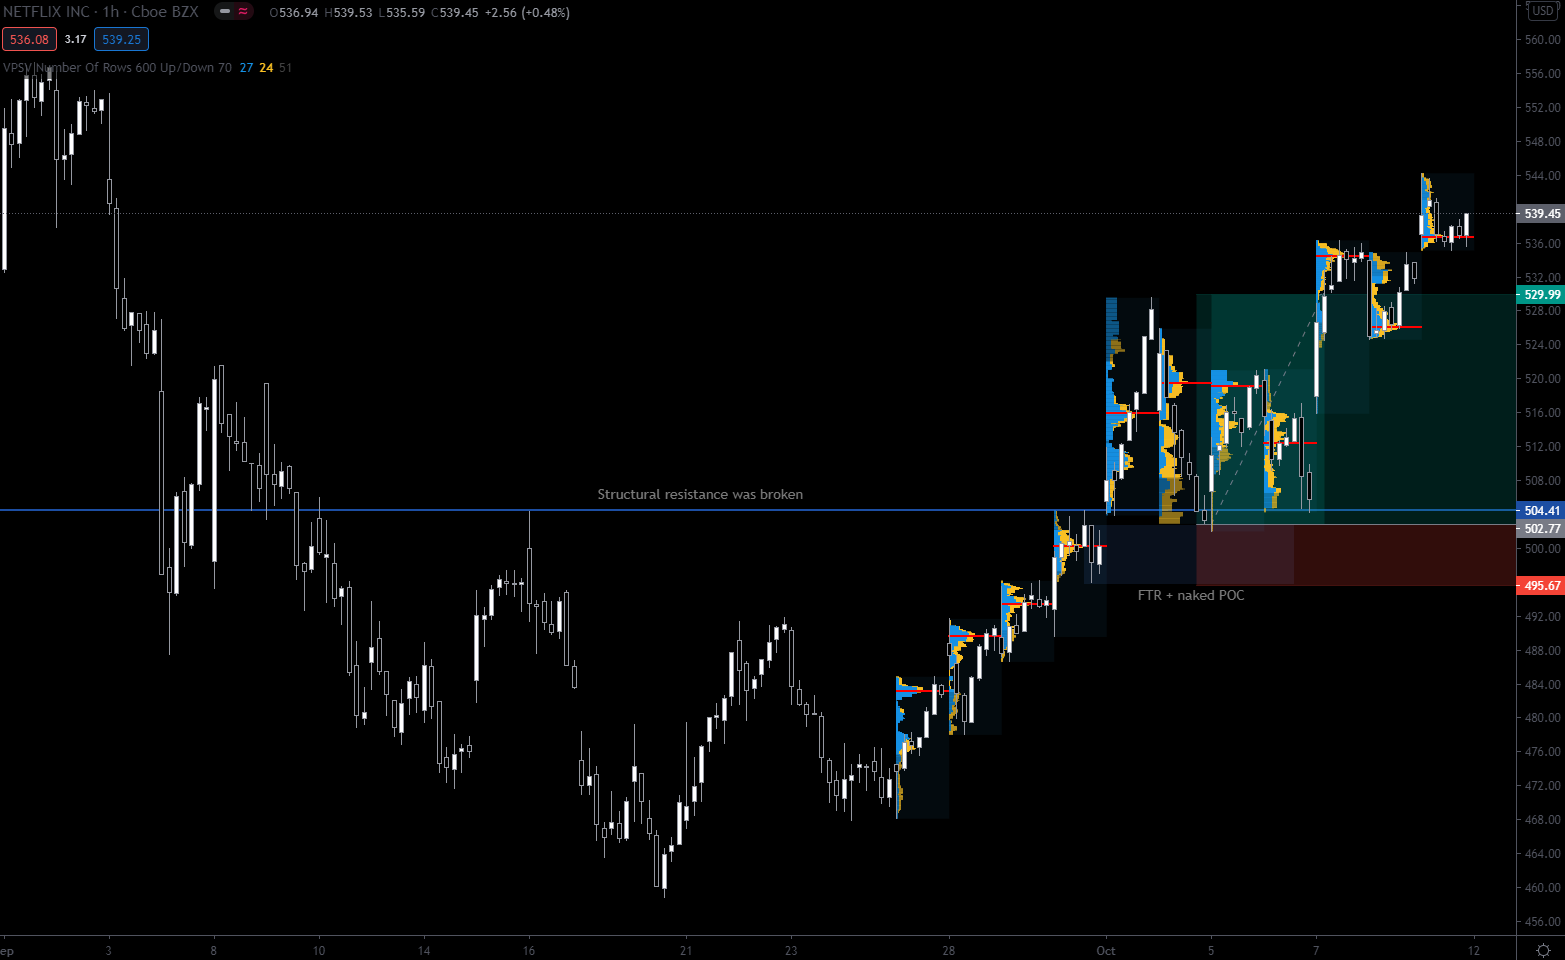
Did the price broke out the key support/resistance area, and we have an FTR with nVPOC structure now?
Already explained in the FTR and naked Point of the control section.
If you observe and trade those, you will find high R: R trades with an even higher win % rate!
In Conclusion
Supply and demand trading is a good and simple price action strategy that many people complicated over the years to make a profit off it.
I hope I could explain it logically, so every time someone will try to sell you some secret smart money trading technique, you will know better.
abc
S/D is equally subjective as s/r. Its just a bigger box so allows more room for error. Also what was obviously the right thing to do is clearly noticeable in hindsight whereas when doing it live for some or other reason it didnt go so well. Even if it went well a few times its basically trading mean reversion which will have negative expectancy over long run.
Adam
Thanks for the comment! Id say that every price action concept is subjective as traders do not watch the orderflow or volume distribution in different areas. That’s why I like to implement these concepts besides trading price action.
XYZ
Bollocks ABC. If it didn’t go well live, that’s your problem. That mean reversion stuff is also bollocks.
Marlonjpñ
Excellent page and excellent articles. In my opinion. If people knew how the crossing of orders works in a market, a fundamental condition for reaching an agreement, they would understand that an institution or large capital needs zones or price ranges to be able to participate and enter all its orders. These areas are characterized by being areas with high trading volumes. An institution to achieve its objective must work with both types of orders, limited and market. You could never enter all your capital with market orders since it would move the price abruptly, being counterproductive to your interests. This is why professional capital must work in trading ranges. Forcing the price to stay waxed until entering your orders. Once all your capital is in, it will stimulate the price in the direction of your interests, filling all the way with limit orders that will be taken by those who are late to the party. Once the price returns to the institutional zone. This zone will be defended aggressively and that is why we see quite aggressive market turns. These areas obviously correspond to areas of professional volume, areas that are also called supply and demand areas, areas of balance. When using advanced tools such as the footprint, you can see in detail the passive action (limit orders) to stop the price and then the aggressive action (market orders) by the professional, involving large trading volumes to stop and turn the price. price. Also by analyzing the bookmap you can see the passive action planned by the professionals (obviously hidden in many cases) but when they are executed they reveal their presence.
M
Well explained
jay
what a lovely article found it shared on a discord thanks for writing such a beauty
Collins
Bookmarked the page for my daily reading. Love your work. im an order flow trader and i keep learning and improving. Thanks alot
Patrick
One of the best articles I’ve ever read on supply and demand. Thanks!
Testovito
The demand zone, it can be recognized by limit orders or can it be a market?
On the example (iPhone), is it possible to recognize the increased demand or offer to the price movement?
Entrance in the second and third time after FTB, (liquidity spending) can be determined by volumes, limit orders or?
Thx )
Elisa
Really excellent article that explains the basic of supply and demand beautifully. And thank you for including the charts/explanation on FTR – I’ve seen it talked about before but it never really clicked in my mind until now. Thank you!!
JOE
Great read thanks 🙂
Jan
Excellent read! Thank you Adam