
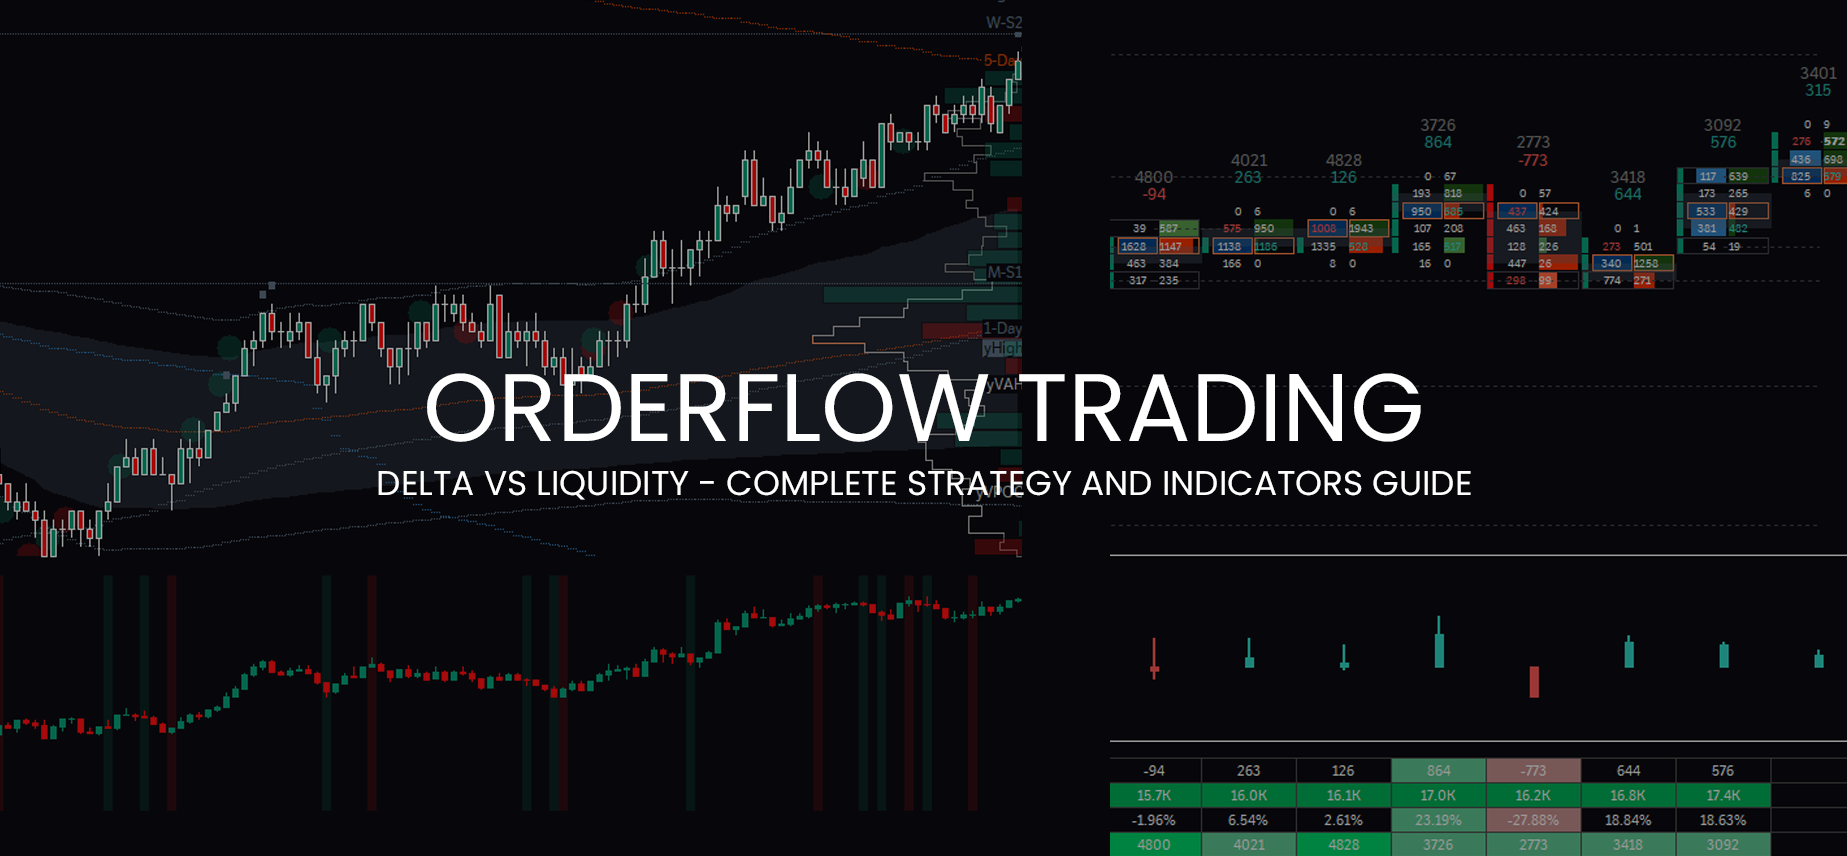
Orderflow Trading: Delta vs Liquidity – Complete Strategy and Indicators Guide
Orderflow trading can be intimidating at first.
Thanks to many different tools such as Depth of market, Times and sales, footprint charts, or heatmaps, things might look very complicated for newer traders.
This article will break down the orderflow trading in a simple way, so things will look much easier once we are done.
Once I cover the basics, I will focus on the aggressive orderflow, also known as market orders, as they play much more significance in what is going on in the markets.
If you like this article, read the rest of the blog or join the Tradingriot Bootcamp for a comprehensive video course.
You can either read the article or watch the video version below.
Table of Contents
Is Orderflow trading just a buzzword?
Orderflow trading is often sold as a “secret to the market” and the way you can trade like “professionals.”
This is why all these people teaching orderflow trading online sell courses that start at around a $1,000 price tag.
If you have even the slightest knowledge of how the trading industry works, there is no reason telling you that you don’t need to pay someone $1,000 to learn these things.
Although you might learn something interesting in those courses, the fact that these people try to sell you the hidden truth (which doesn’t exist) makes it not worth the money and time.
Especially since the orderflow trading is very easy once you learn the basics.
So why is orderflow important, and why should you care?
It is simply because the orderflow shows us what is going on in the market.
It breaks down the auction process and gives us pure information about what market participants are doing.
I use the orderflow because it breaks down trading logically and shows what is going on.
This is something you won’t get if you use technical indicators such as RSI or moving averages.
Even though there are situations where these indicators work, traders that are using them only base their decisions on what indicators are showing them without any deep understanding of the market.
Because you are making decisions based on what is going on in the market, you will get much more confidence in your trading with enough screentime as some orderflow patterns repeat repeatedly.
What is Orderflow in trading
As I already covered in the Auction Market Theory article, the trading DOM (Depth Of Market) is the rawest form of the price you can see.
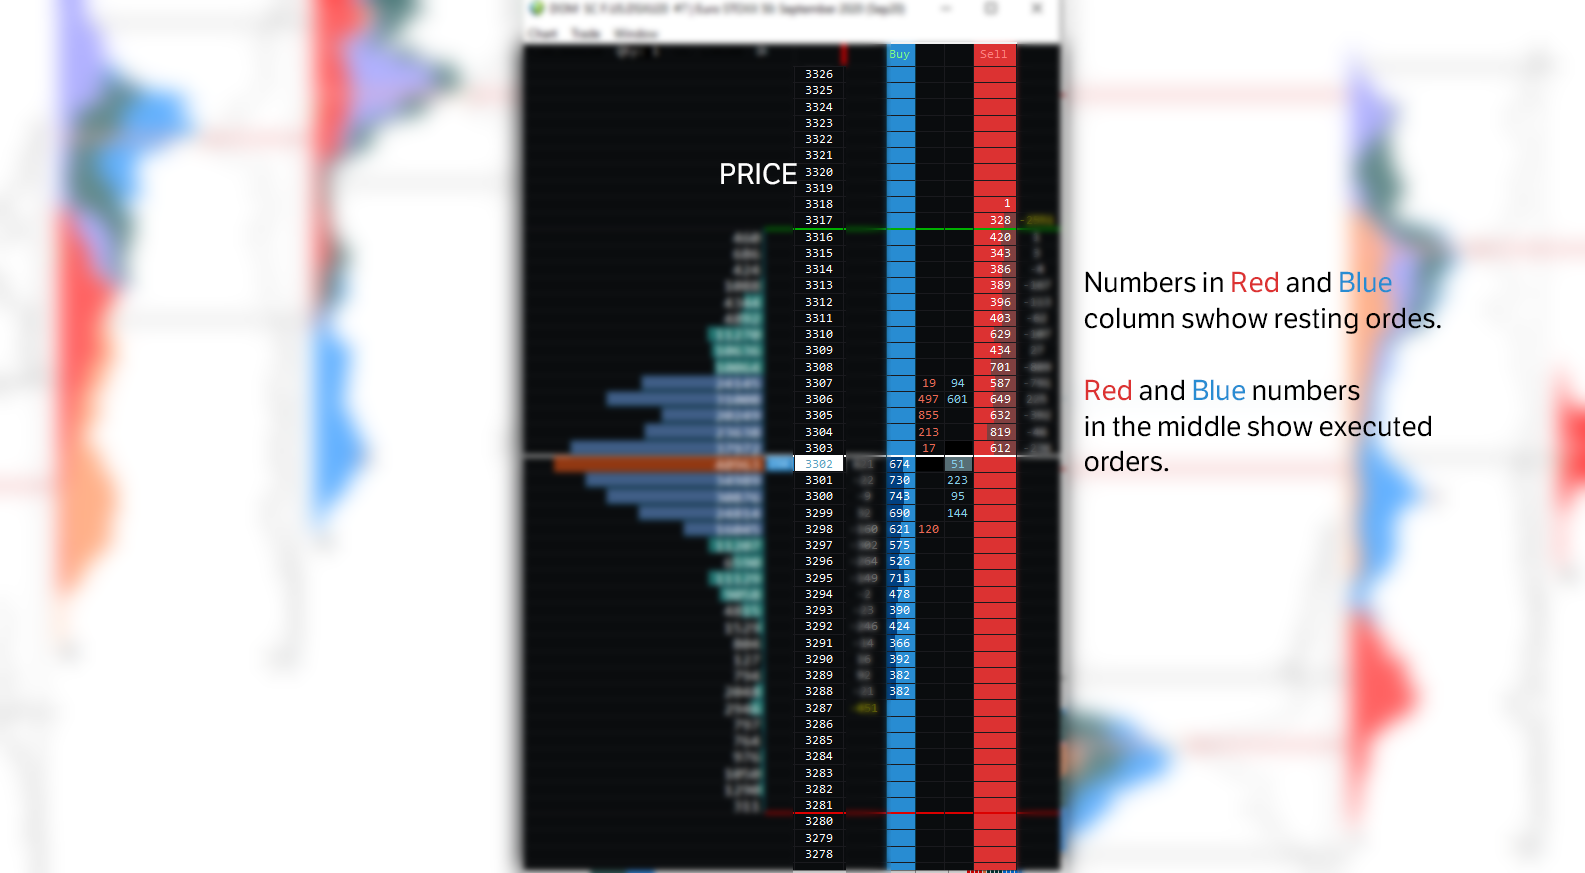
In this trading DOM, you have highlighted three things.
First is the price on the far left.
In blue and red columns you can see resting orders, also called passive orderflow or liquidity.
Limit Orders
Limit orders are often the heavier hand in the market as larger players typically use them to prevent slippage.
If you are using a limit order, you are a liquidity maker as you put liquidity to the order book.
Everyone can place a limit order into the order book and advertise the prices for which he/she is willing to buy/sell. But until the order is executed, It does not mean anything.
Market Orders
The red and blue numbers in the middle show us the executions on the bid and the offer.
These are the finalized orders at the bid and ask, also called delta.
Delta is the difference between finalized executions at the bid and the offer.
Market orders are often the weaker hand in the market.
Market orders are required for markets to move.
What makes markets tick
You often hear that markets either trend or are in range.
But why is that?
There are three factors that affect market movements, liquidity, volume, and volatility.
Volume
Compared to delta which displays differences between orders executed at bid and offer.
Volume represents the total number of contracts traded.
Here is the little quiz for you.
If you look at the Bid/Ask Footprint that shows 27 contracts hit the bid and 189 lift the offer, what is the value of Delta and Volume?
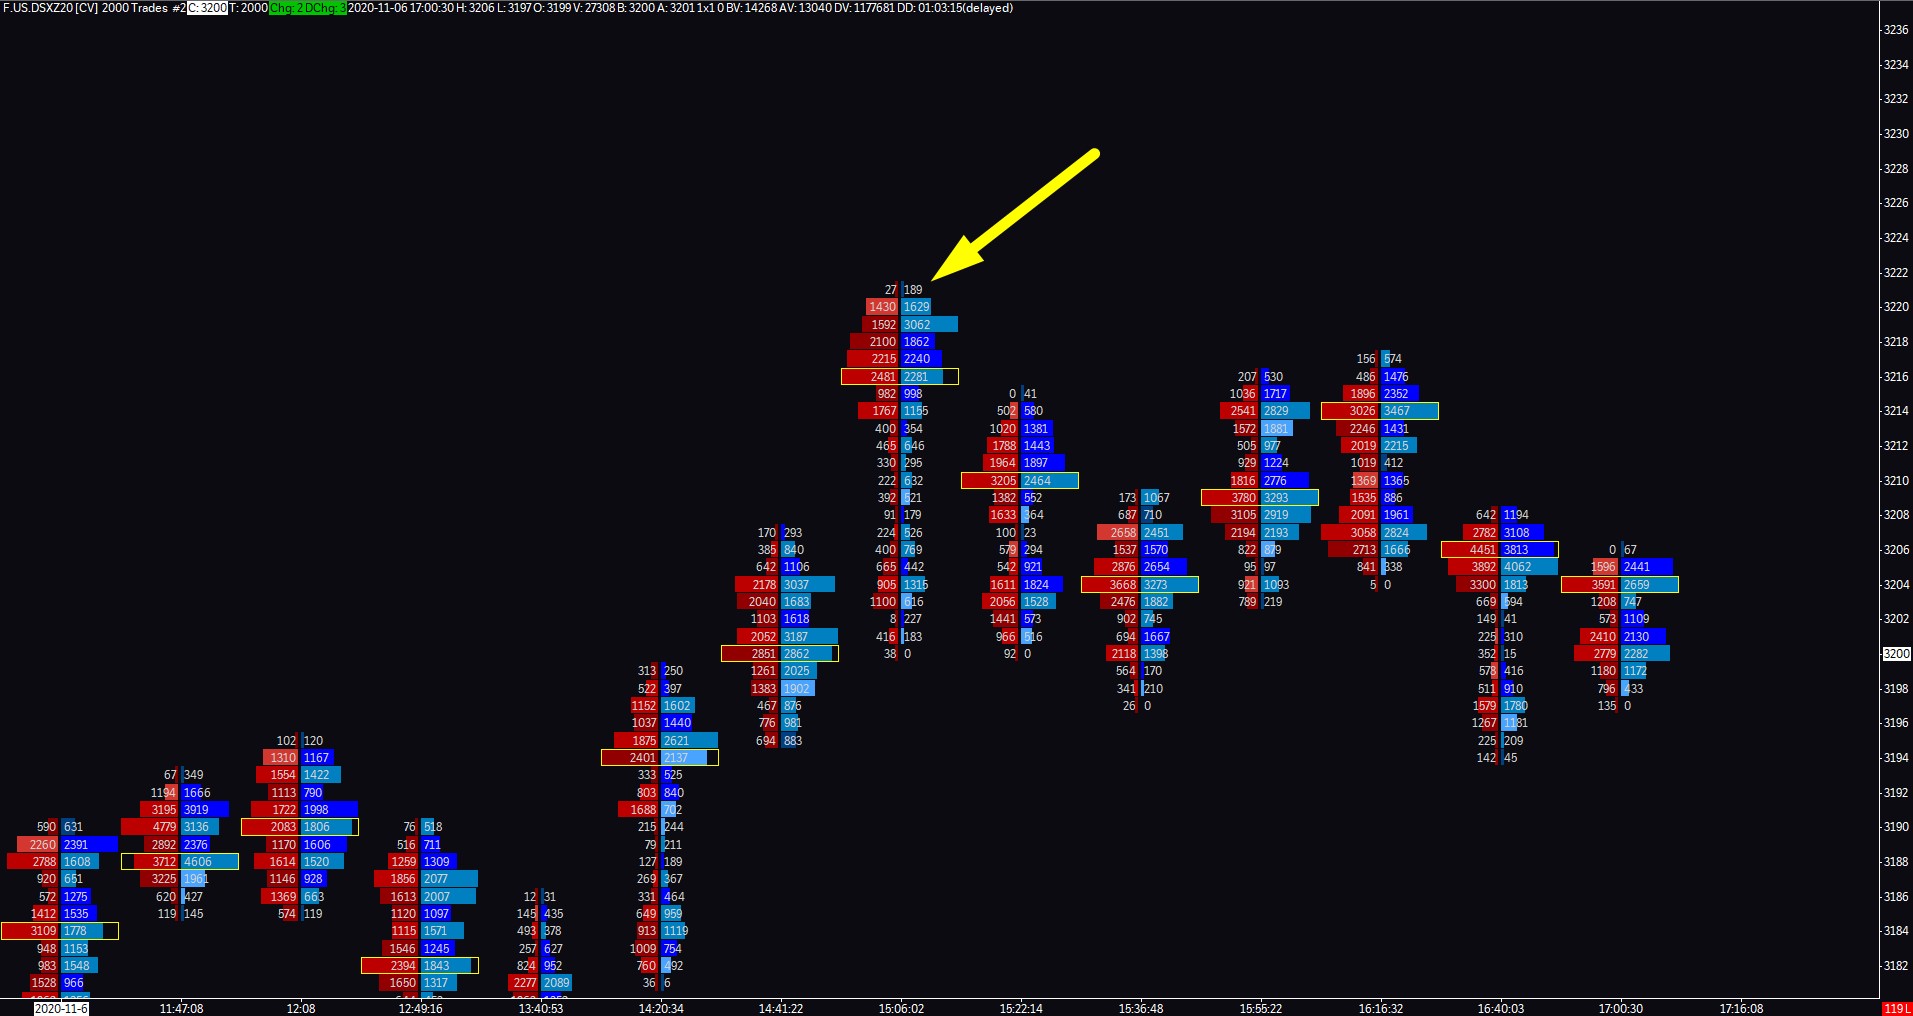
If you are seeing this for the first time and have no idea what the answer if you should go read the Footprint Charts article.
Anyway, those who guessed Delta of 162 and 216 Volume are correct.
It is simply because 189 contracts bought and 27 sold, that gives you 162 (189-27) and the total number of the traded contract was 216 (189+27).
High volumes in the market mean that you have a high number of finalized orders therefore markets are moving.
Liquidity
As I already mentioned, liquidity represents resting orders in the order book.
They are the advertisement on the market.
Each market has different liquidity, you might hear the term thin and thick markets.
Thick markets such as bonds are very liquid which means that they are moving slower compared to thin markets such as cryptocurrency or some index futures.
You can see them in the DOM or heatmap charts.
Why liquidity can be misleading
A lot of traders tend to use these heatmaps in their analysis and decision making as watching where the big players place their orders.
There is one significant problem with that.
As these orders can be placed in a matter of seconds, they can be pulled at the same speed.
Think about it, why would anyone who is trading significant size, want you to see their orders?
Large traders prefer to use hidden orders in form of an Iceberg order instead of placing a large size at one level.
Iceberg orders are large single orders that are split into small limit orders.
The purpose of the Iceberg order is to hide the actual order quantity.
So why are these large orders seen on heatmaps and DOMs?
First of all, there are cases when these are genuine orders, but more often than not they are spoof orders.
Spoofing is an illegal form of market manipulation in which traders place a large order to buy or sell, with no intention of executing.
By doing so, the traders create a false impression of the high demand for the asset.
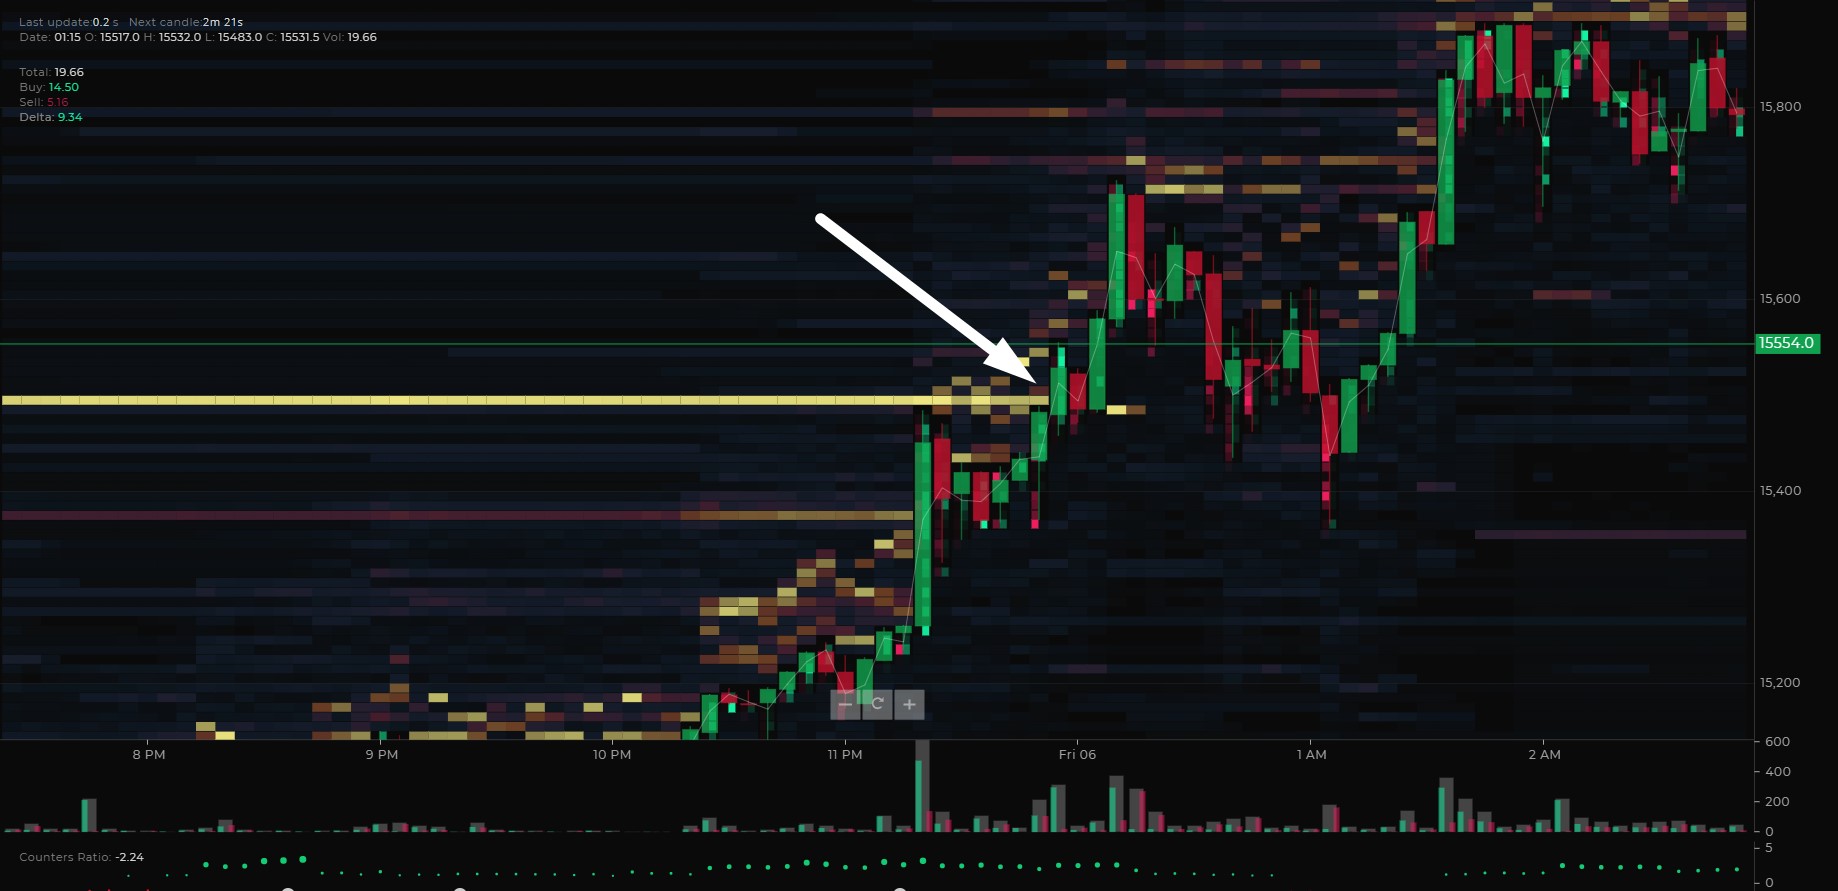
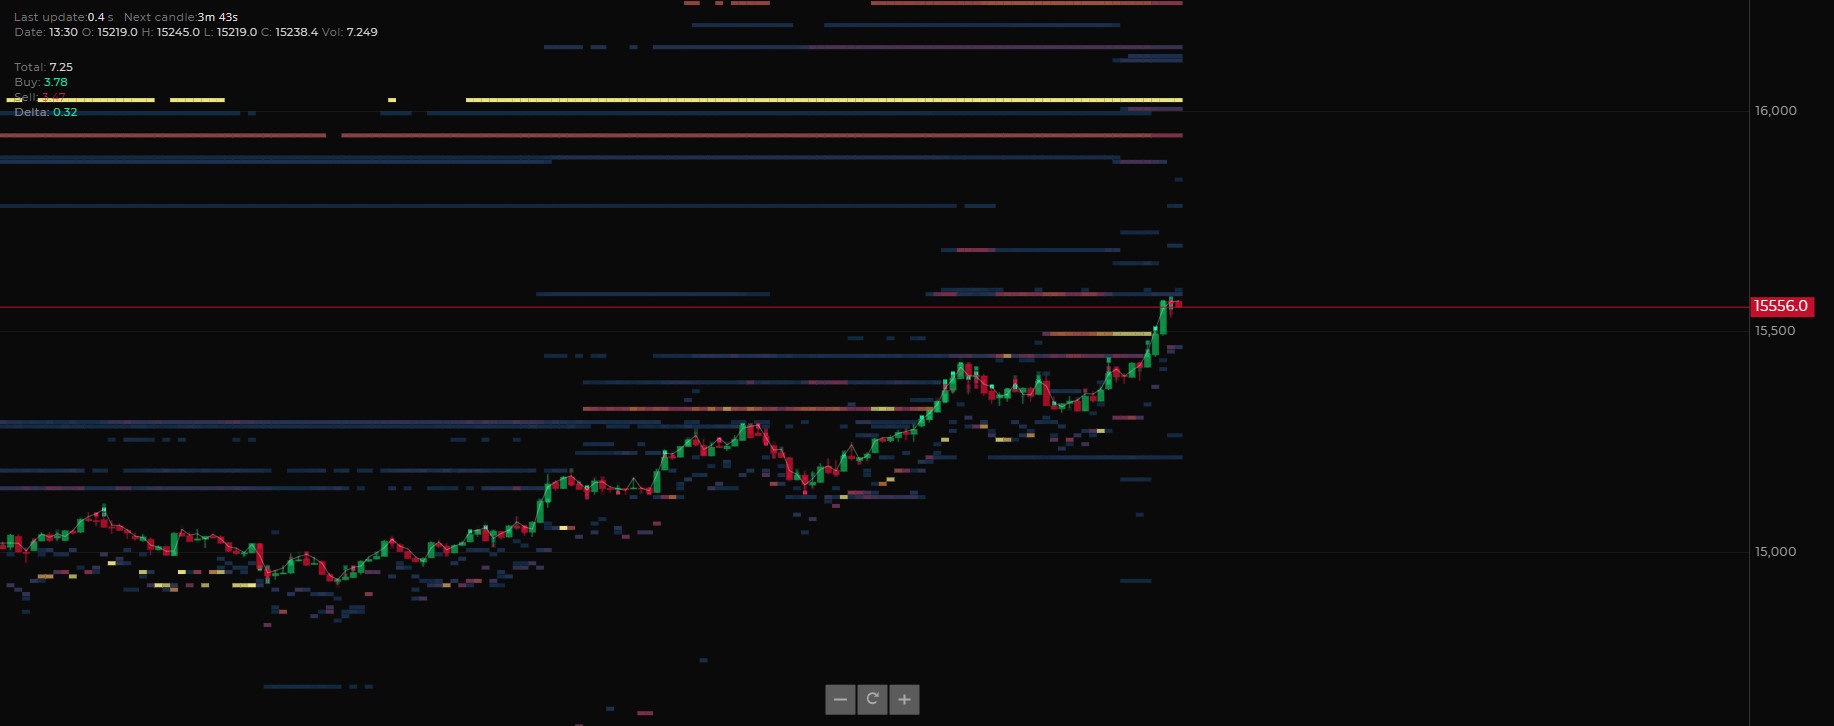
Looking at the example here you can see a large sell order (yellow line) disappear as price broke through it.
A lot of traders see this simply as someone pulled the order or that just buyers were more aggressive than sellers.
But more often than not there is something much more going on.
As you can see before the price broke above it paused and consolidate below the level with a large order.
This is a very common cause, as a lot of traders see these large orders and try to front-run them.
What they don’t know is that the seller who advertised the large sell order above is sitting on the bid and absorbing all their sell orders so he can build his buy order.
Once sellers are exhausted, he simply pulls his limit sell order and the price can easily go higher with his newly build buy position.
The key takeaway from this is that these levels are still important as they bring an interest of those that are trading with a much bigger size than you and me.
But there is much more depth than just selling or buying were big size is resting.
These levels are going to play some role in the market, but if you see the market turning ahead of a large order, make sure to take a look at another side if someone is not silently buying all these shorts and vice versa.
Volatility
Volatility measures the relationship between volume and liquidity.
You might hear that markets are volatile or not volatile but why this happens?
There are three different scenarios we can have in the market.
- High Volume + High Liquidity = Moderate Volatility which is same as Low Volume + Low Liquidity = Moderate Volatility
- Low Volume + High Liquidity = Low Volatility
- High Volume + Low Liquidity = High Volatility
Delta in Orderflow Trading
So now that you know why markets are moving and how liquidity works, we can proceed to something which is in my opinion the most useful thing in orderflow trading, delta.
As I already mentioned, Delta represents the difference between finalized orders at bid and offer.
Why I find delta (market orders) more useful compared to liquidity (limit orders) is simply because delta shows us the real orders that were executed in the market.
Compared to limit orders, they are just an advertisement and can be placed in the books to confuse and mislead traders, but once an order goes through, there is no turning back.
Different usage of the delta as an indicator
There are several ways how to interpret delta in your chart.
You can use cumulative volume delta to spot divergences, look at delta on footprint chart or plot it vertically on volume profile.
Let’s have a look at all of these options.
Cumulative volume delta
Cumulative volume delta plots an indicator that shows us a running total of finalized executions at the bid and ask.
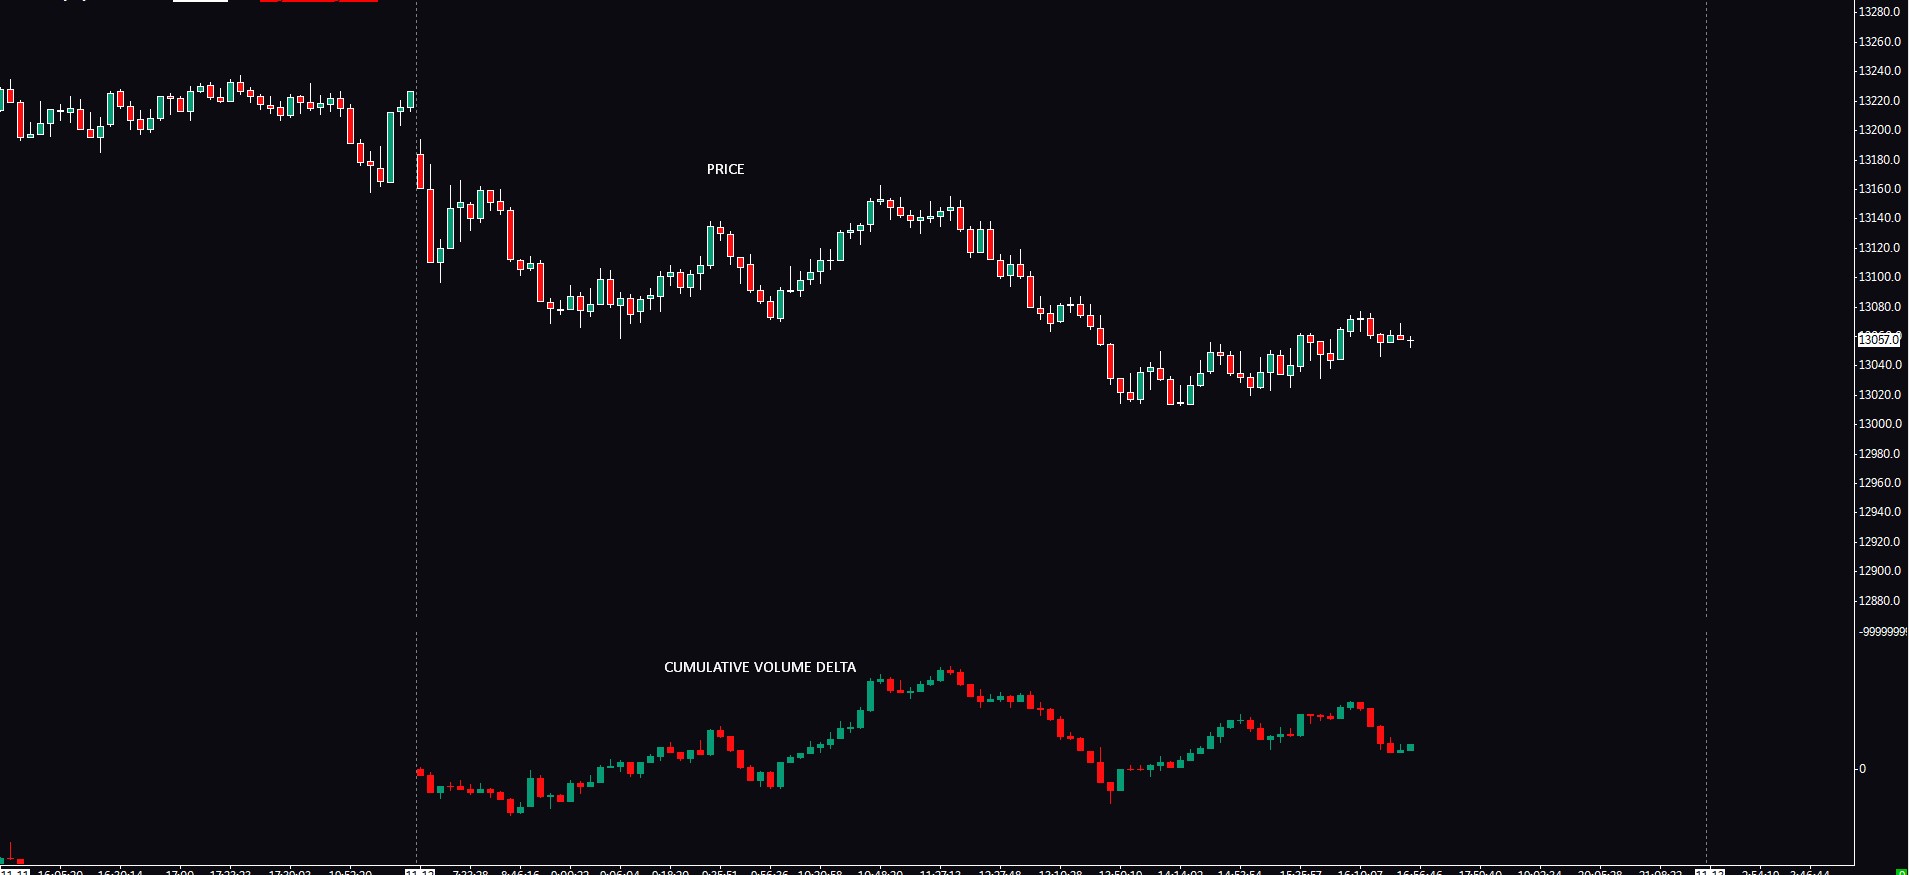
Compared to classical indicators such as RSI, cumulative volume delta doesn’t give us overbought/oversold levels, but it shows us where the heavier hand is in the market.
In healthy trends, you want CVD and price go hand in hand.
Once there is a discrepancy between cumulative volume delta and price, you can spot potential trading opportunities.
Cumulative Volume Delta – Regular divergence
There are two types of situations you can have as the divergence between price and CVD, both mean something different but the outcome is the same
Lack of aggressive buyers/sellers
Price is making new highs (lows), but the delta is not.
This tells us that there are no aggressive buyers or sellers at new highs/lows.
Because limit orders are usually heavier hand, the trend can still continue, but without aggressive participants, there is a higher likelihood of pause or reversal.
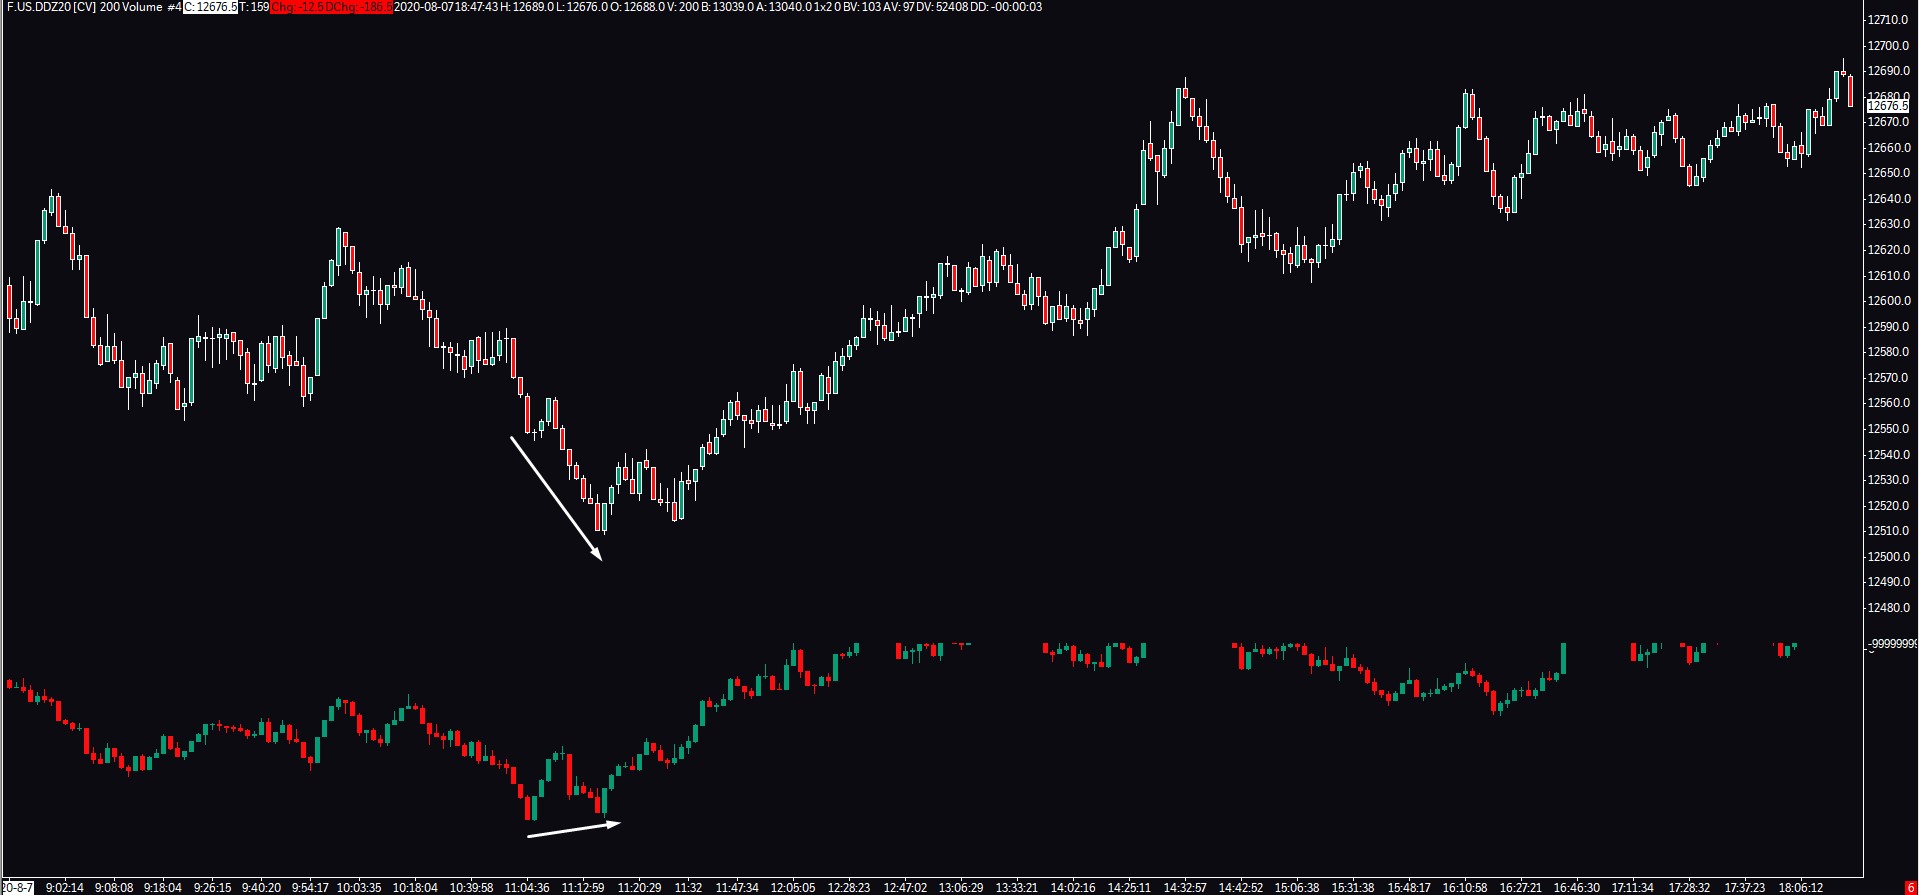
As you can see price makes a lower low but delta doesn’t.
This tells us that there is no willingness to sell and these new prices.
In other words, there are no aggressive sellers at new lows.
The same goes for the opposite when price makes a new high, but it is not reflected in the delta.
Cumulative Volume Delta – Absorption
This is my personal favorite type of divergence.
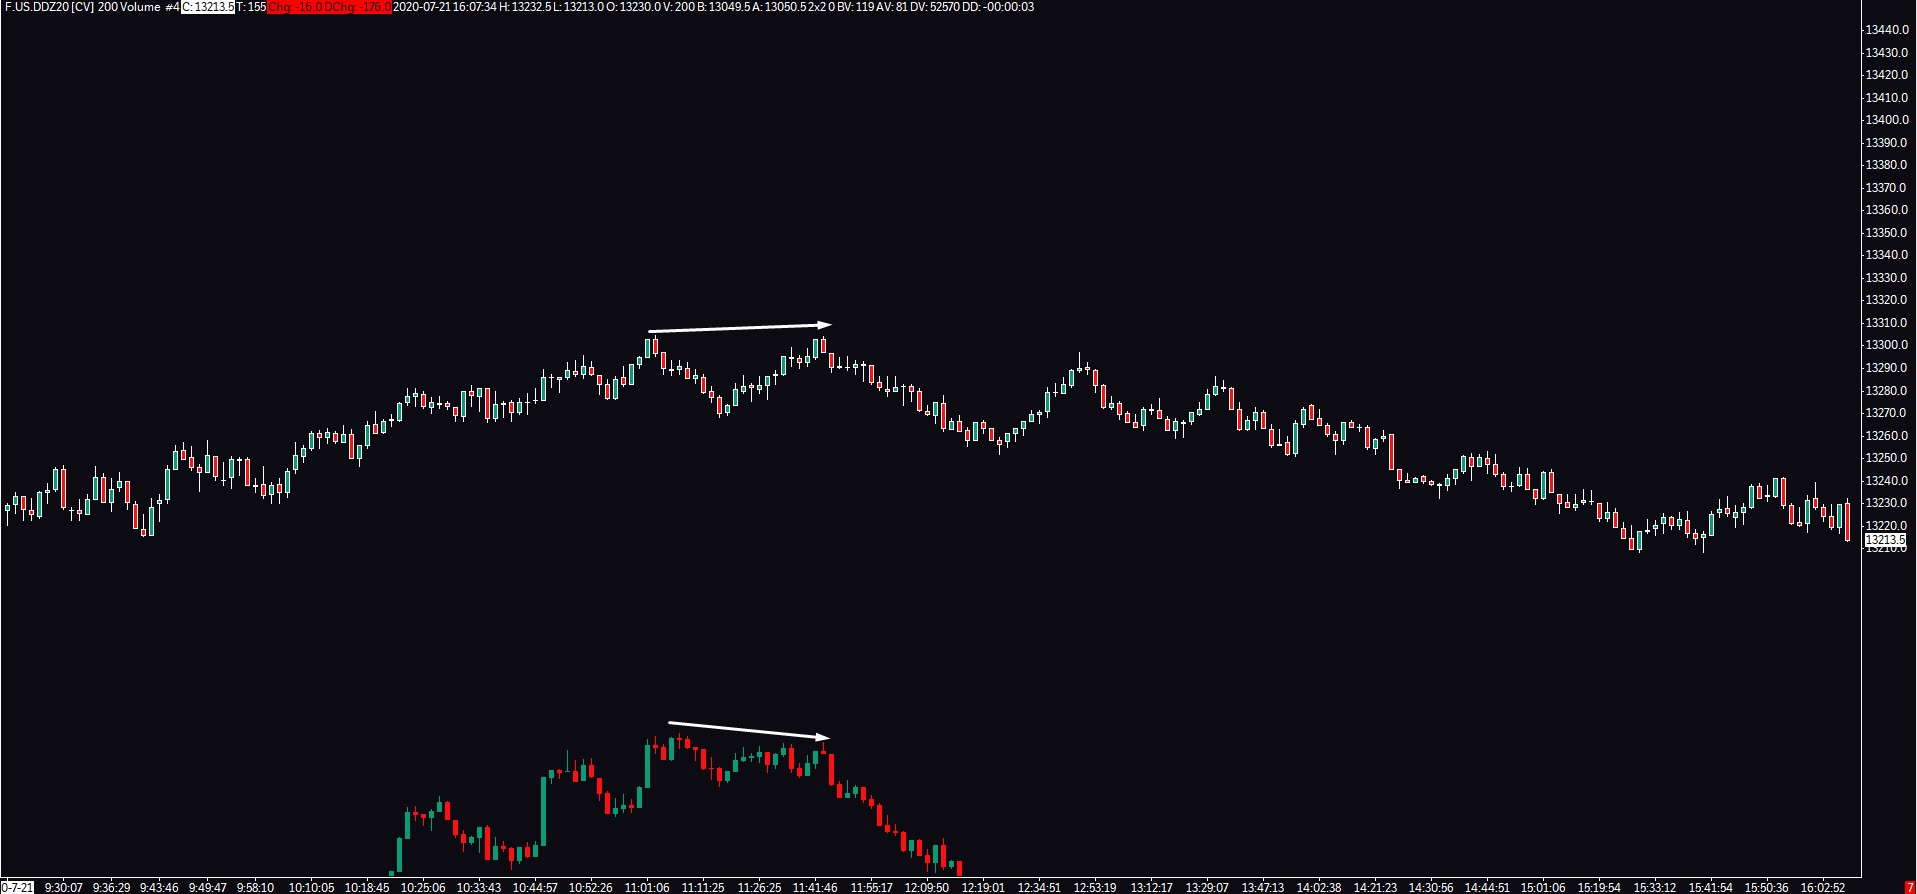
When cumulative volume delta makes a new high or low, but the price doesn’t, it signals absorption in the market.
It means that a lot of market orders that are reflected in the cumulative volume delta were absorbed by passive orders.
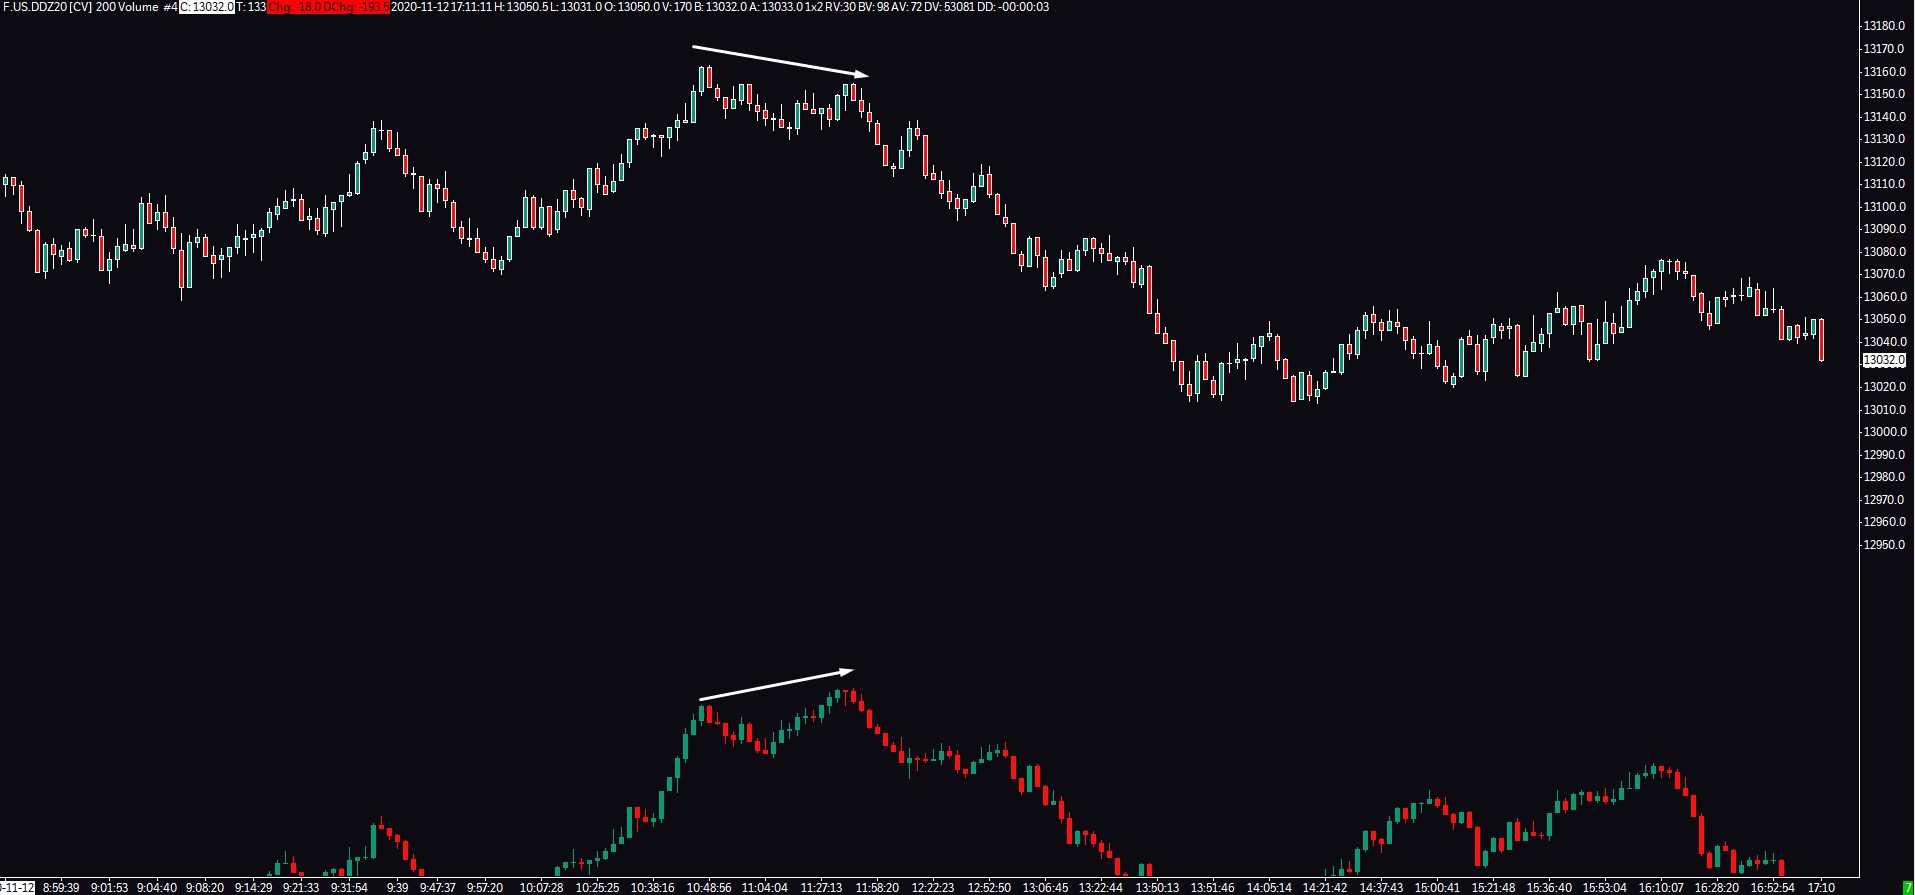
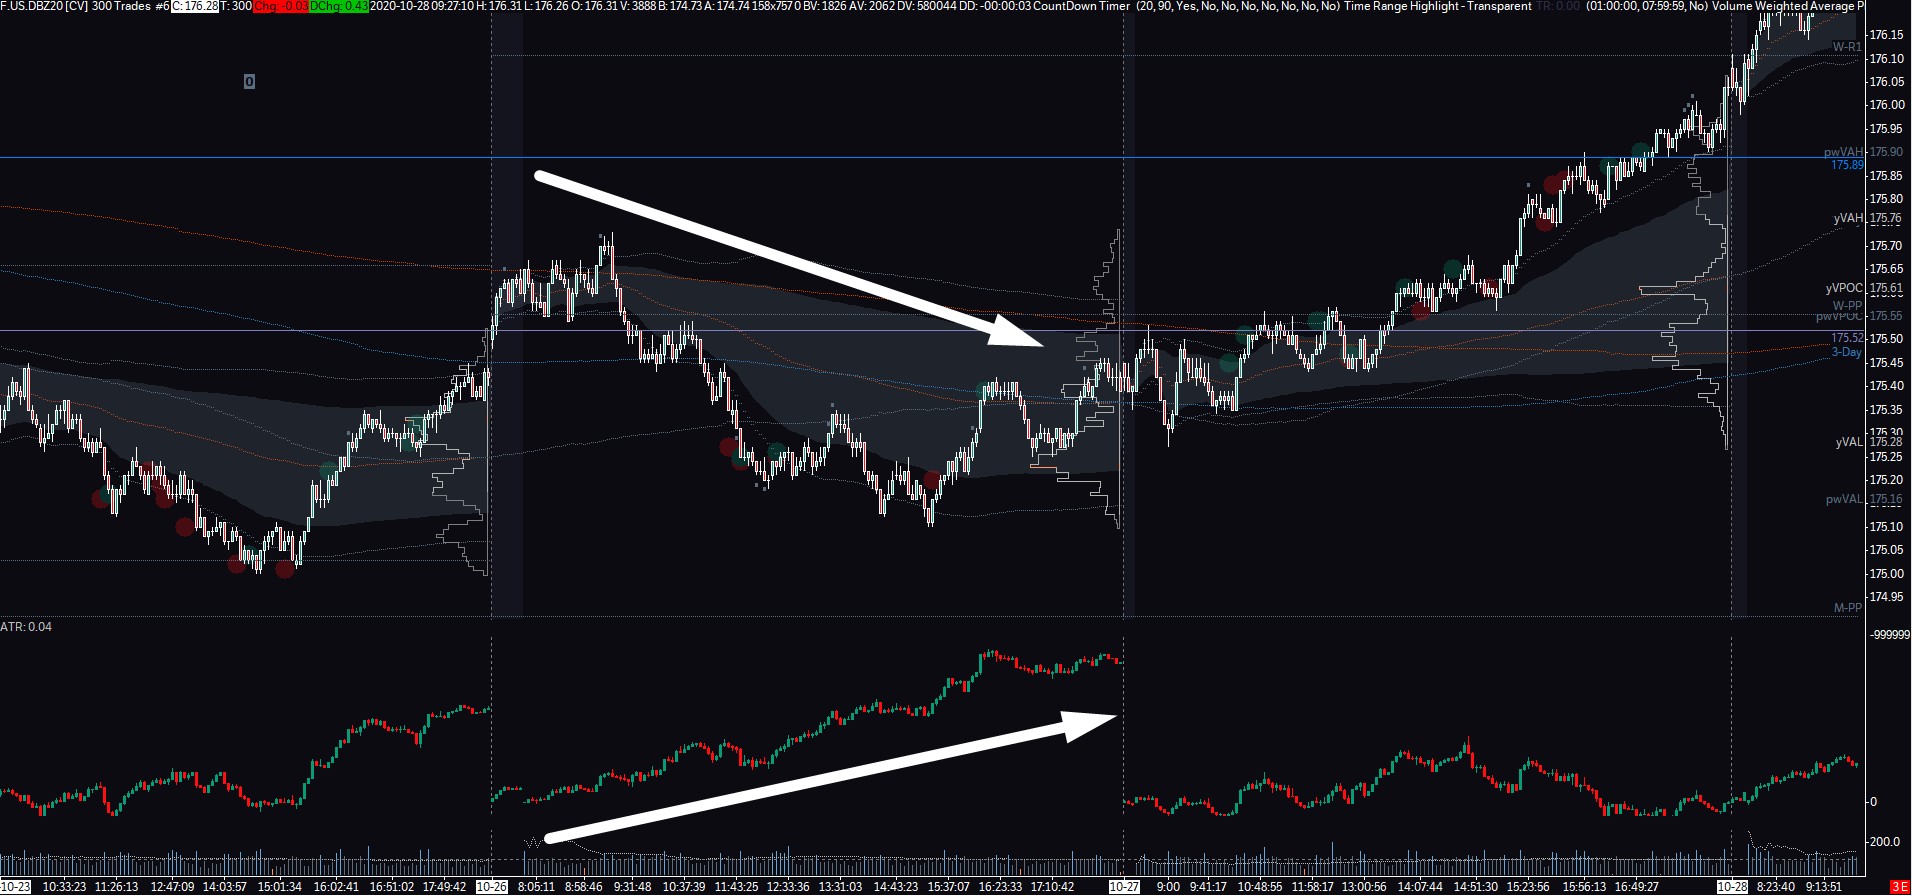
The example above clearly shows a higher high in cumulative volume delta, but a lower low in price.
This tells us that aggressive buyers are getting absorbed by passive sellers and price sells off shortly after.
Something I have noticed over my trading is that there are sometimes days when CVD and price go straight opposite from the start of the session.
I am not sure why these happen but it is important to be aware of these days early as you won’t put too much emphasis on these divergences.
Here is a recent example that I noticed during my trading in the Bund.
The only thing I can say for certain is that those aggressive market buyers didn’t have a great day.
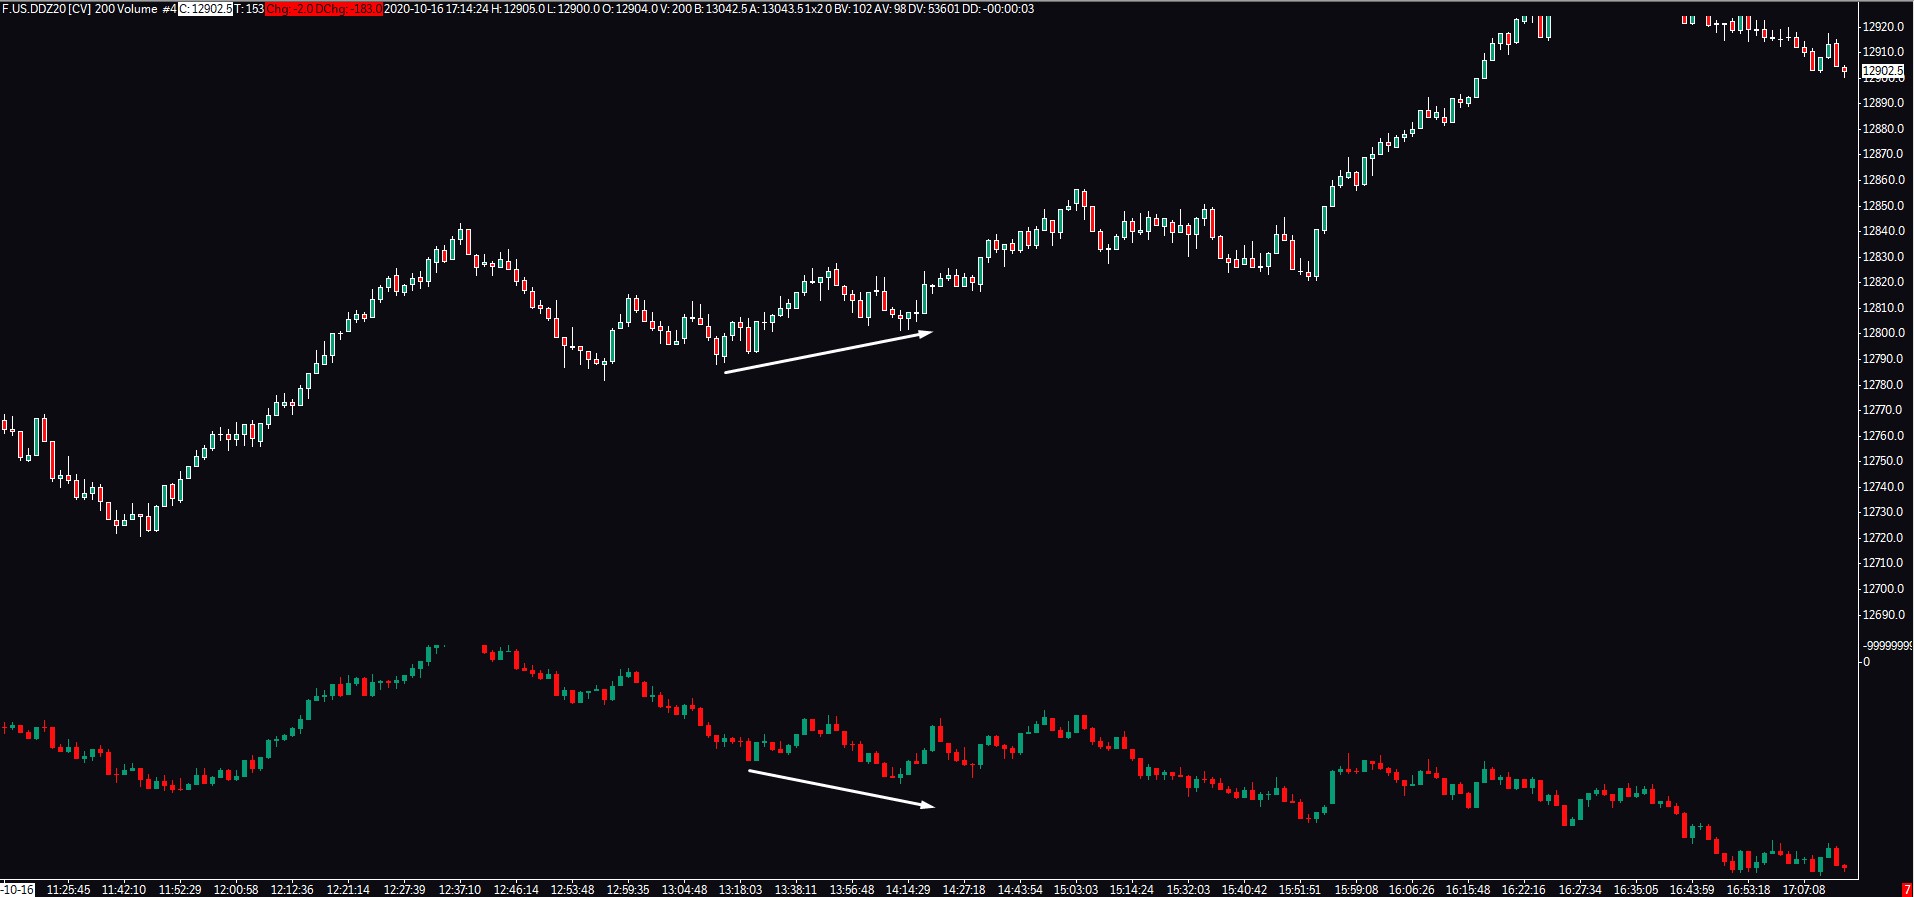
Cumulative Volume Delta – Hidden divergence
This is the more complicated one, so if you are new to these concepts it can bit little challenging to spot these.
Once again there are two types of these and they signal two different things.
I can stress enough that these divergences same as orderflow trading overall is critical to use at the key levels.
If you are going to try to spot these things in the middle of nowhere, you won’t find much success.
If you are interested to see how I find my levels and combine delta with different price patterns and other factors of confluence, you can go and check out the Trading Blueprint.
Single Bar Delta Divergence
Single bar delta divergence occurs when on a price chart there is an up candle with negative delta or a down candle with positive delta.
If you are not sure how delta in the bar is calculated it can be easily explained with this footprint example.
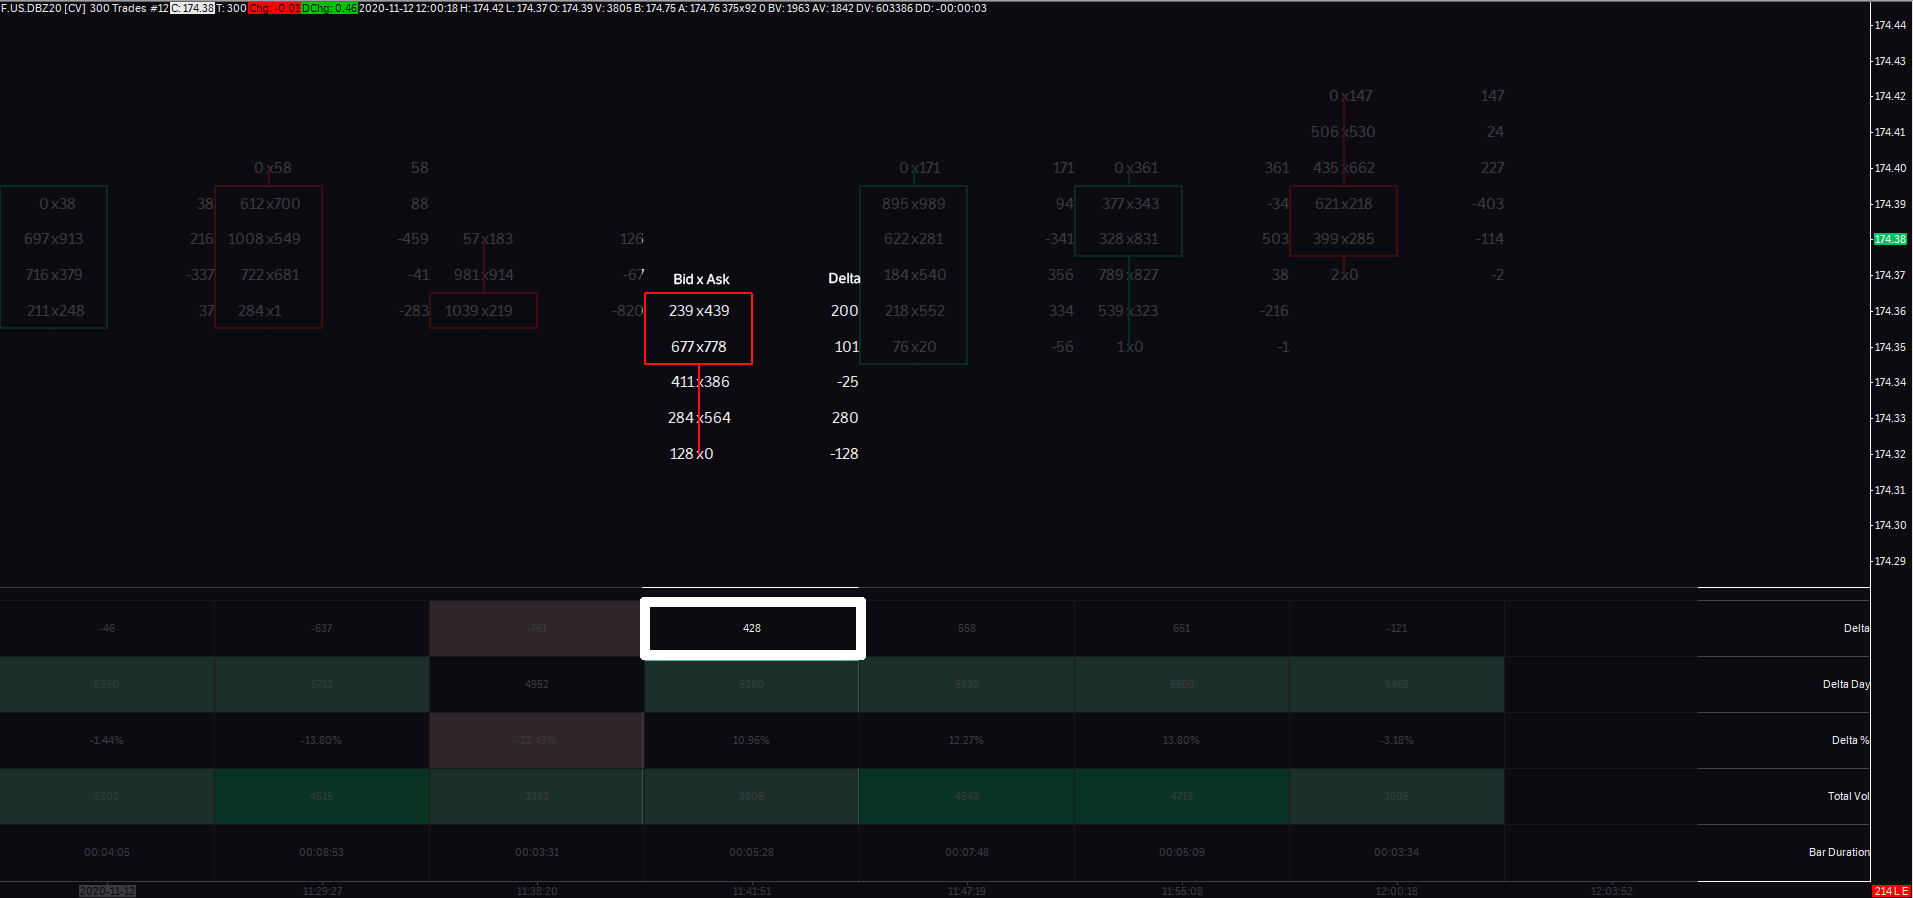
The highlighted candle shows the number of contracts traded at the bid and the offer for each price.
The difference between those two gives us delta.
At the bottom you can see a total delta for the whole bar, in this case, it is 428, but the bar closed red.
This is called a single bar delta divergence.
This tells us that although there were more buy orders executed, the candle closed red so the buyers got absorbed.
You can spot single bar delta divergence on your cumulative volume delta.
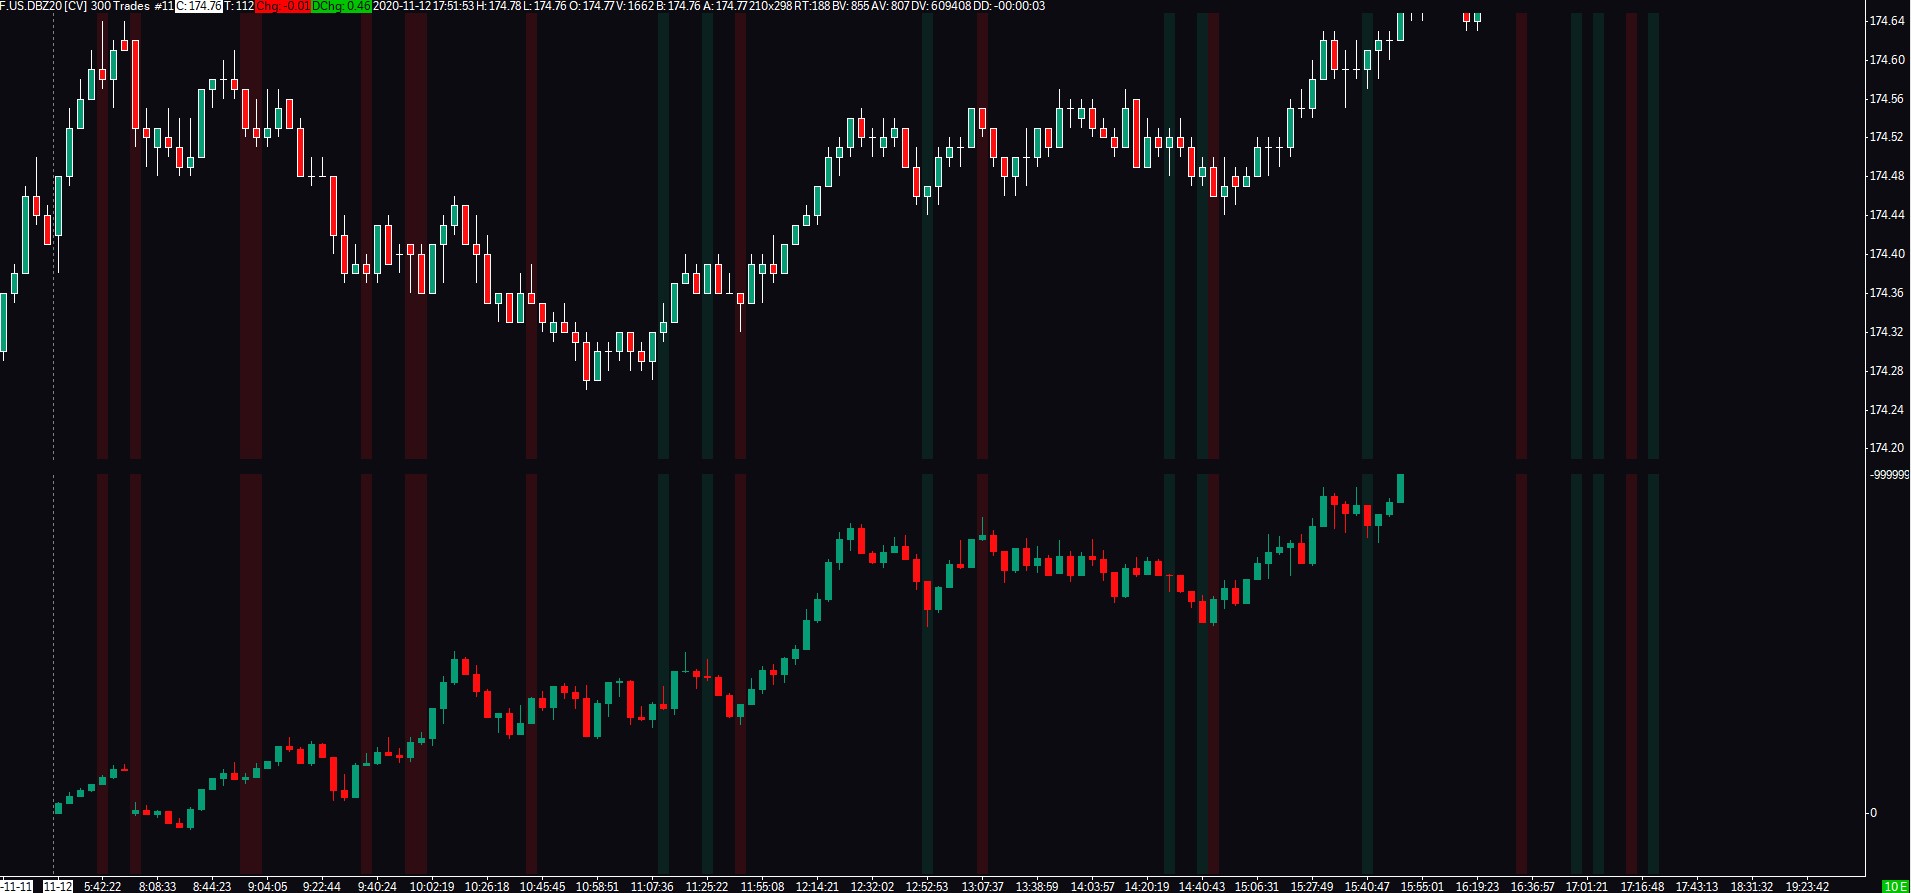
As you can notice there is a lot of divergences throughout the trading session, especially on lower timeframes which this chart represents.
This is why is extremely important to watch the overall context of the market and what it tries to achieve.
Also, I do recommend you to watch those divergences which are really obvious.
Numbers are relative to the instrument but if you know that your average bar has around +/- 1000 delta and you have a bearish bar with +20 delta, it probably doesn’t mean anything.
But if you have a bearish rejection bar with +900 delta, you should probably start to pay attention.
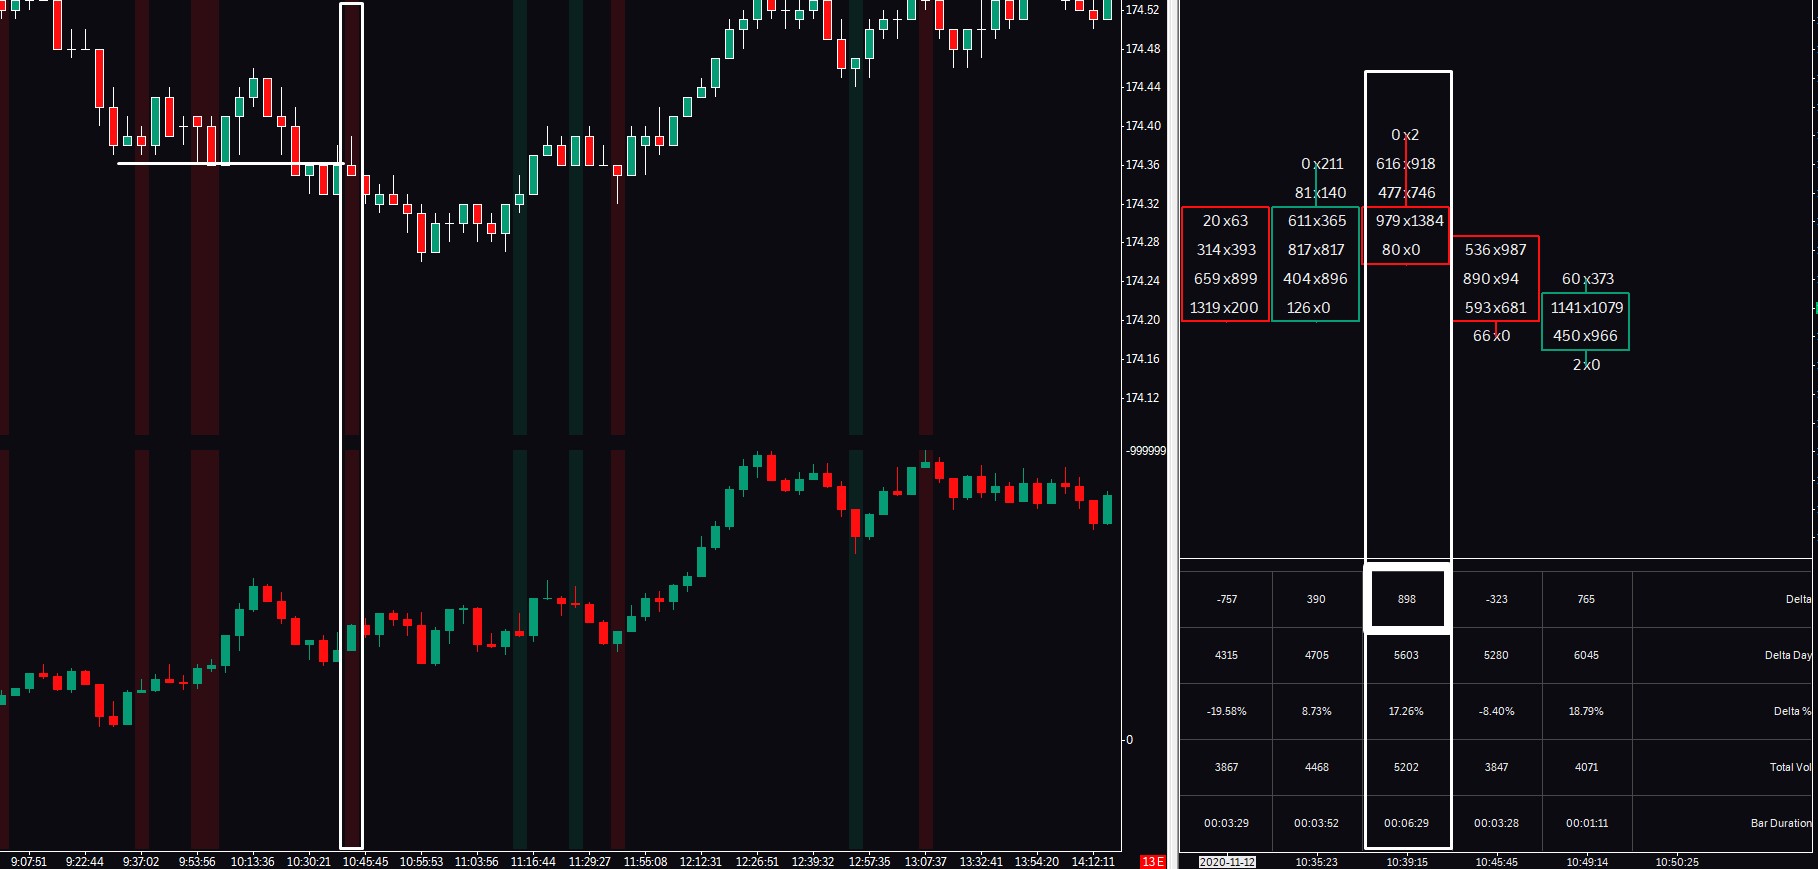
This is exactly what happens in the example above where price breaks below the support area and on the attempt to break back above, we can see a rejection candle with 900 positive delta.
It clearly shows an attempt from the buyers to push the price higher but absorption from sellers took place.
Limit Driven Breakout
This one is also not the easiest one to spot and on top of that, you won’t feel very confident getting into the trade as you are buying or selling a breakout.
I am not a fan of breakout trading, but if there is a situation where to trade breakout it is this one.
Sometimes you will get into the situation where you will see a big bar on the candlestick chart but the bar on cumulative volume delta will be very small.
This is actually a very bullish or bearish signal since it tells us that the whole movement was driven by the limit orders.
Once market orders realize what is going on they start aggressively hitting the bid or lifting the offer and the market very often just goes one direction without many pullbacks.
These are not easy trades to execute but once you spot the pattern on a key structural level, you will know that it is most likely the go time.
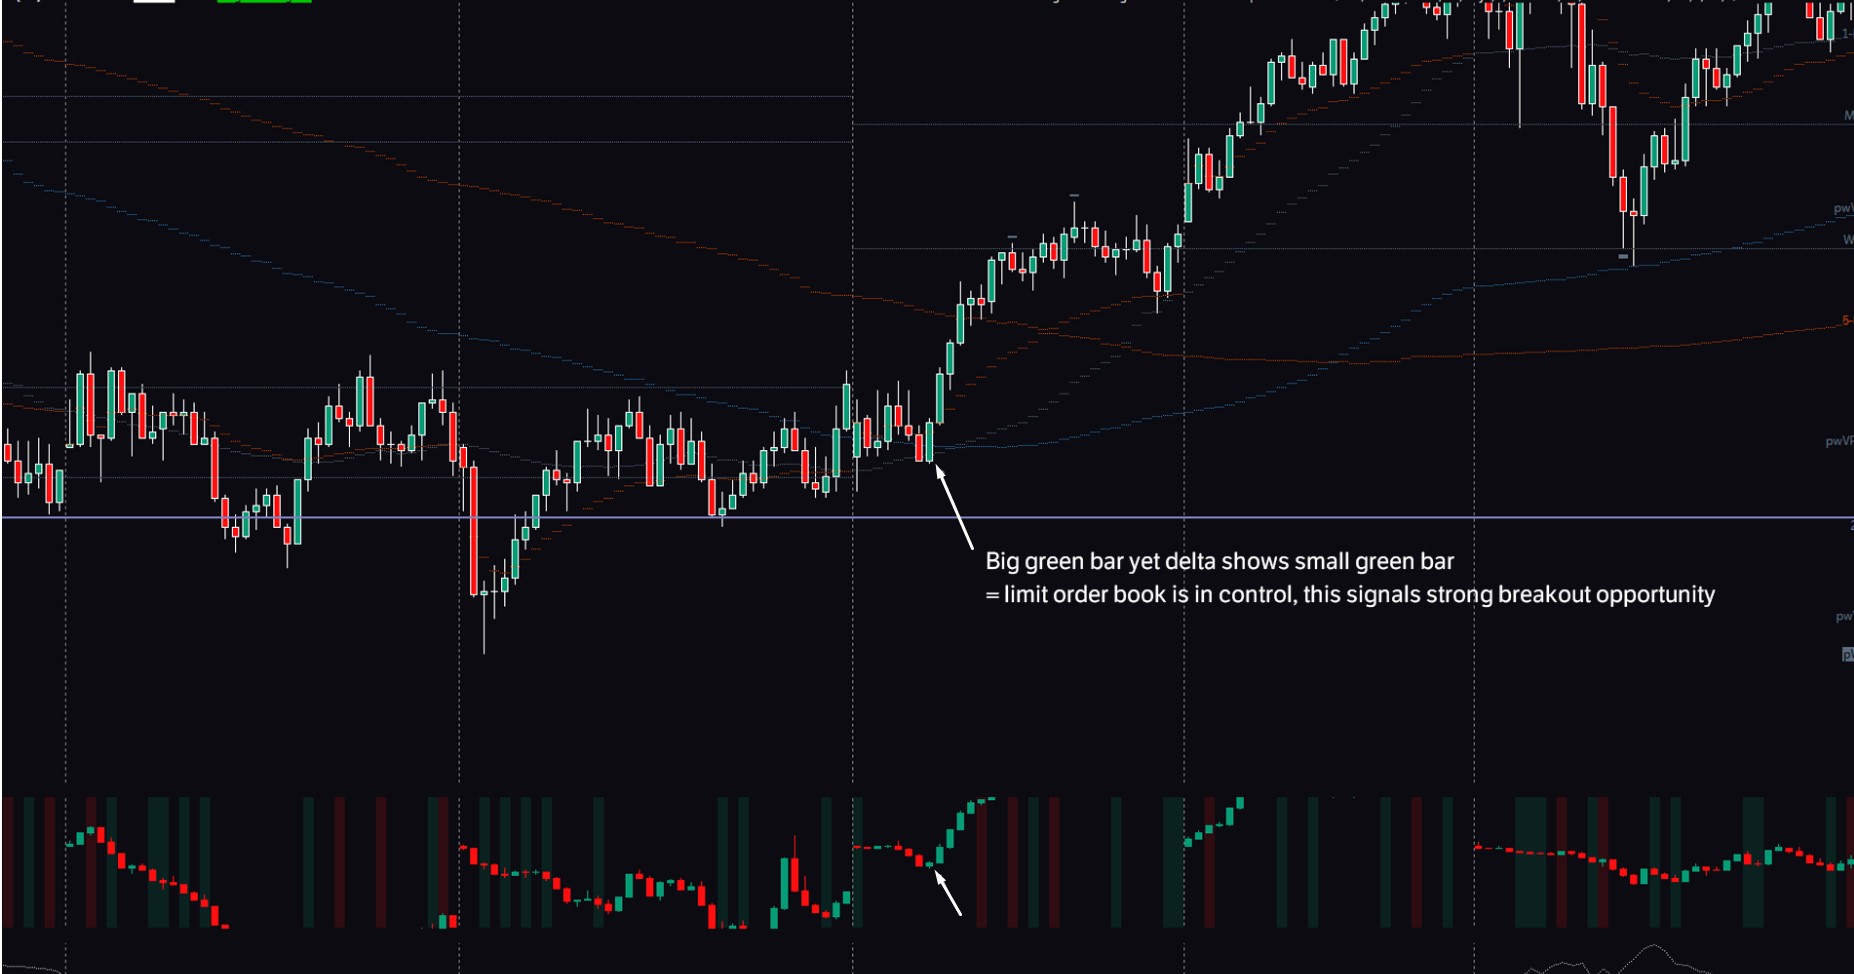
As you can see you get a zero pullback opportunity, so if you are okay with the risk, the best thing is just to jump in at the market.
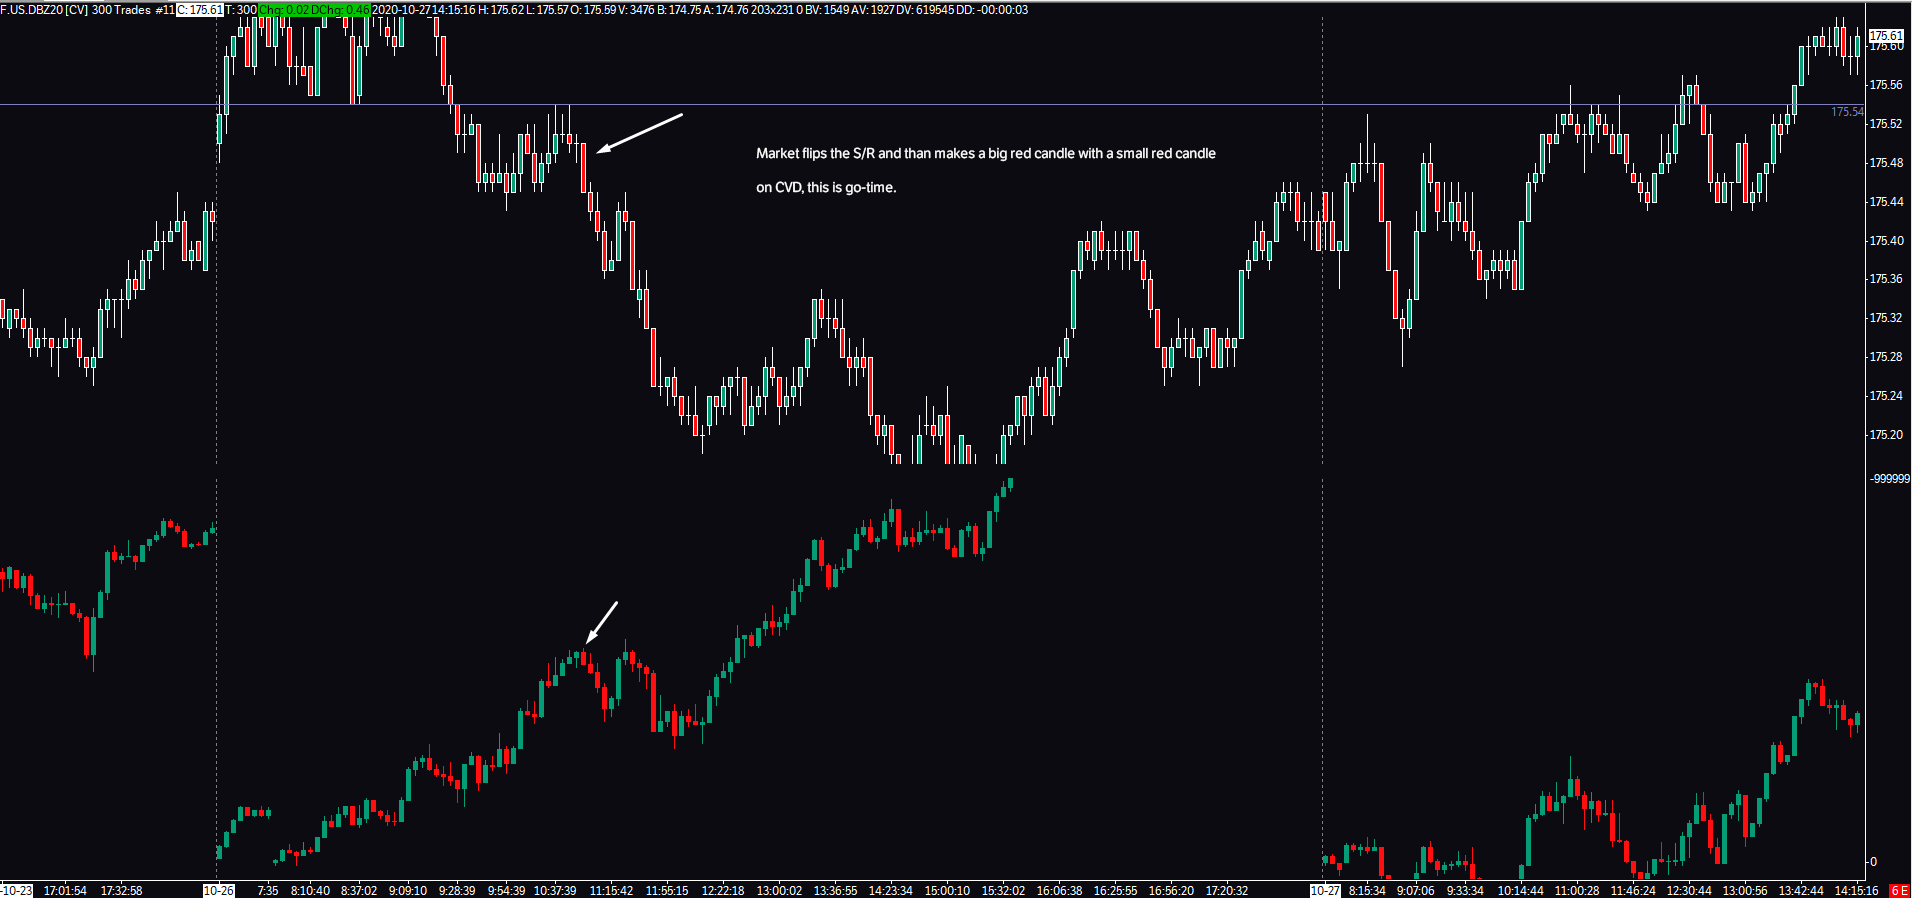
This second example is much better in a way that price tested the resistance areas so you already should be in a short trade.
The limit driven move you get afterward is a great confluence that you are on the right side of the market.
Delta on Footprint chart
A footprint chart is a great tool to look at delta for single bars.
I won’t go in-depth, as I already did in the Footprint Chart article.
But you should always be looking at your footprint chart to spot where market participants might getting too long or too short.
This way you can easily spot the absorption and also strength or weakness of moves happening in real-time.
Delta Y-Axis Profile
The last use of delta can be found the same as the volume profile, on the Y-axis of your chart.
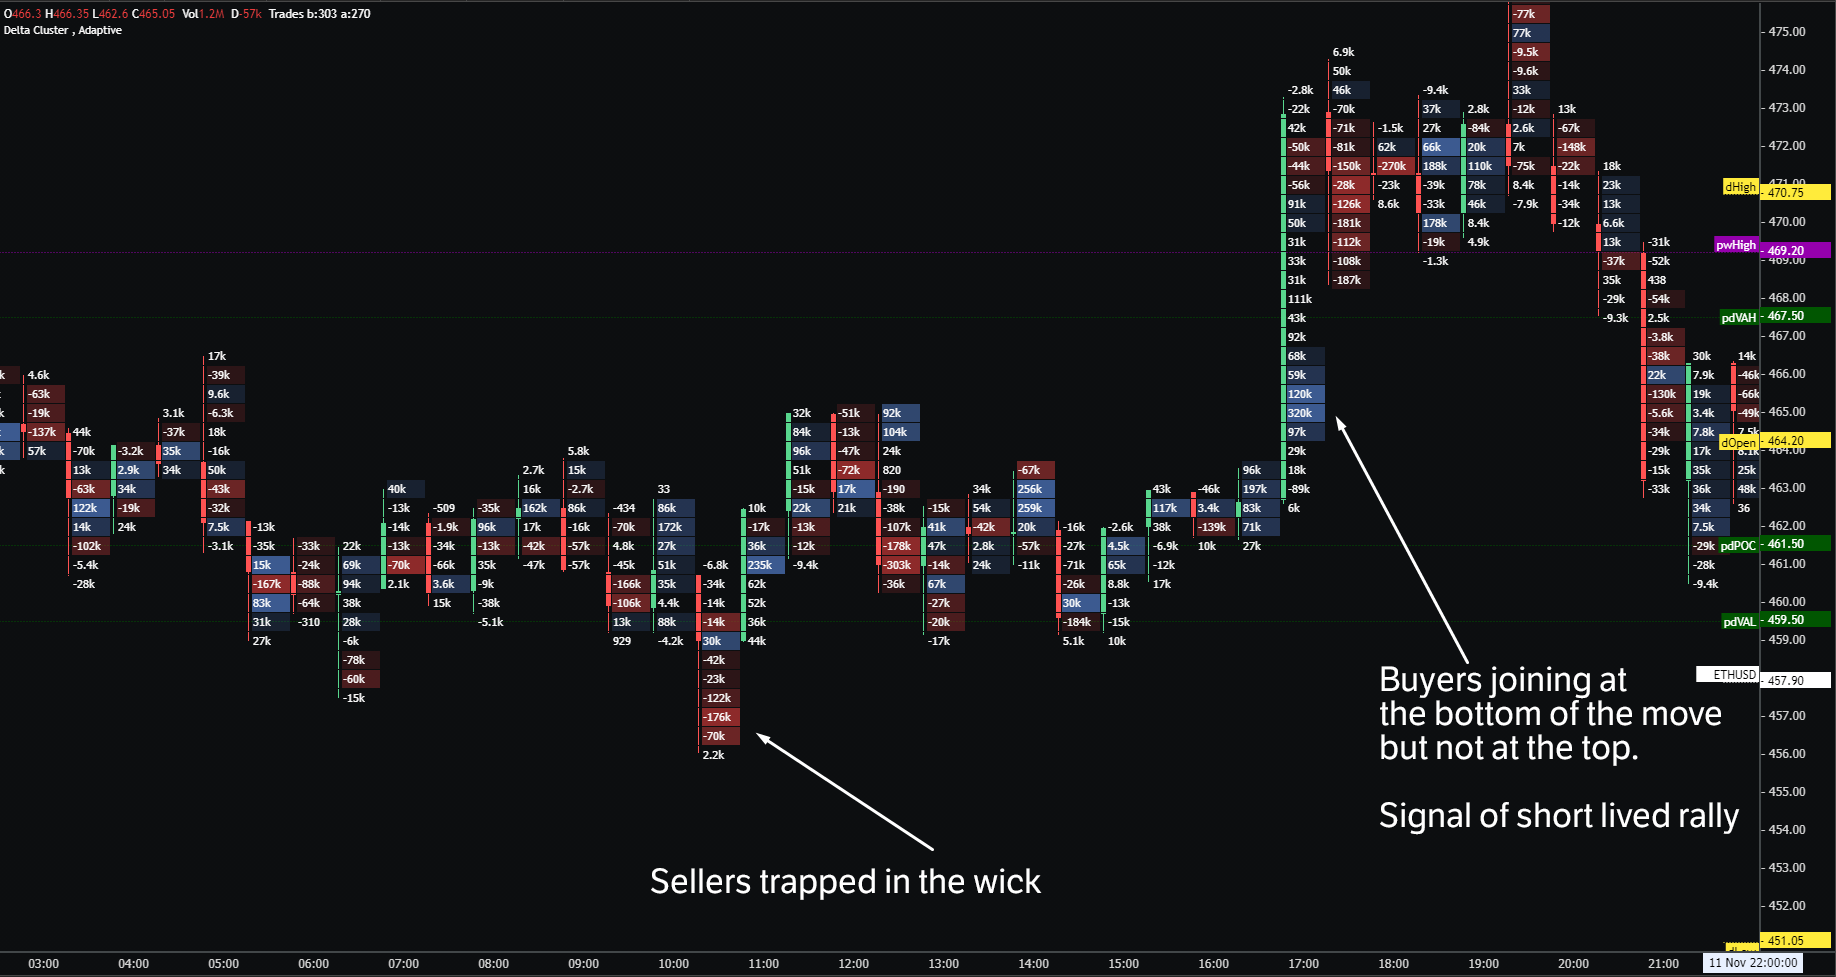
This plots a delta for each price level through the trading day.
As delta builds on each profile level, we can easily see at which prices traders got either too long or too short.
You always want to look at extreme values with the best trading opportunities provided when you are longing into levels with high negative delta or shorting into levels with high positive delta.
This is simply because you have price approaching these levels where traders are sitting off-side and most of them will be closing their positions on break even or slight profit/loss, this usually ads the fuel into the desired direction.
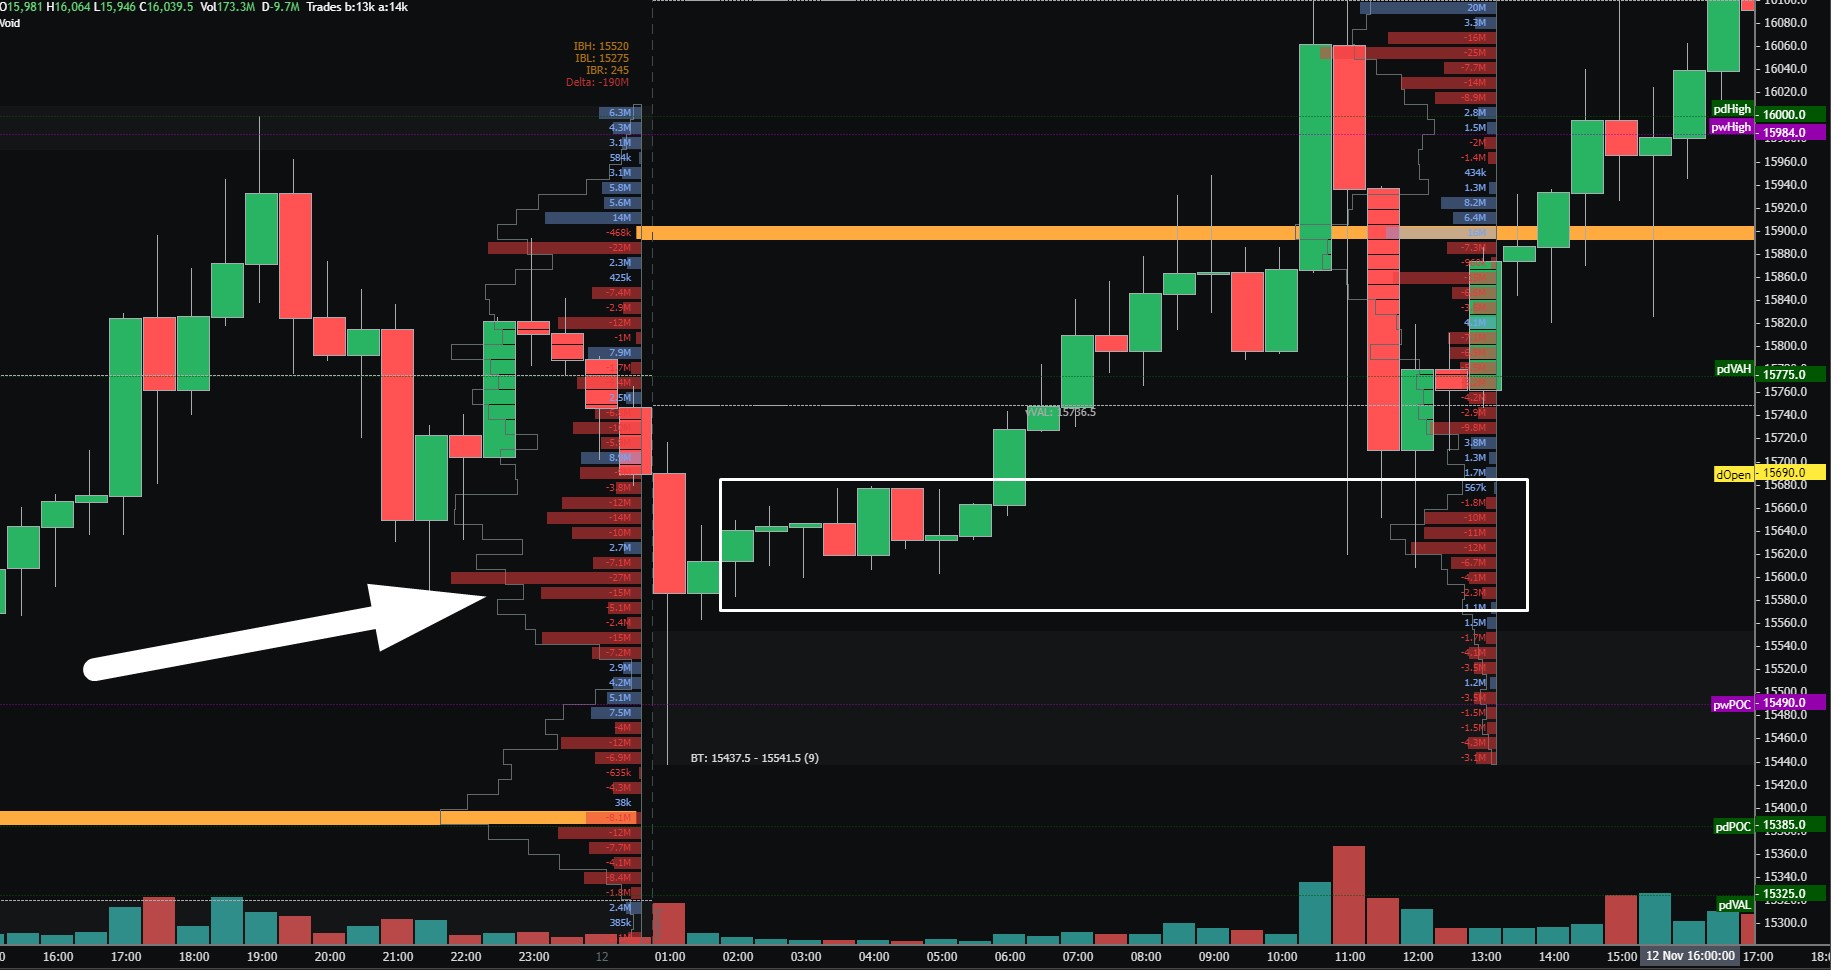
Although this might seem like a simple resistance turned support situation, there is something a lot of traders won’t notice.
On the prior day, there was a significant selling in the same area.
As the price is trading above it, all these shorts will try to exit their underwater positions on break-even on slight loss.
Since they are buying back their shorts, we have a strong orderflow confluence of the move to the upside.
Conclusion
Compared to dumbed-down technical indicators, Orderflow trading requires a little bit of practice and common sense.
But once you get used to trading and watching Orderflow, it offers an invaluable advantage in your own trading.