
Finding data-driven high probability crypto trades
One of the primary benefits of trading cryptocurrencies, in contrast to markets like forex or futures, is the widespread availability and often free access to a wealth of data.
Over the past few years, I’ve shared various tools I use on both this blog and my X profile. I thought it would be beneficial to compile all of these tools into a single, comprehensive post, complete with chart examples.
While I exclusively trade on higher timeframes, these tools can be easily adapted for intraday trading.
For those interested in more in-depth learning, these tools are also covered in the Tradingriot Education course, alongside my approach to trading traditional markets.
Table of Contents
Derivatives data
In recent years, tools like open interest, funding rates, and liquidations have gained significant popularity. Before delving into their specific applications, let’s briefly review what each of these terms signifies.
Open Interest
Open interest quantifies the total number of outstanding contracts within a given market, representing positions that have not yet been closed.
The calculation for open interest is:
Open Interest = (Net Open Long Positions + Net Open Short Positions) / 2
Essentially, open interest provides insight into directional market positioning.
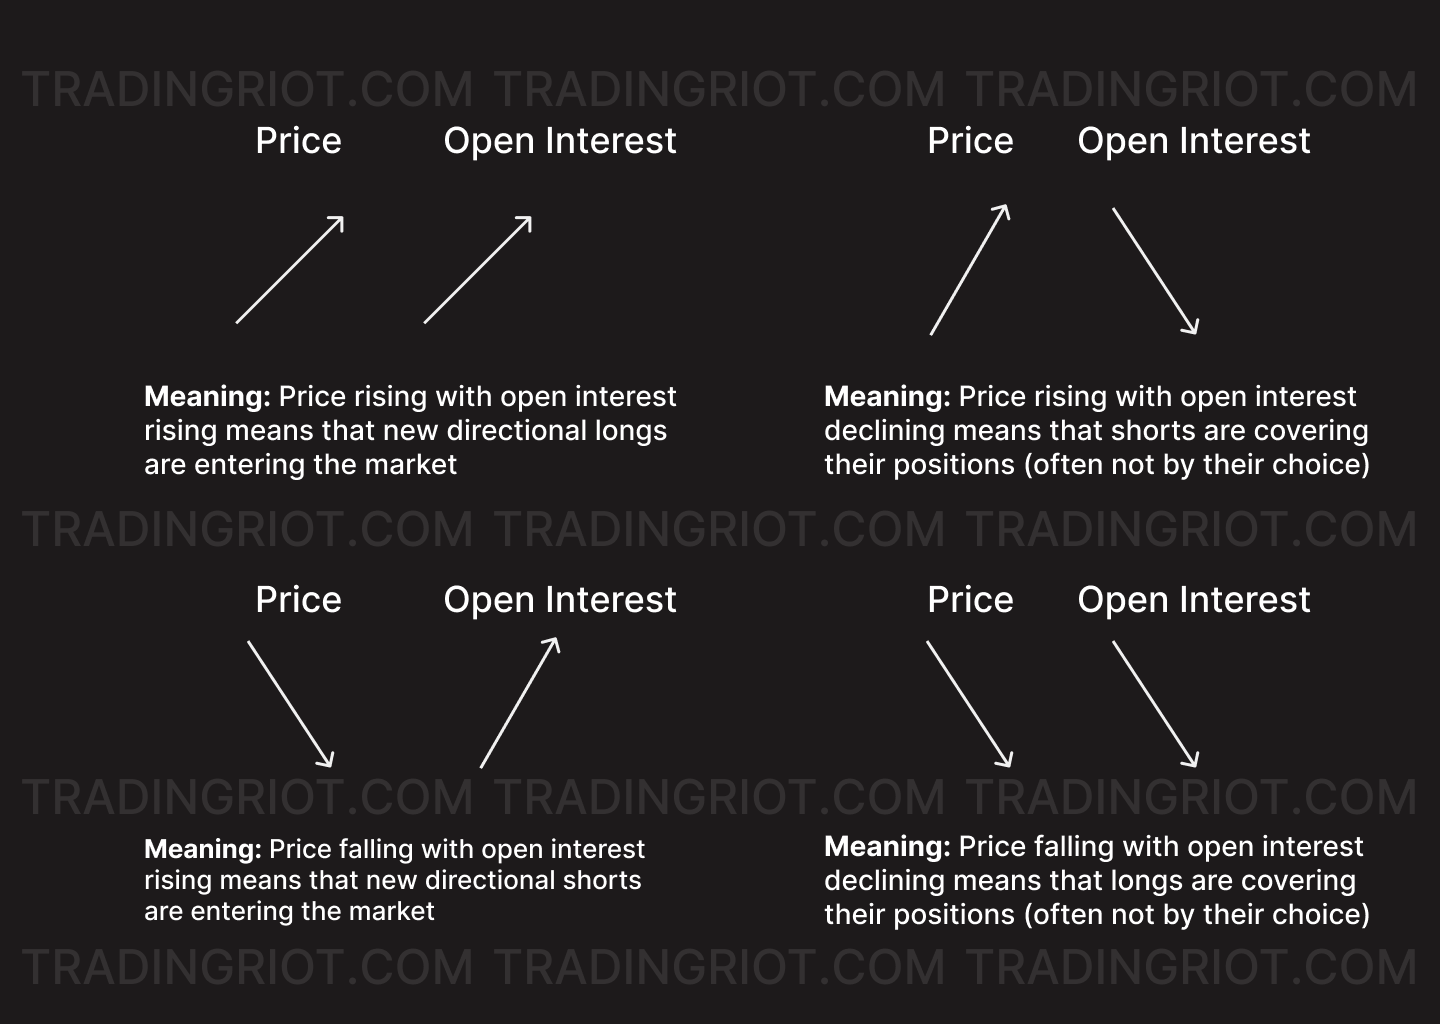
Open interest is a crucial factor for both mean-reversion and breakout trading strategies.
Significant shifts in open interest, whether a substantial increase or a large flush, frequently signal prime trading opportunities.
A sharp rise in open interest, for instance, indicates robust positional demand for a coin, which can lead to continued trend momentum.
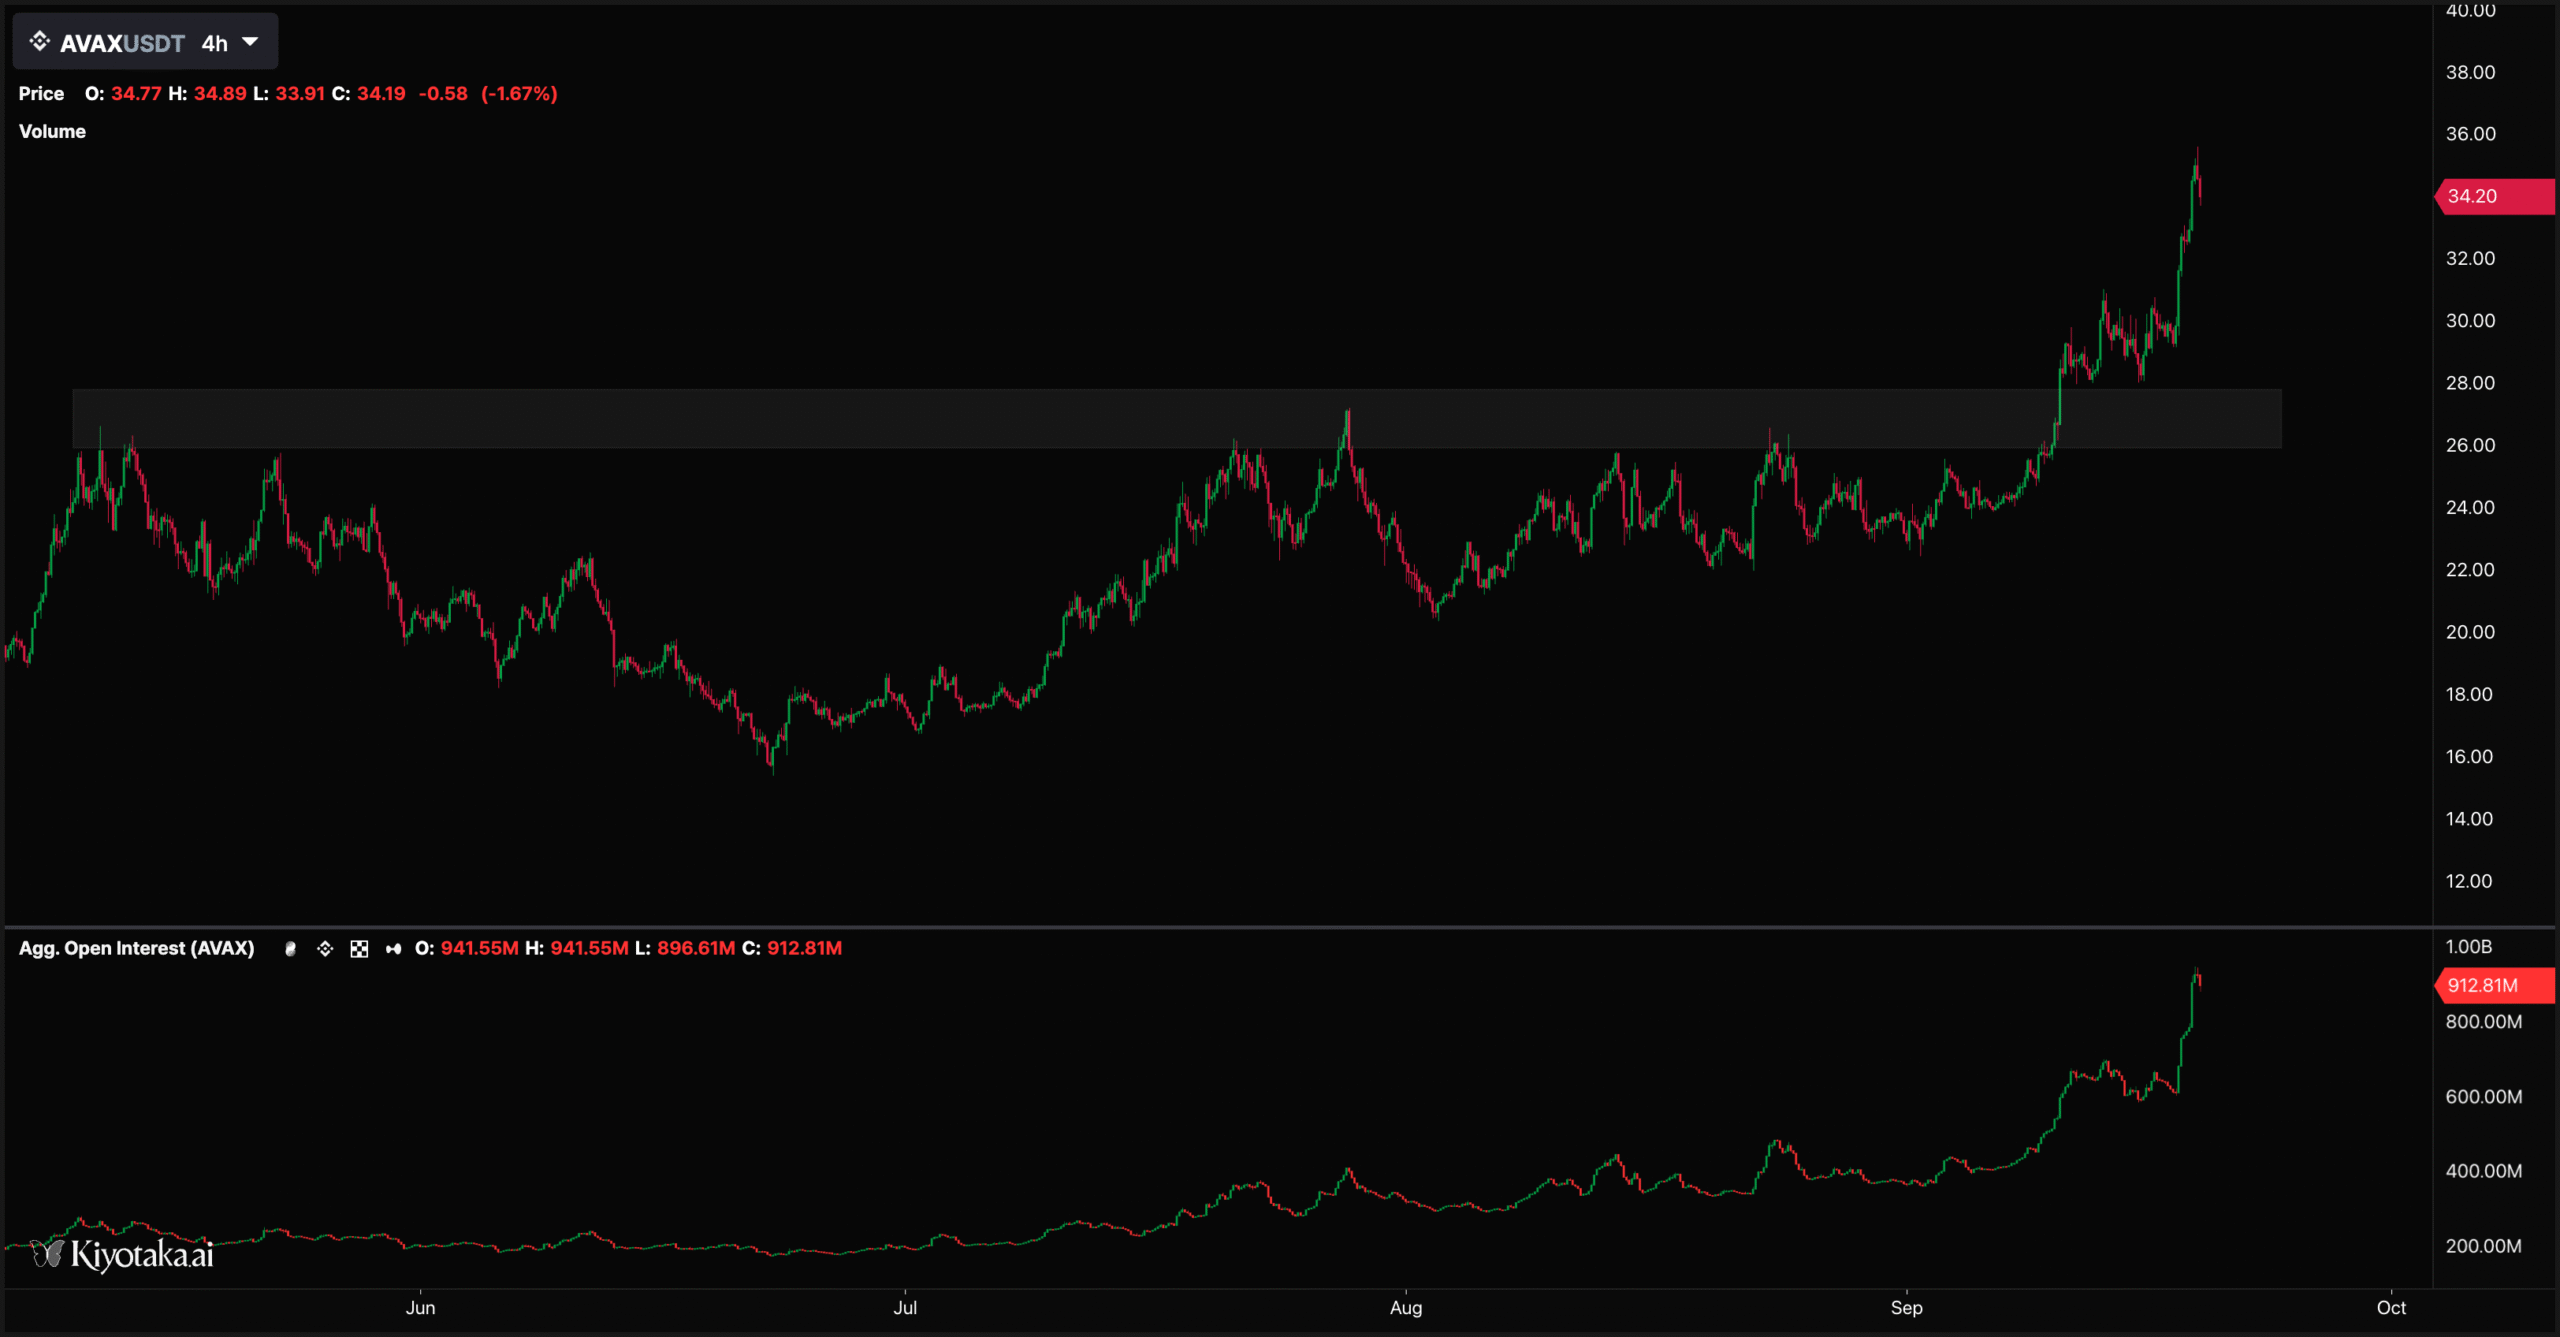
As illustrated by the example above, AVAX successfully breached a structural resistance level, accompanied by a significant surge in open interest. This indicates the involvement of major market participants, suggesting a potential upward price movement in the near future.
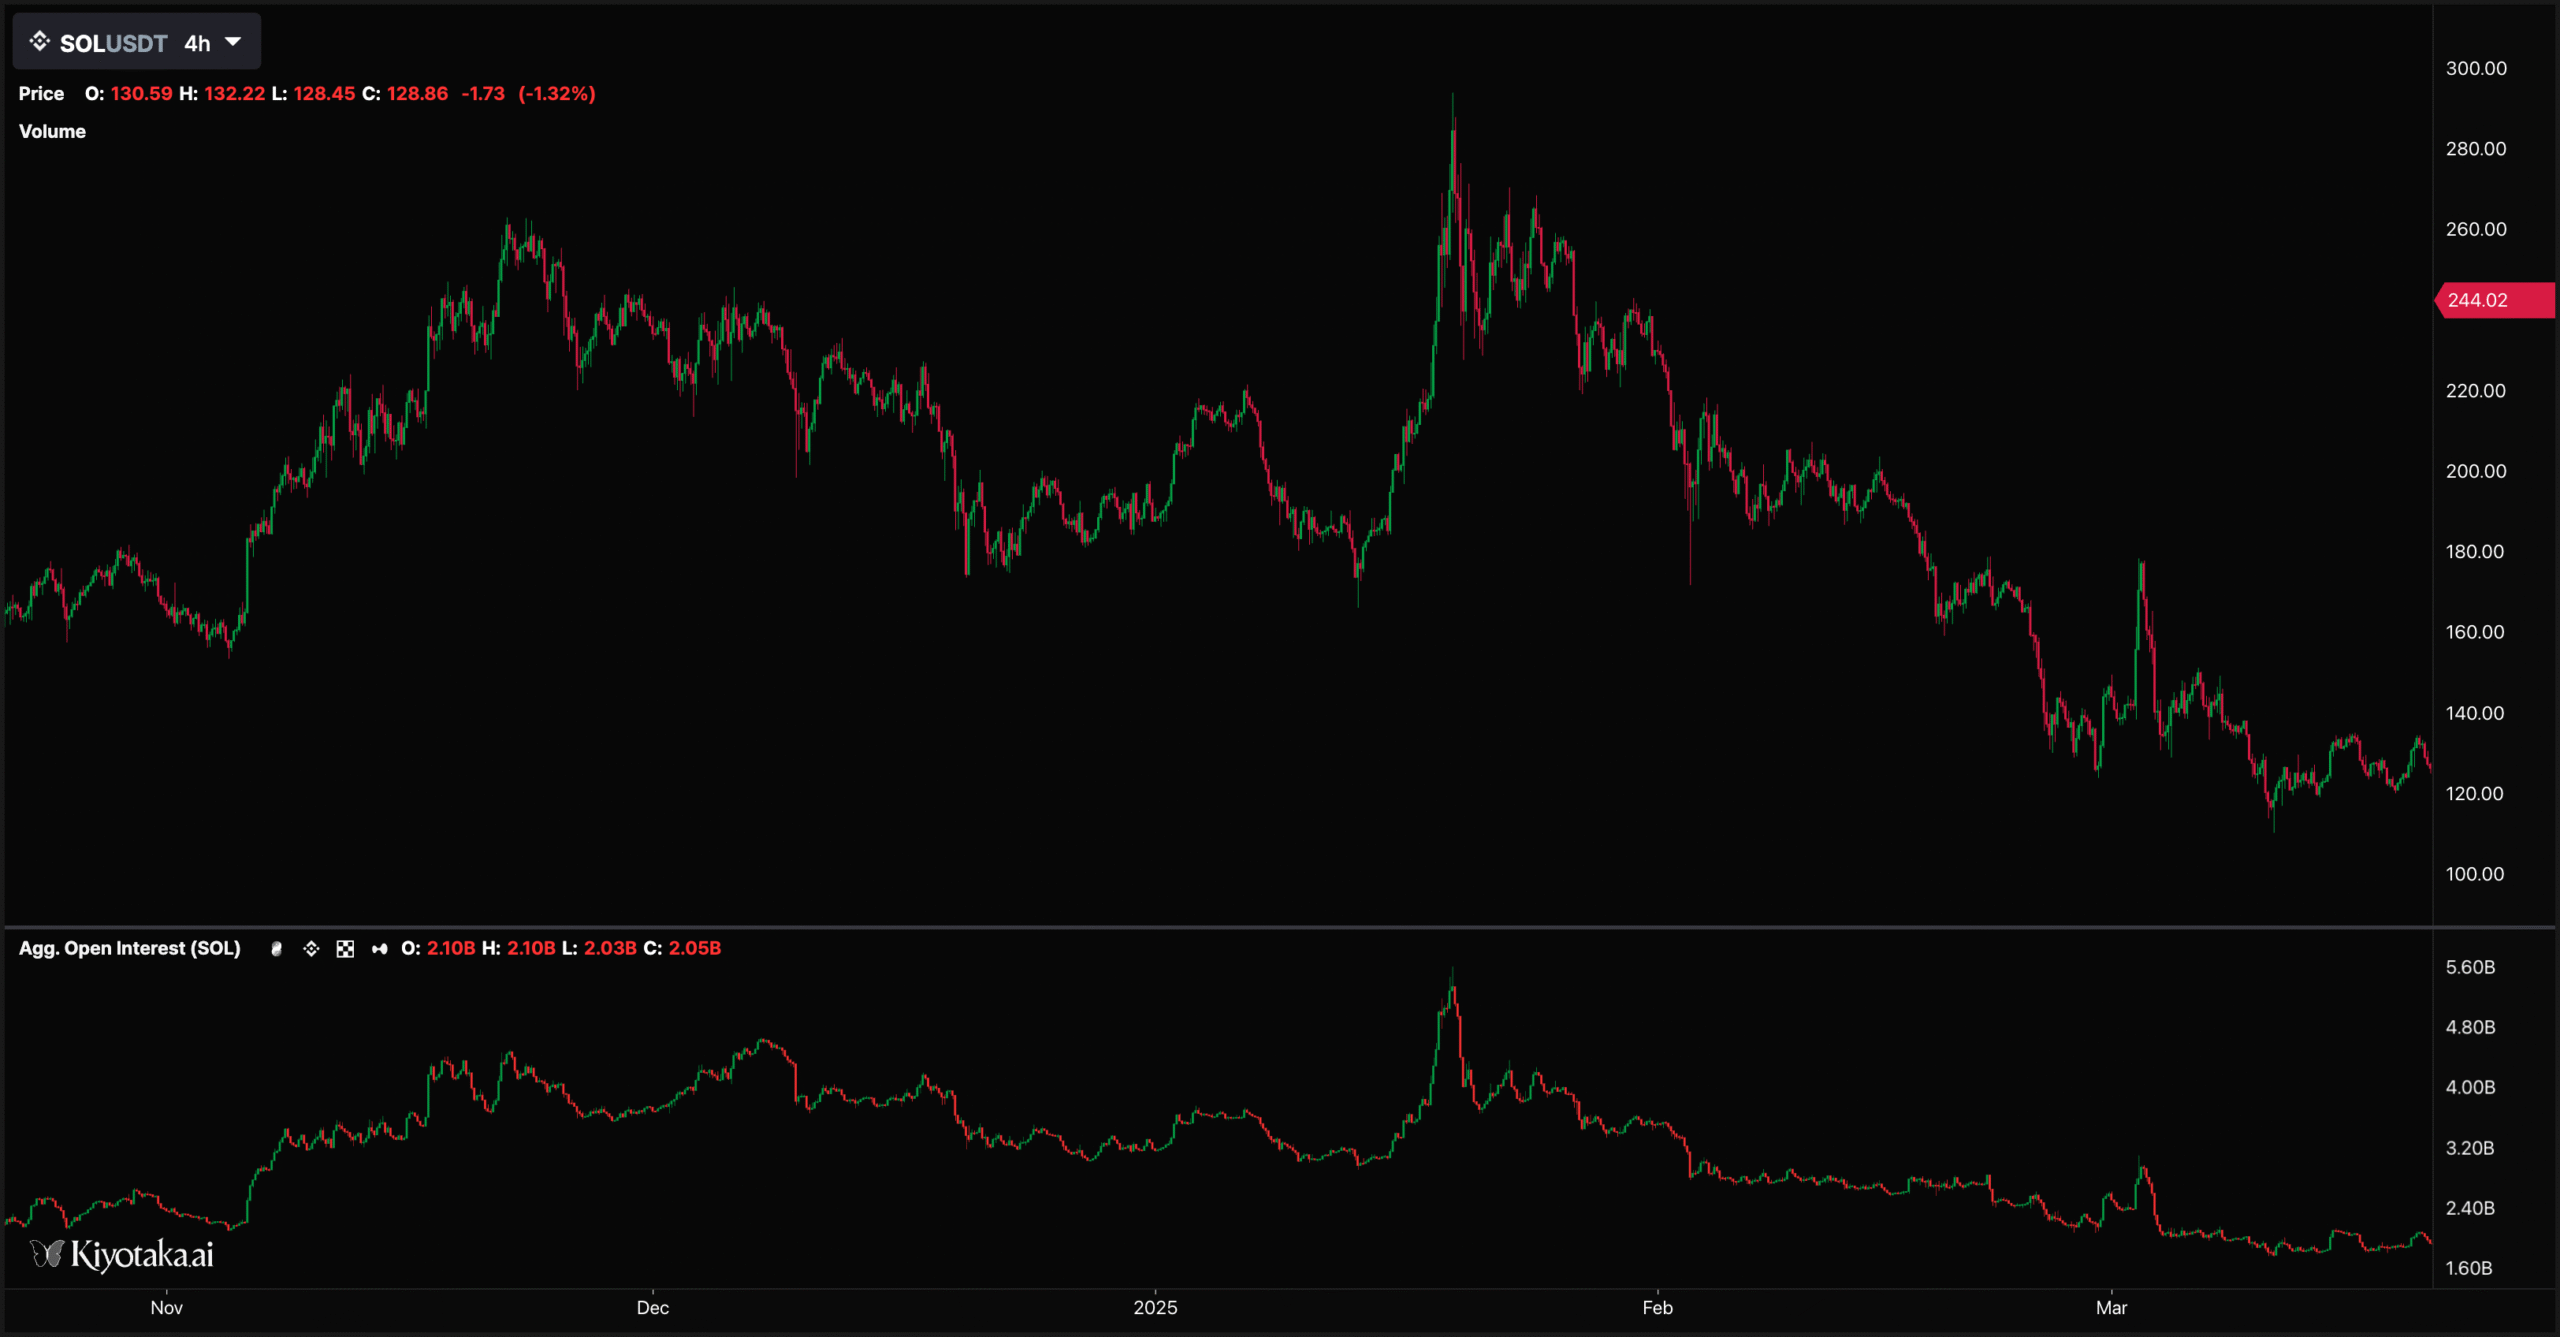
However, market dynamics are not always straightforward. The Solana example demonstrates a substantial increase in open interest that did not translate into a continued upward trend; instead, the market experienced a sell-off.
To better assess whether trends are likely to persist or reverse, additional tools that offer deeper insights into derivative positioning can be utilized.
Funding rates
Funding rates are a unique mechanism in cryptocurrency that encourages traders to open both long and short positions. This helps to keep the value of a perpetual swap contract aligned with its spot market price.
- Positive Funding: If the perpetual swap trades above the spot price, the funding rate is positive. In this scenario, traders with long positions pay a fee to those with short positions.
- Negative Funding: Conversely, if the perpetual swap trades below the spot price, the funding rate is negative. Here, traders with short positions pay a fee to those with long positions.
It’s a common misconception that highly positive or negative funding immediately signals a price reversal.
This is not always true, as funding can remain elevated for extended periods in trending markets.
Over the years, funding dynamics have evolved significantly. Due to the increased popularity of carry trades, we rarely see the drastic blowoffs in funding that were once common. While extreme funding rates are now mostly observed with “crime” coins, significant changes in funding rates can still offer valuable insights for traders.
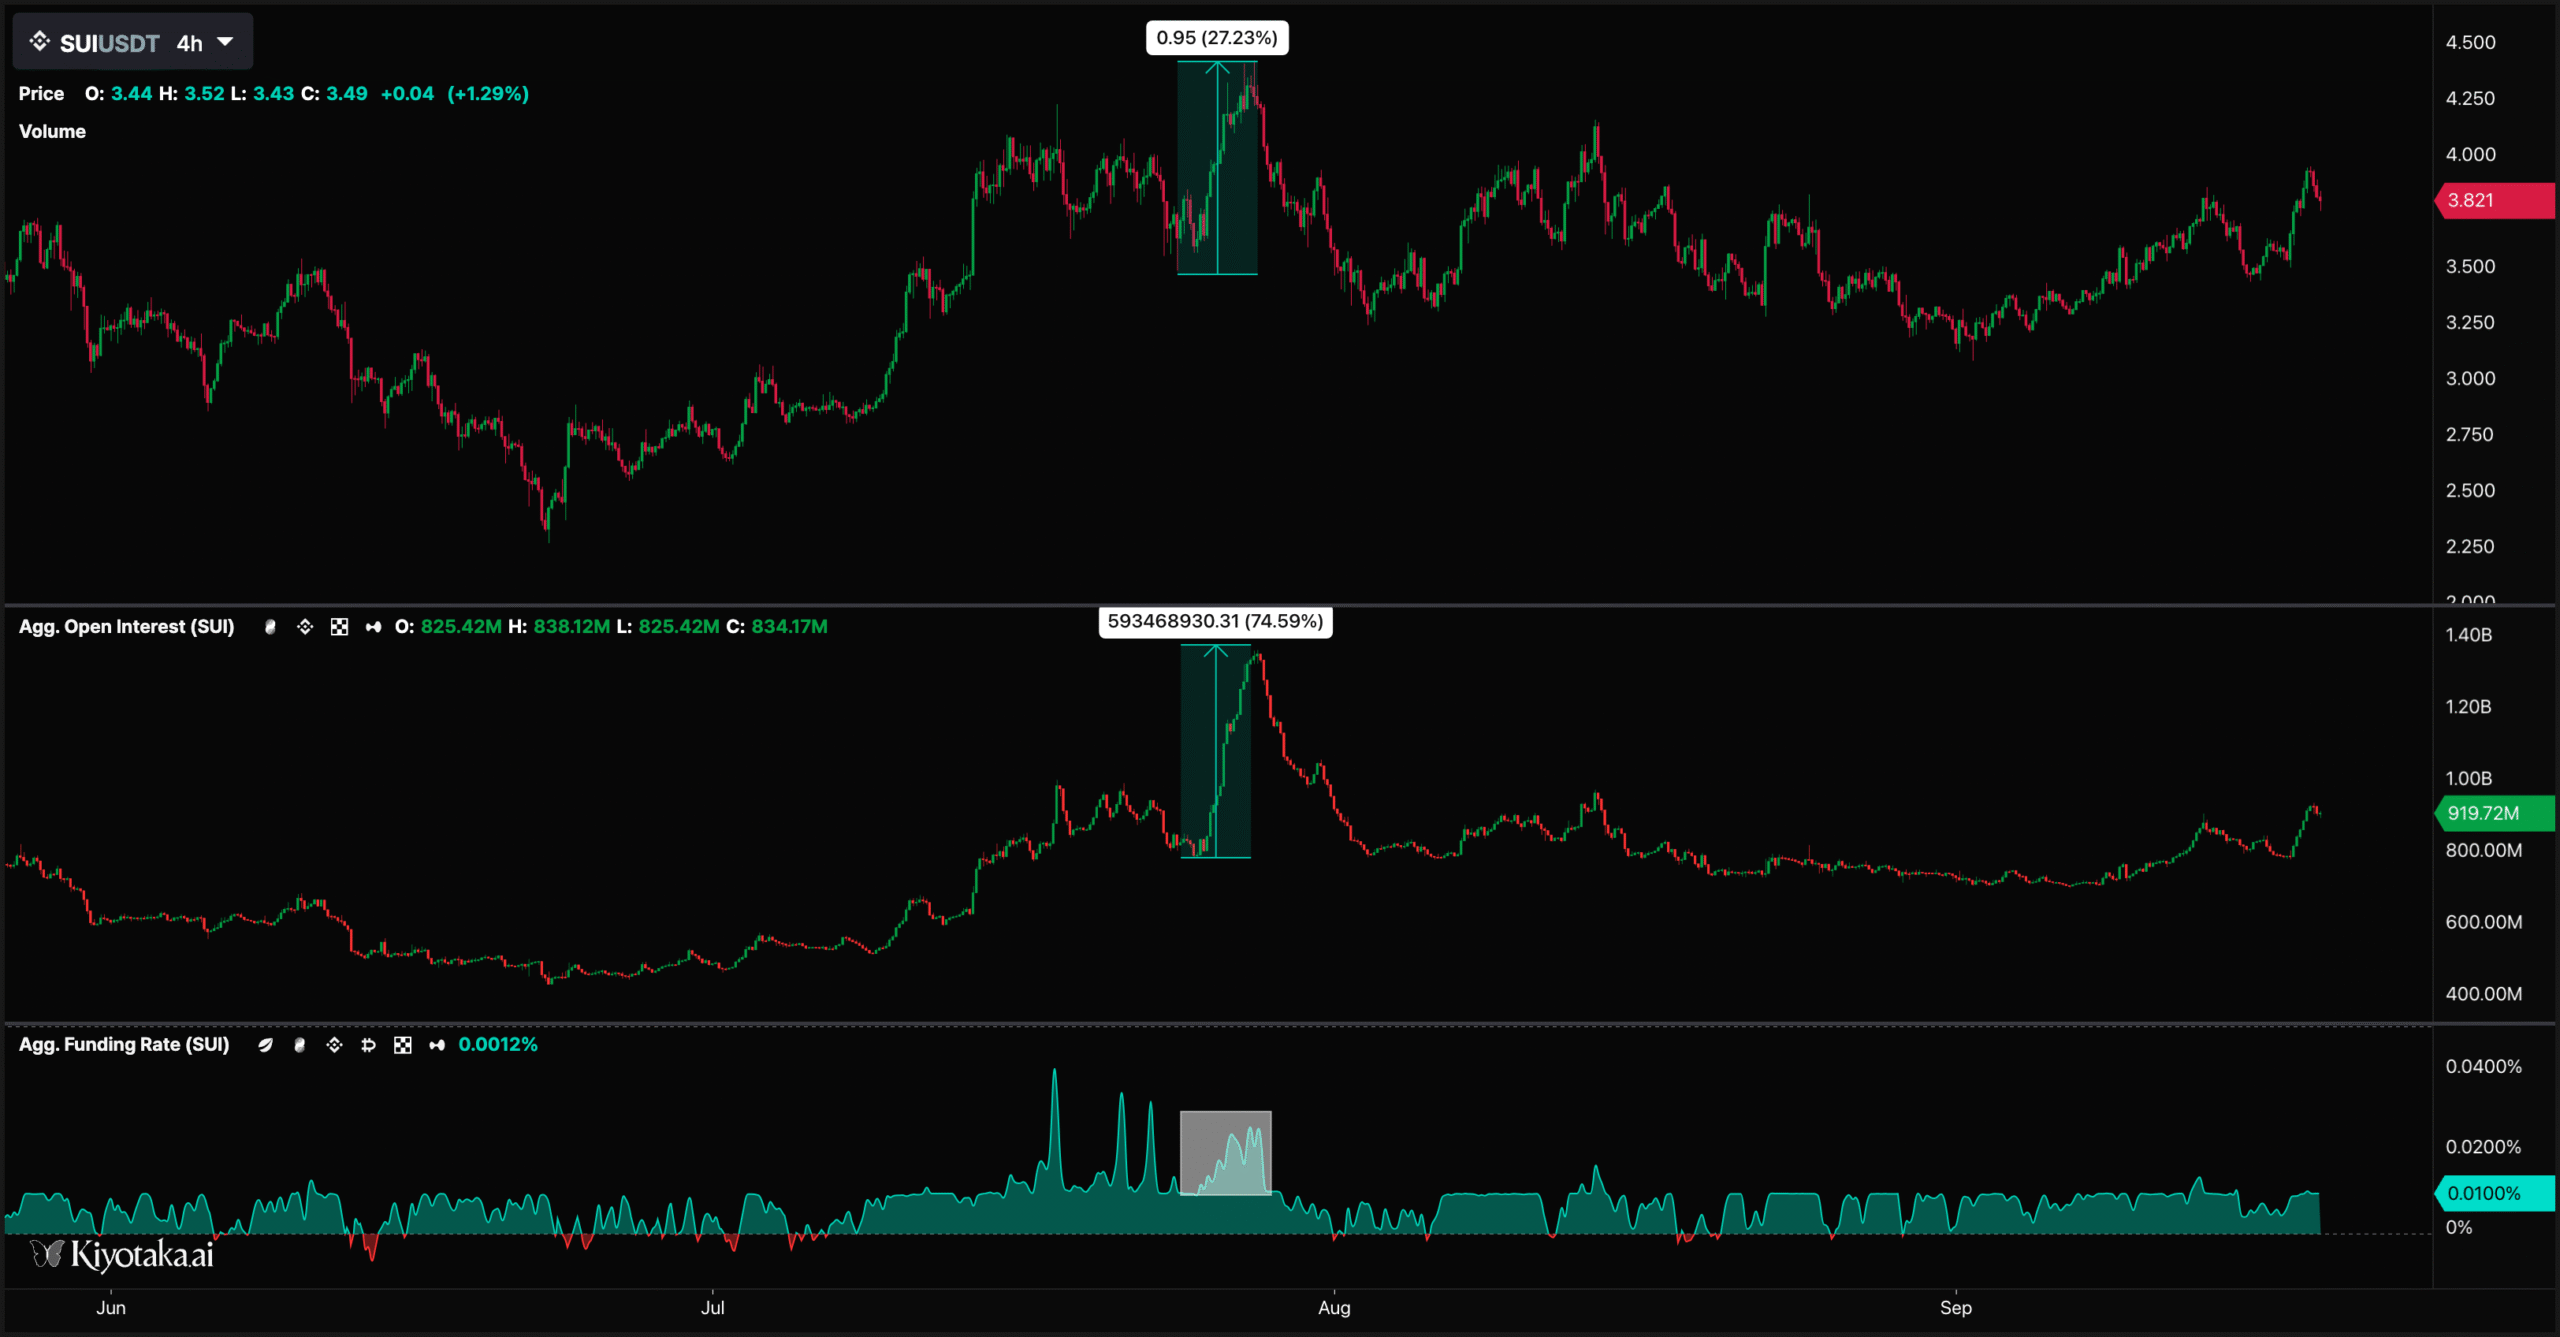
An example using SUI demonstrates the utility of open interest and funding rates in identifying potential market froth.
As the price surged by approximately 30%, open interest nearly doubled, and funding rates spiked to their highest recent levels.
This suggests excessive market eagerness in betting on a breakout, making a mean-reversion more probable.
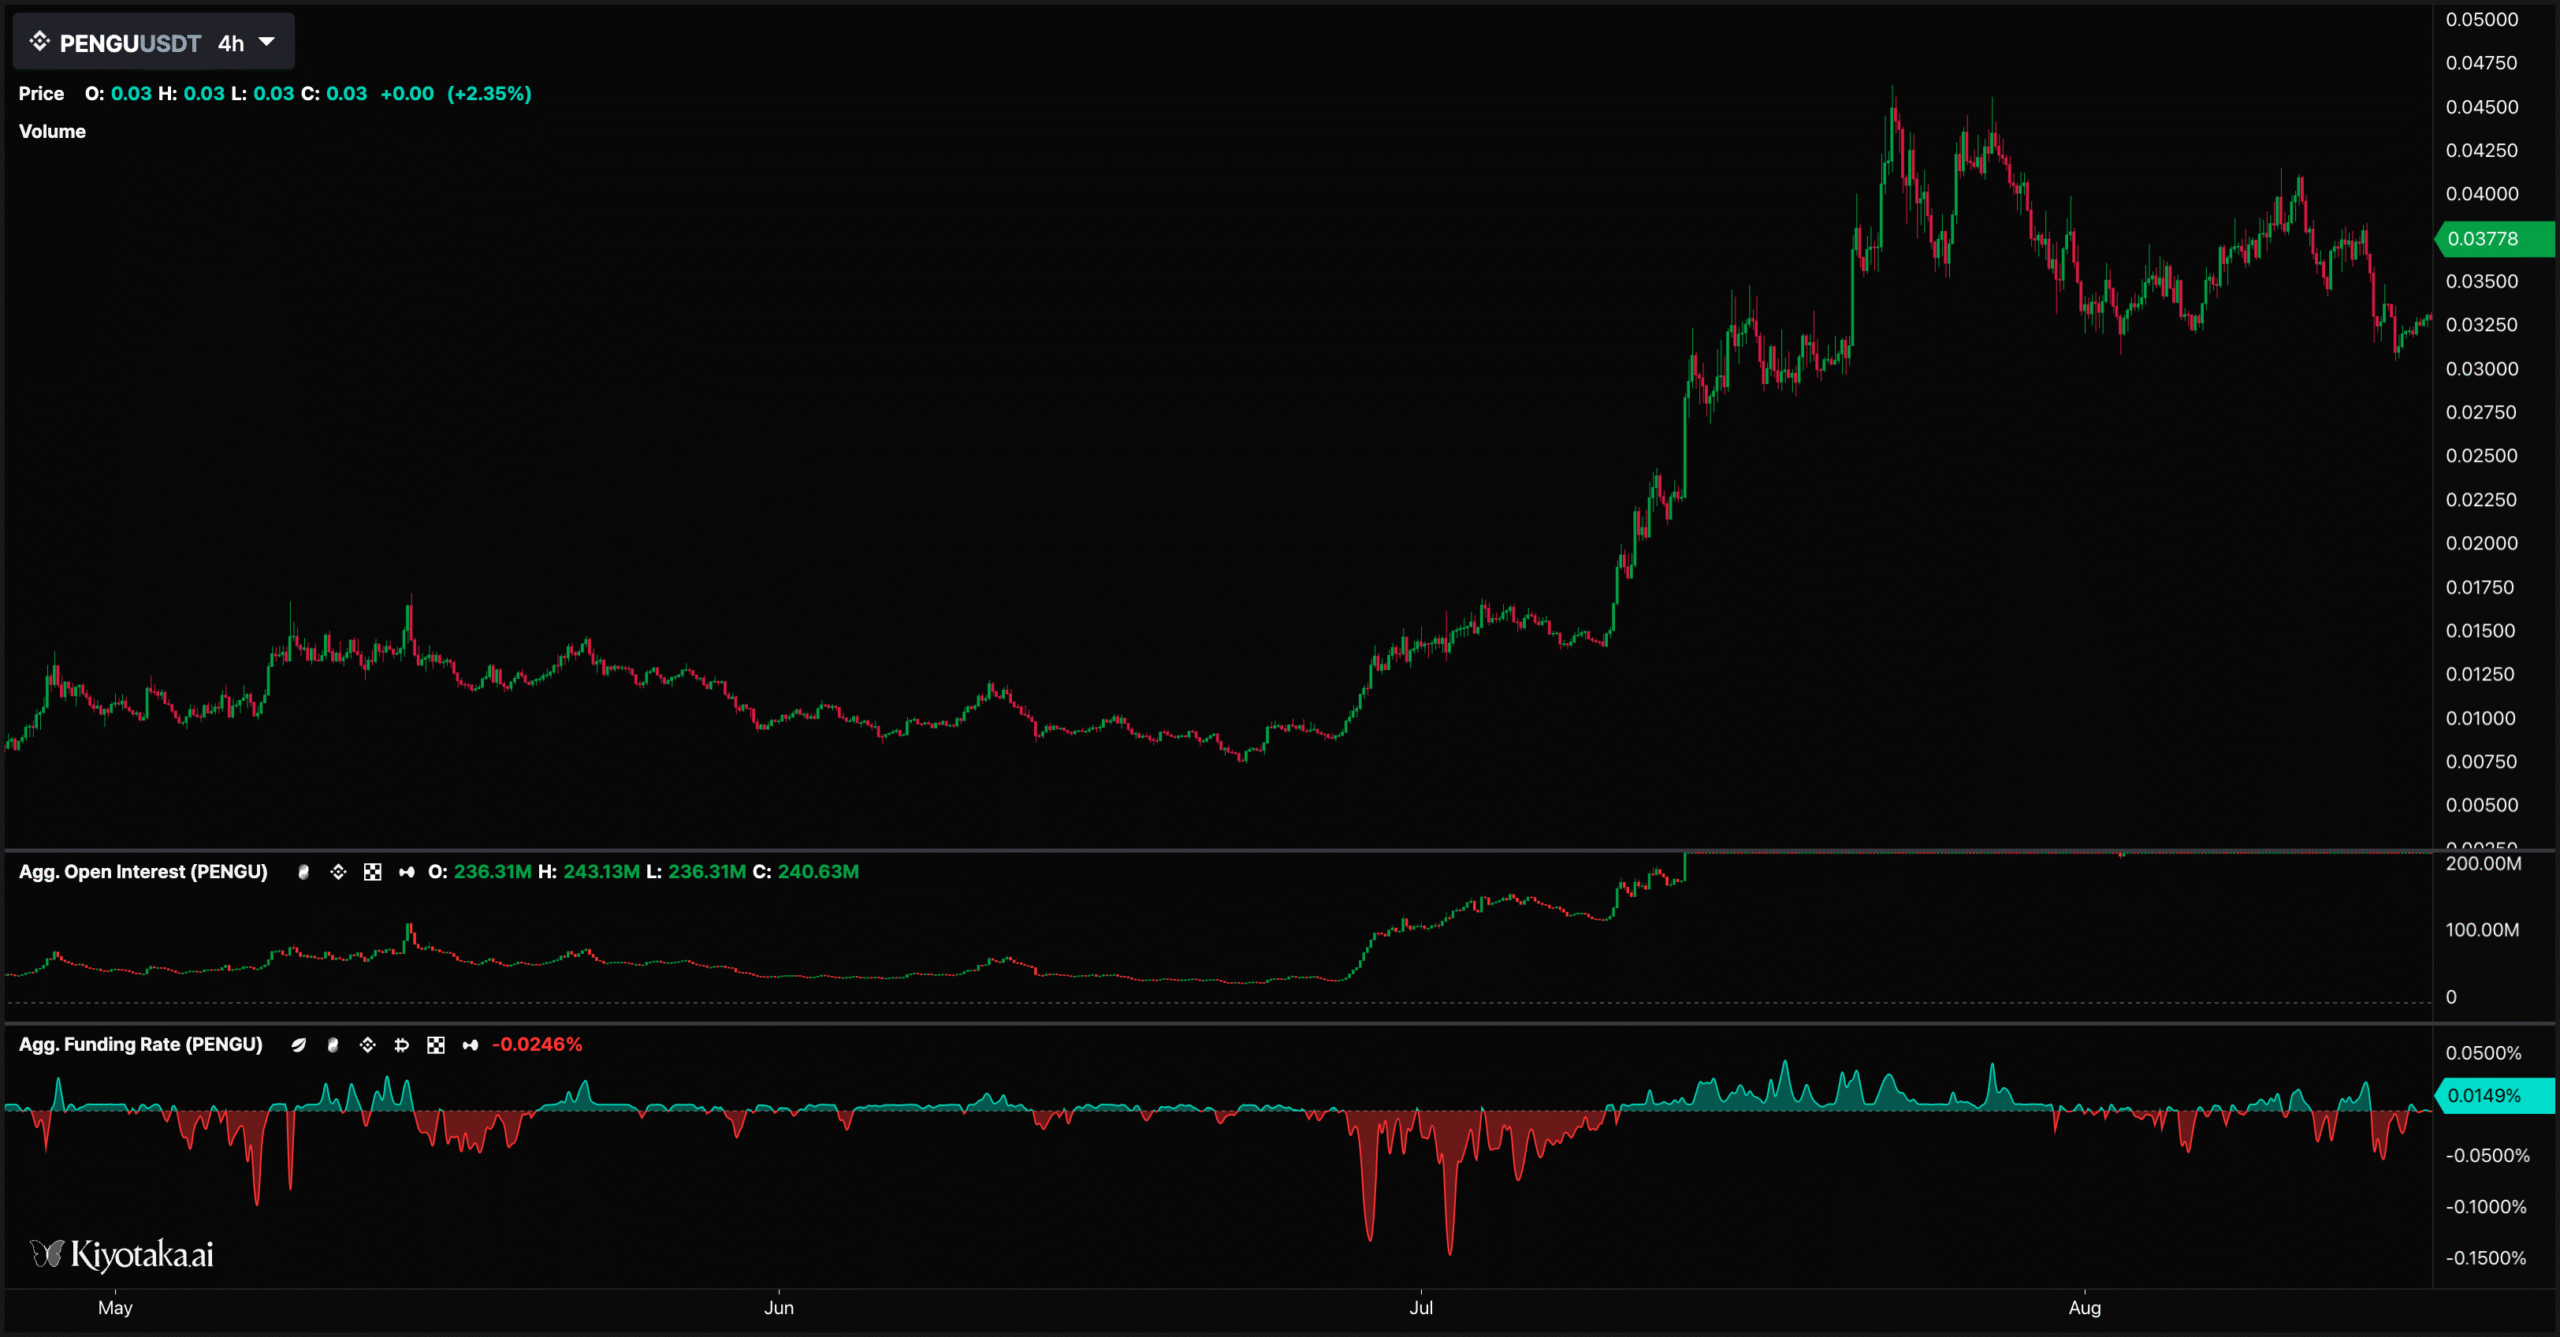
Consider the breakout on Pengu.
Price rallied with open interest, and funding rates remained negative. This suggests significant spot demand (as spot is trading above perpetuals), indicating a healthy start to a new trend.
Liquidations
Liquidations offer valuable insights into market dynamics.
You’re likely familiar with liquidations, but in essence, when using leverage, your position has a liquidation price at which the exchange will automatically close your trade.
These liquidations often cluster in specific areas, signaling the potential end of price movements as many algorithms and traders are ready to provide liquidity during these events.
A less commonly discussed aspect of liquidations is observing when the price continues in the same direction even after a large liquidation event. This often indicates a strong trend.
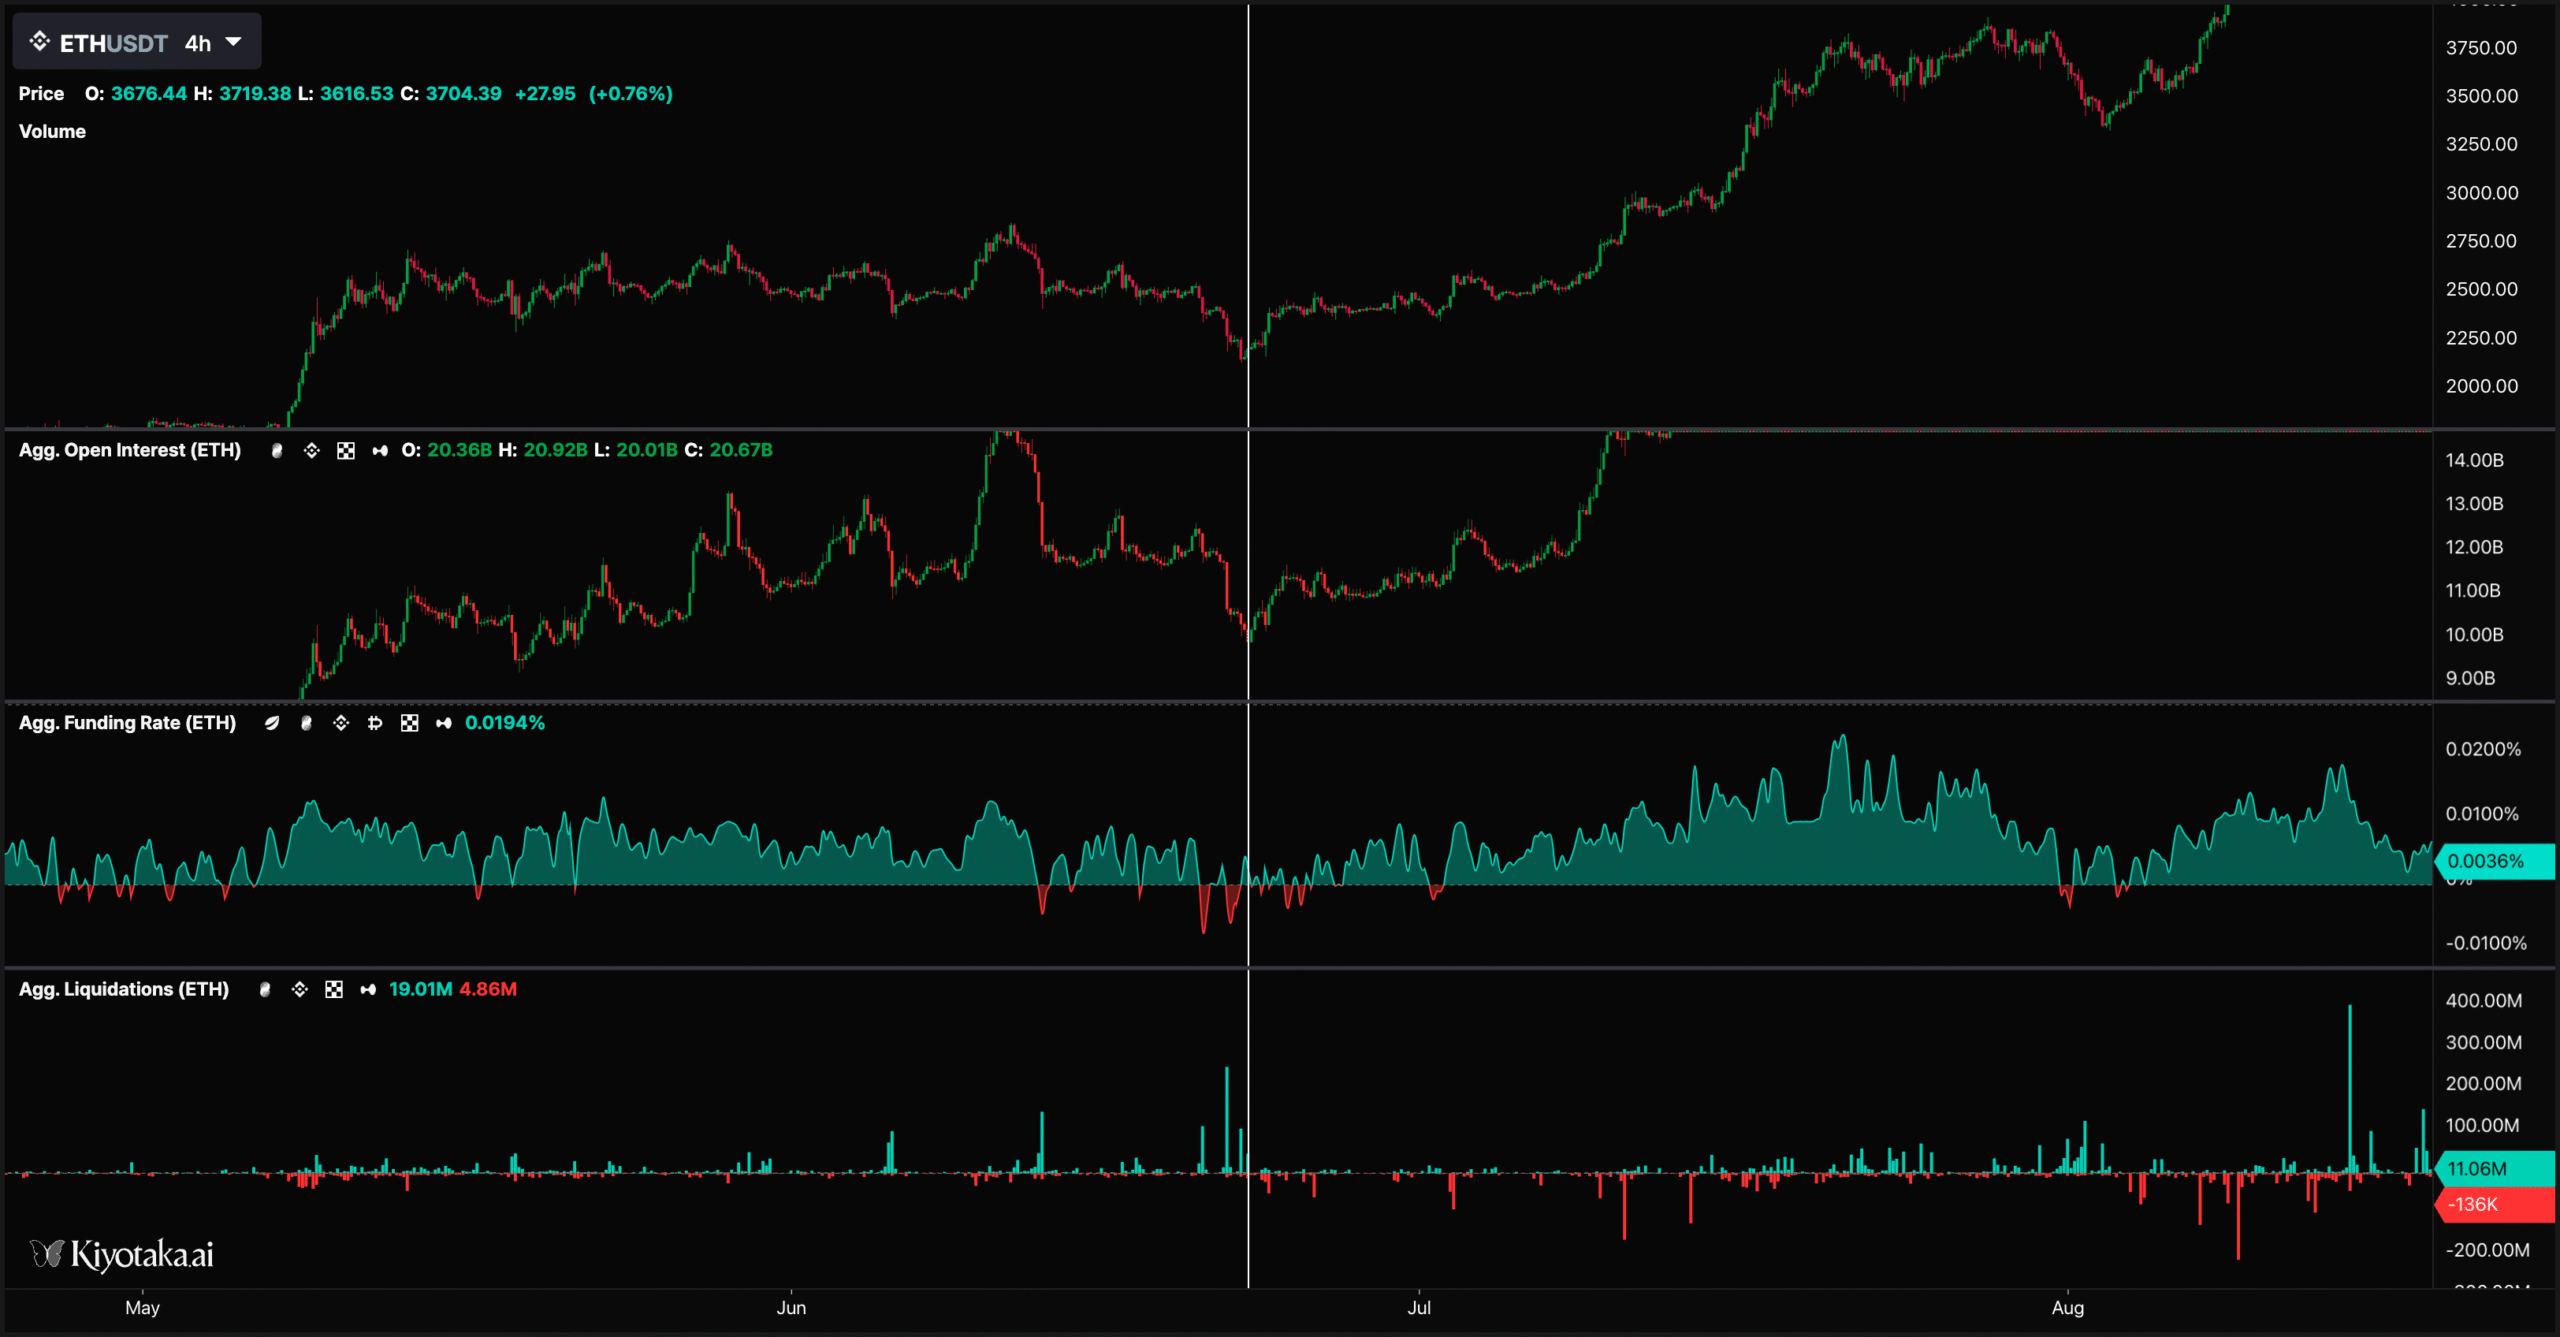
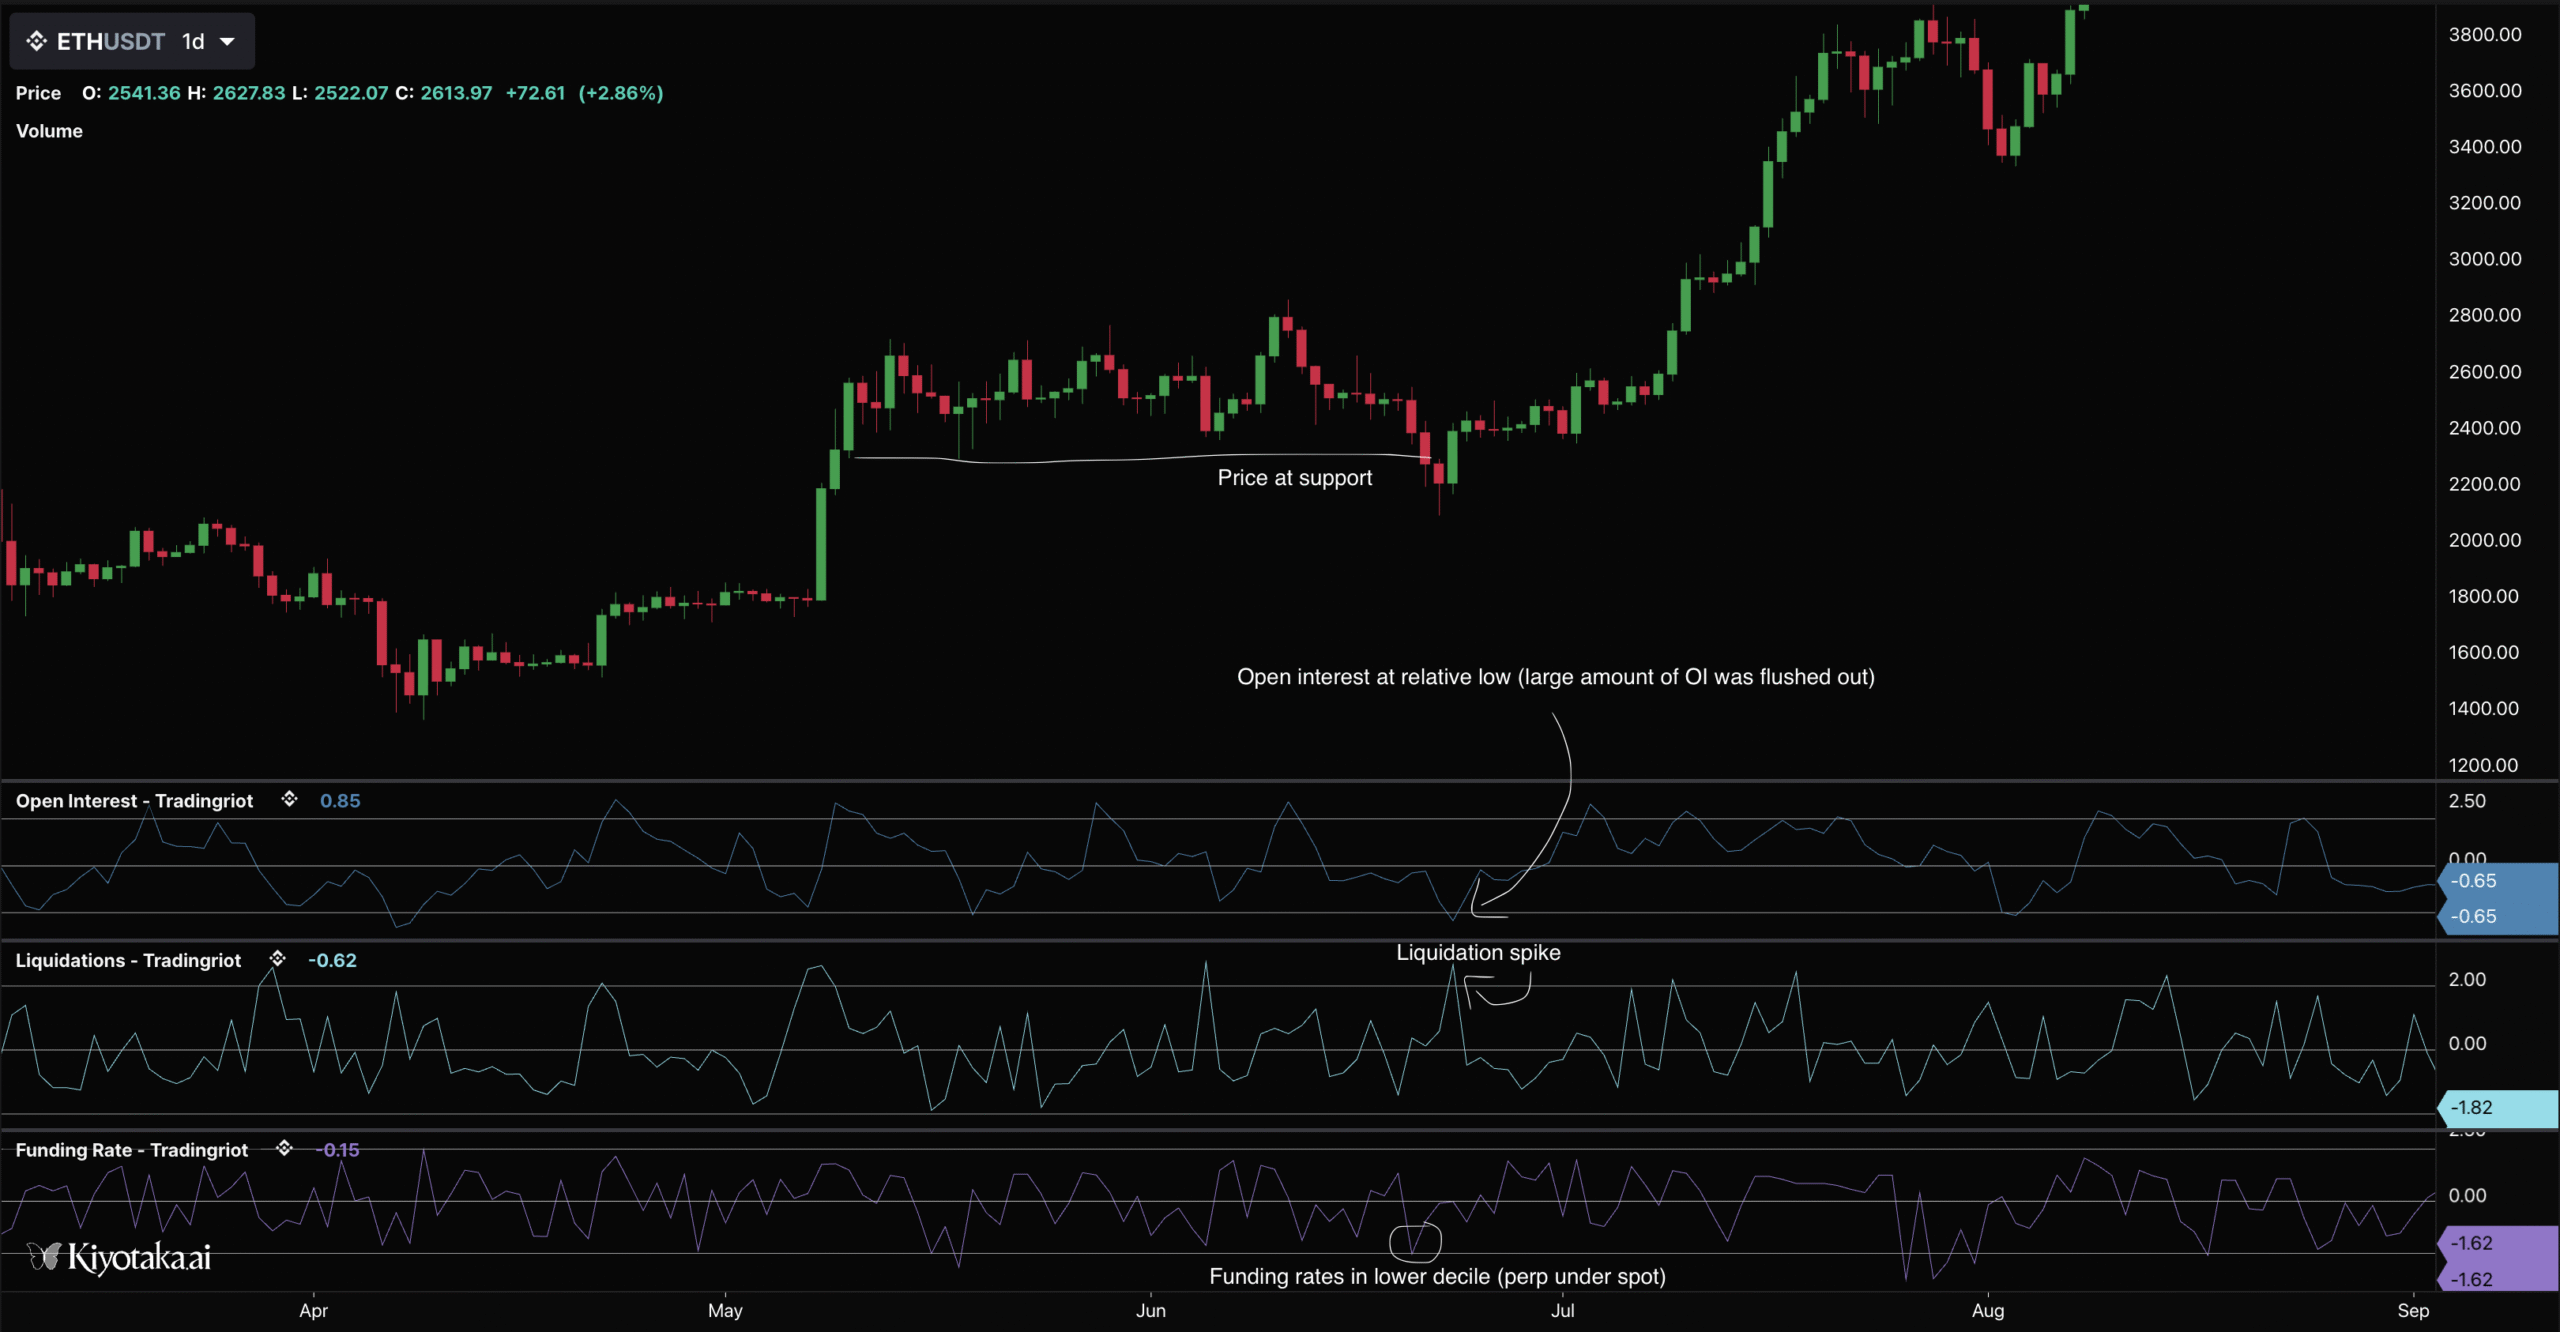
For example, in ETH, a price sell-off accompanied by declining open interest, negative funding rates, and increasing long liquidations provides a very strong signal for mean reversion.
Putting things together
Traders often struggle to quantify significant changes in open interest or determine if liquidations are sufficient to trigger a market reversal.
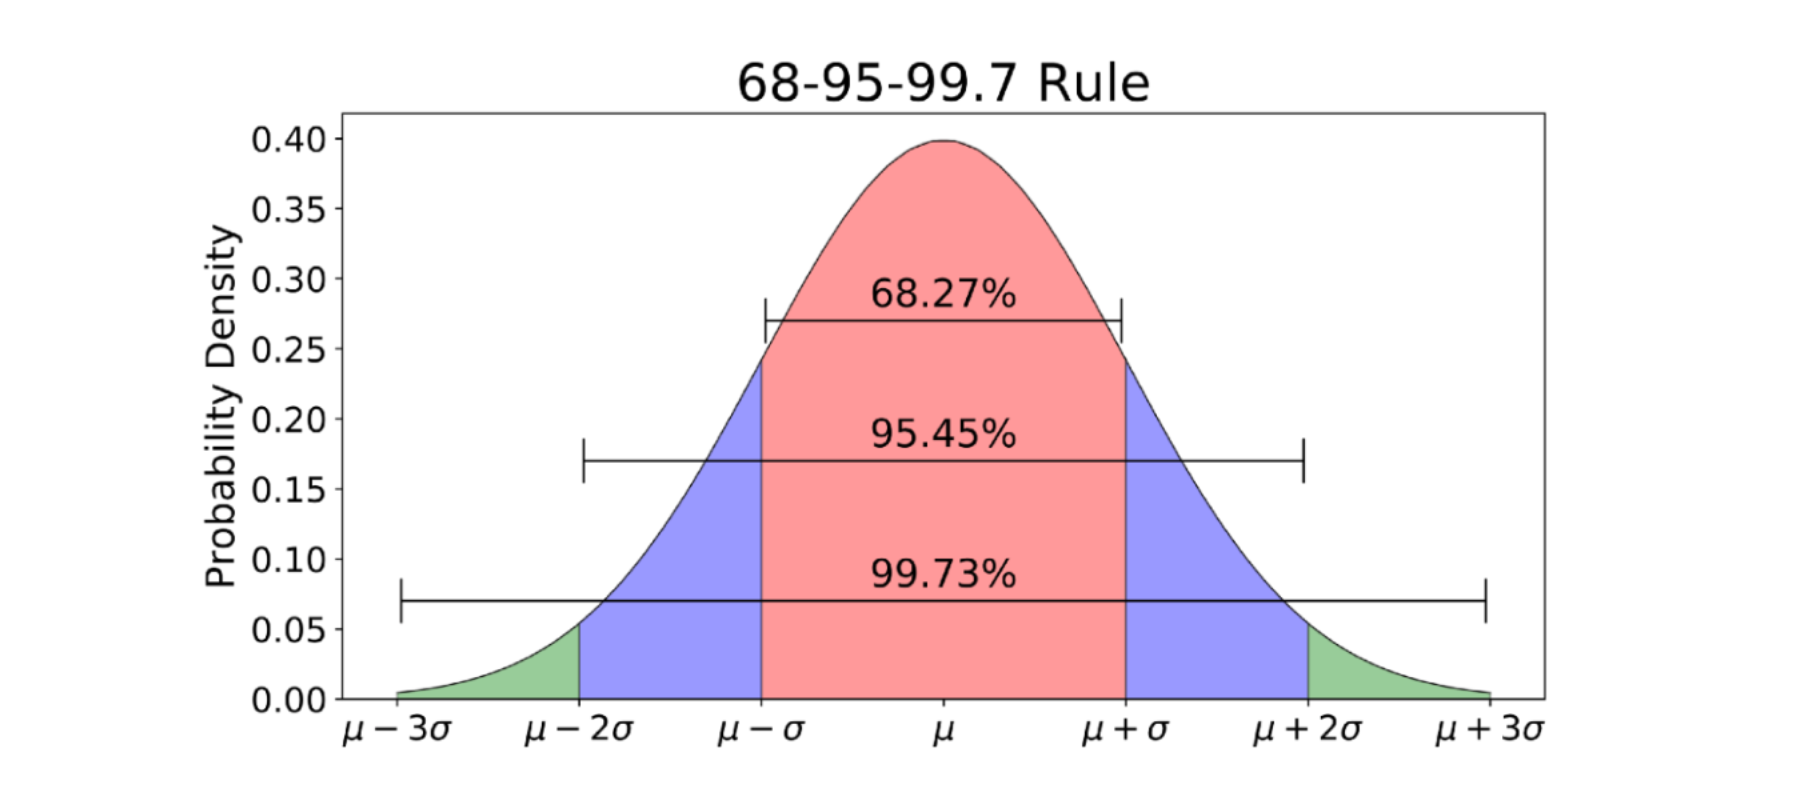
To address this, I’ve developed a set of indicators that utilize Z-scores to highlight extreme deviations from the standard distribution.
These indicators are freely available on Kiyotaka under the community tab; search for my name, abetrade.
These indicators eliminate guesswork, clearly highlighting significant changes in the Z-score, as demonstrated in the Ethereum example.
Spot market data
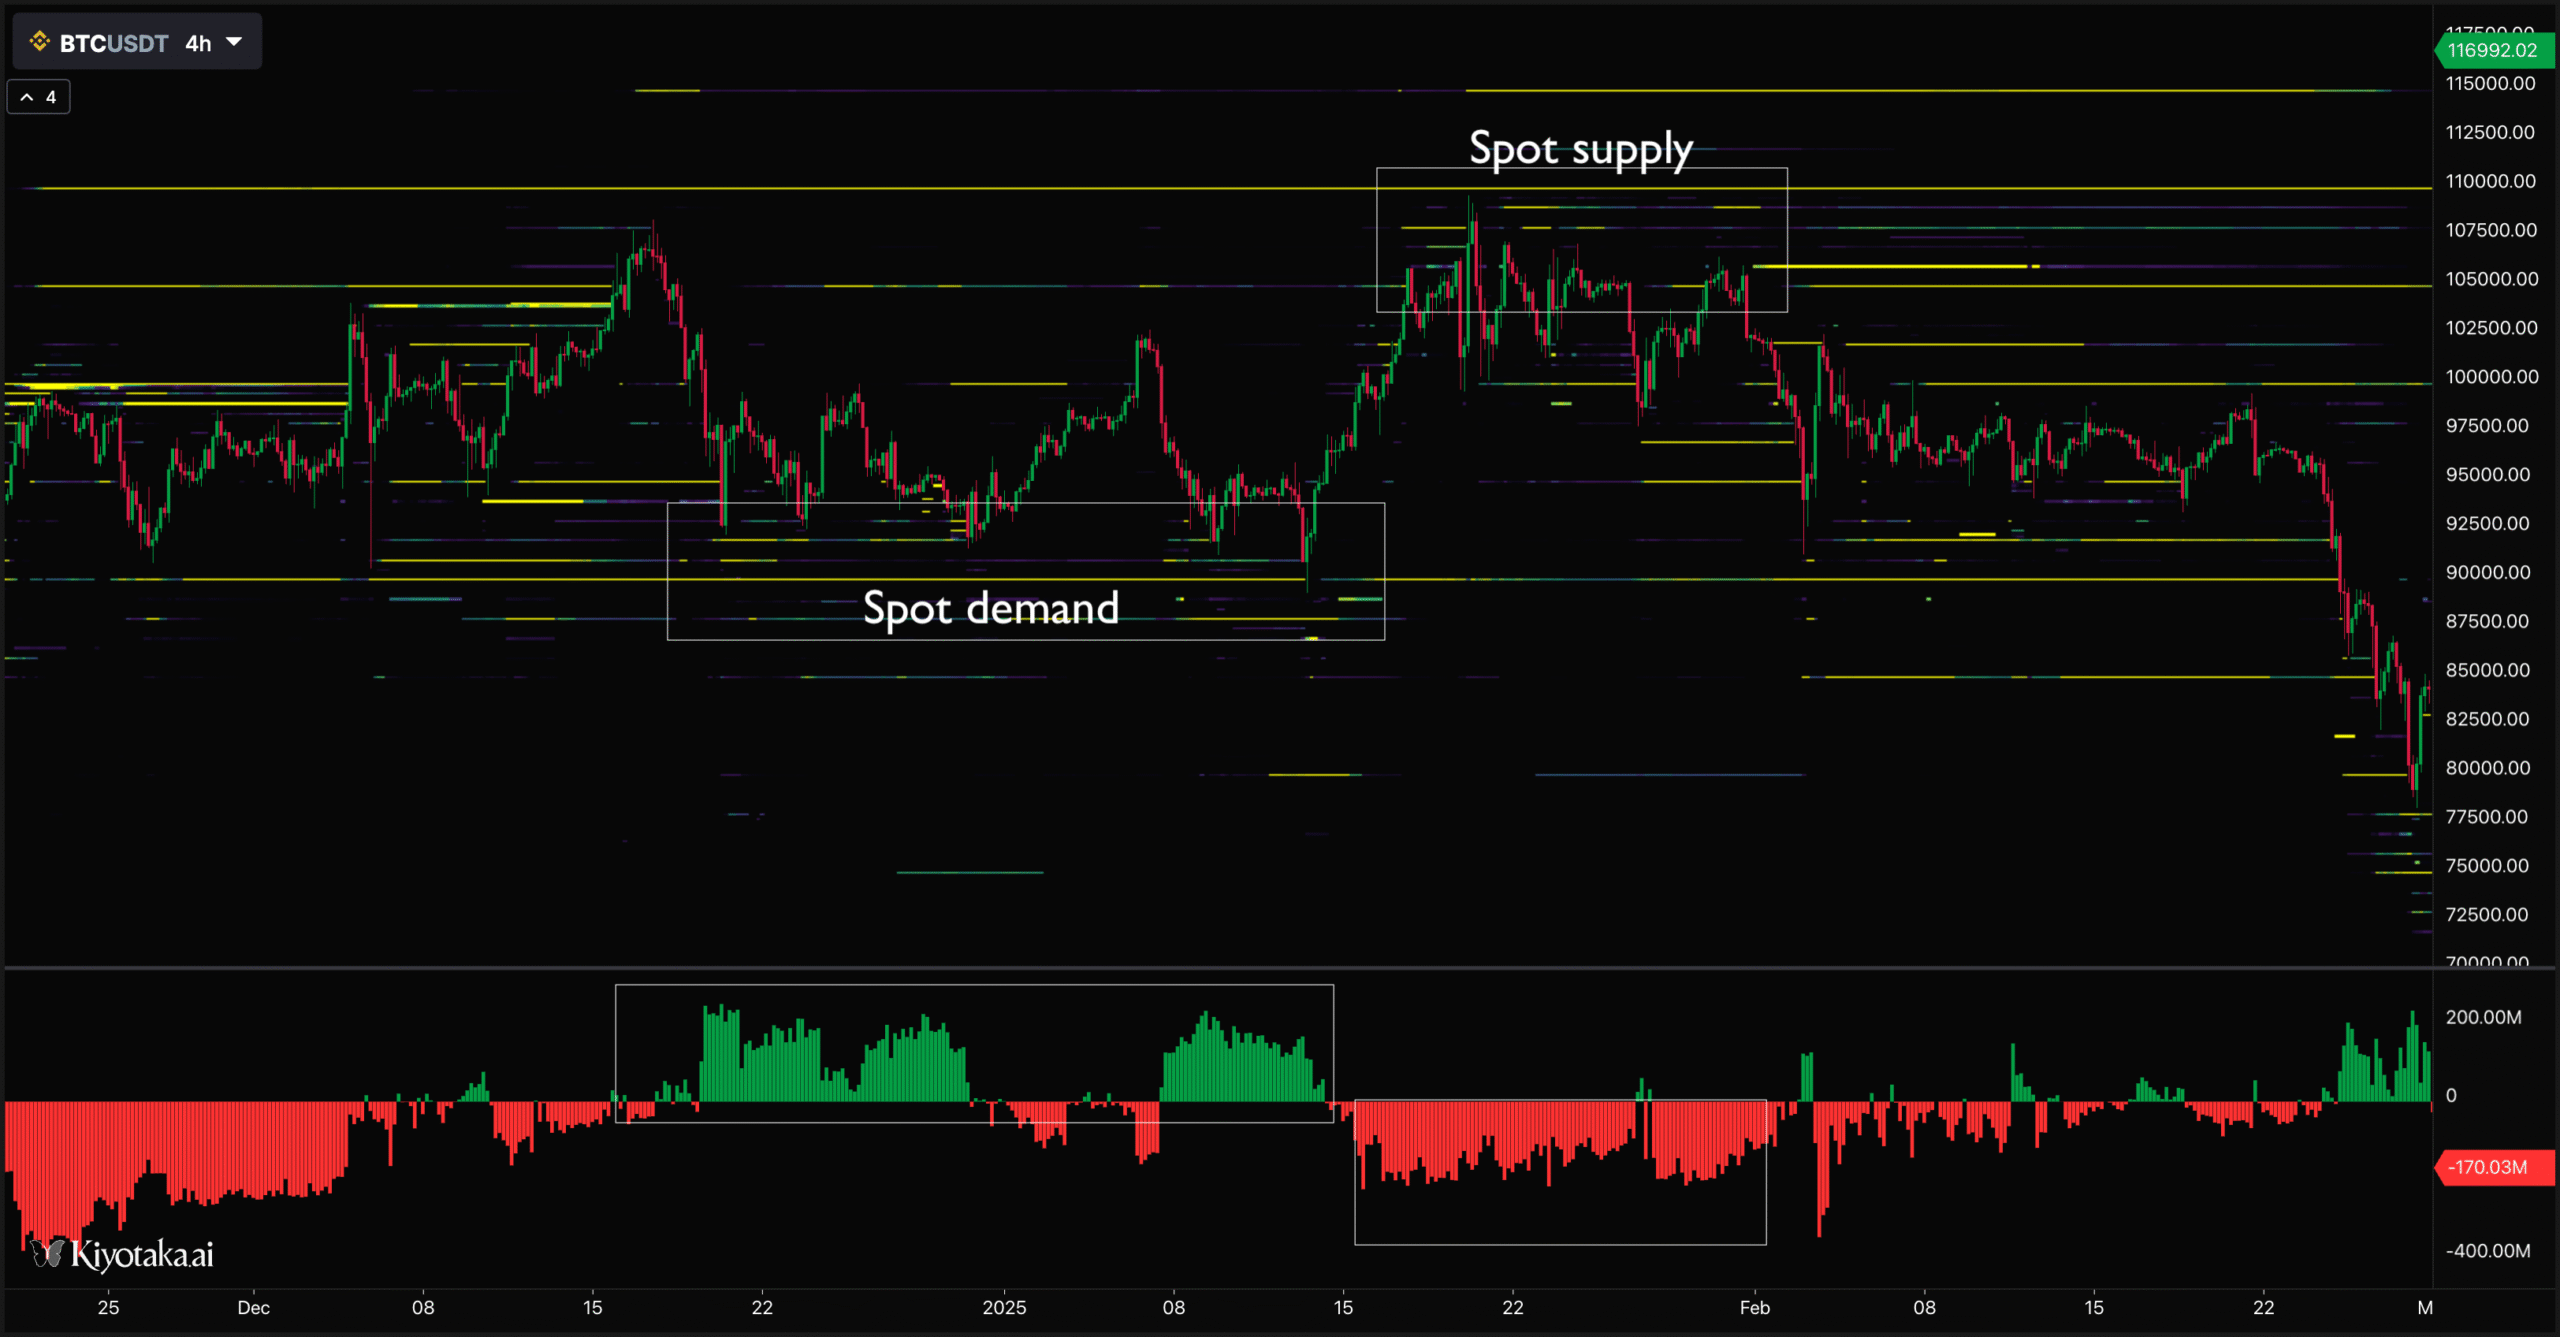
While perpetual contracts have been discussed, the spot market is arguably more significant. Traders capable of executing large spot orders often possess the ability to influence price movement.
Unlike perpetuals, spot market data doesn’t offer open interest to track new positions. However, we can analyze the skew of spot order books to gauge significant demand or supply around the current price.
Some traders apply this analysis to futures, but I believe it’s less reliable there. Futures data is heavily influenced by market makers without a directional view on price, and leveraged markets are more susceptible to spoofing.
Spoofing (placing orders without intent to fill them) is a major concern with these heatmaps. In the spot market, however, you need substantial size to be visible in the order book, and we’re examining the overall “shape” of the order book rather than a single price point.
Logically, if a market has a large number of offers just above the price or bids below, it becomes significantly harder for the price to quickly break through those levels. Therefore, a high skew often indicates range-bound markets or the nascent stages of new trends.
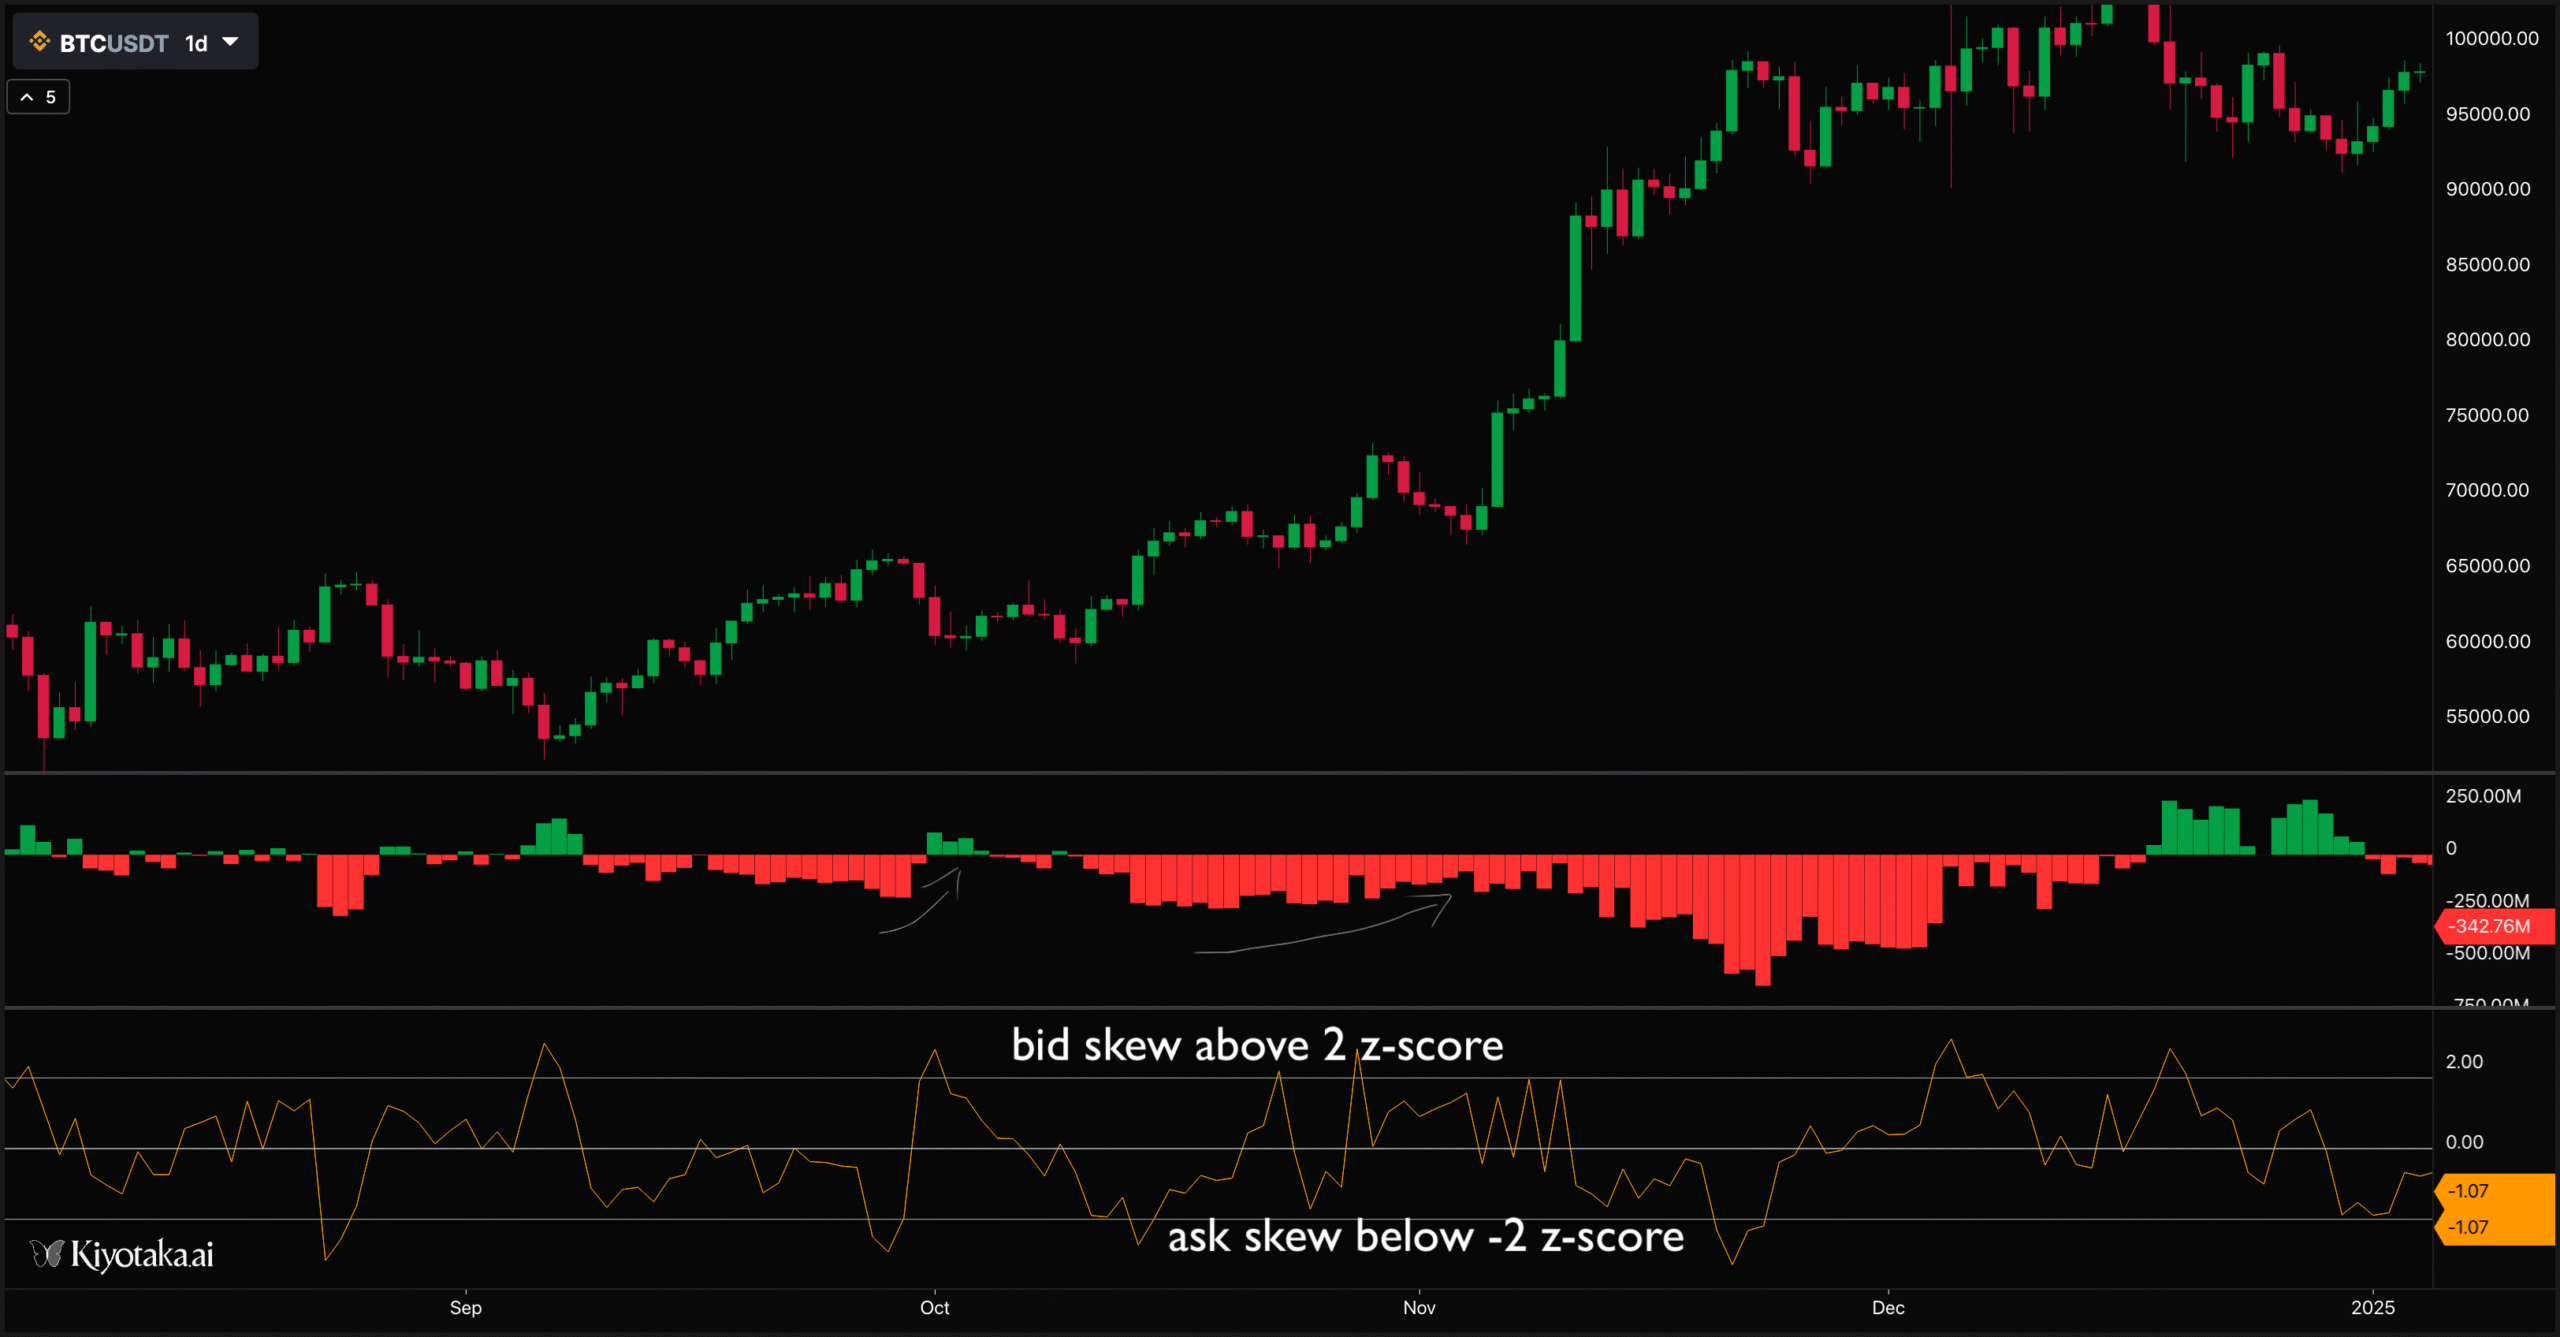
My order book skew Z-score indicator, available on Kiyotaka, functions similarly to perpetual indicators.
While looking at spot skew is effective in range-bound markets, during strong trends, price tends to move through bids and asks without resistance.
This indicator is particularly useful for identifying not only high delta in bids and asks but also situations where one side aggressively pulls orders, creating an unimpeded path for price movement.
Options data
Options data completes the market positioning picture.
This is currently only viable for Bitcoin and ETH due to significant volumes on Deribit, though other coins may gain popularity in the future.
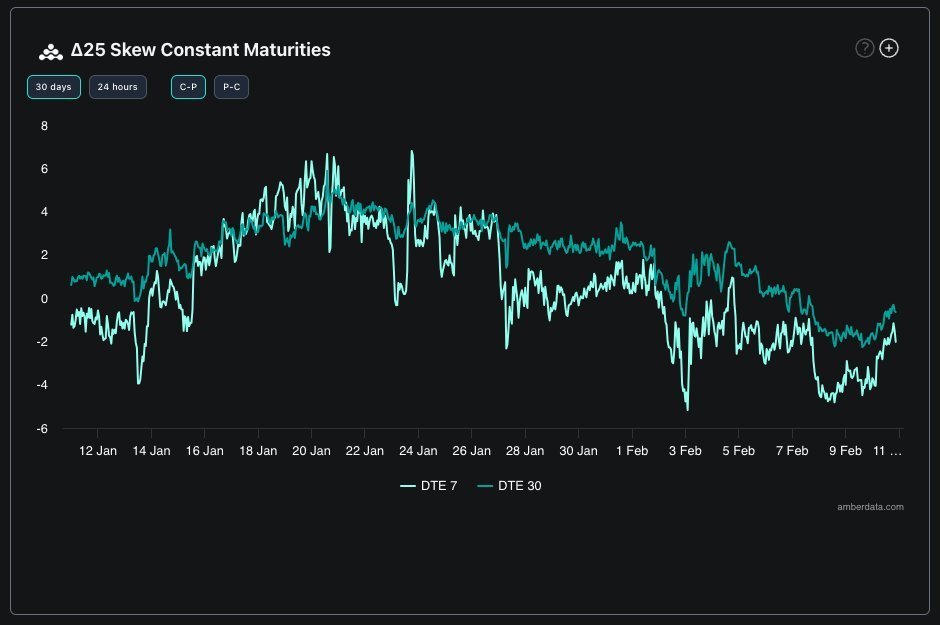
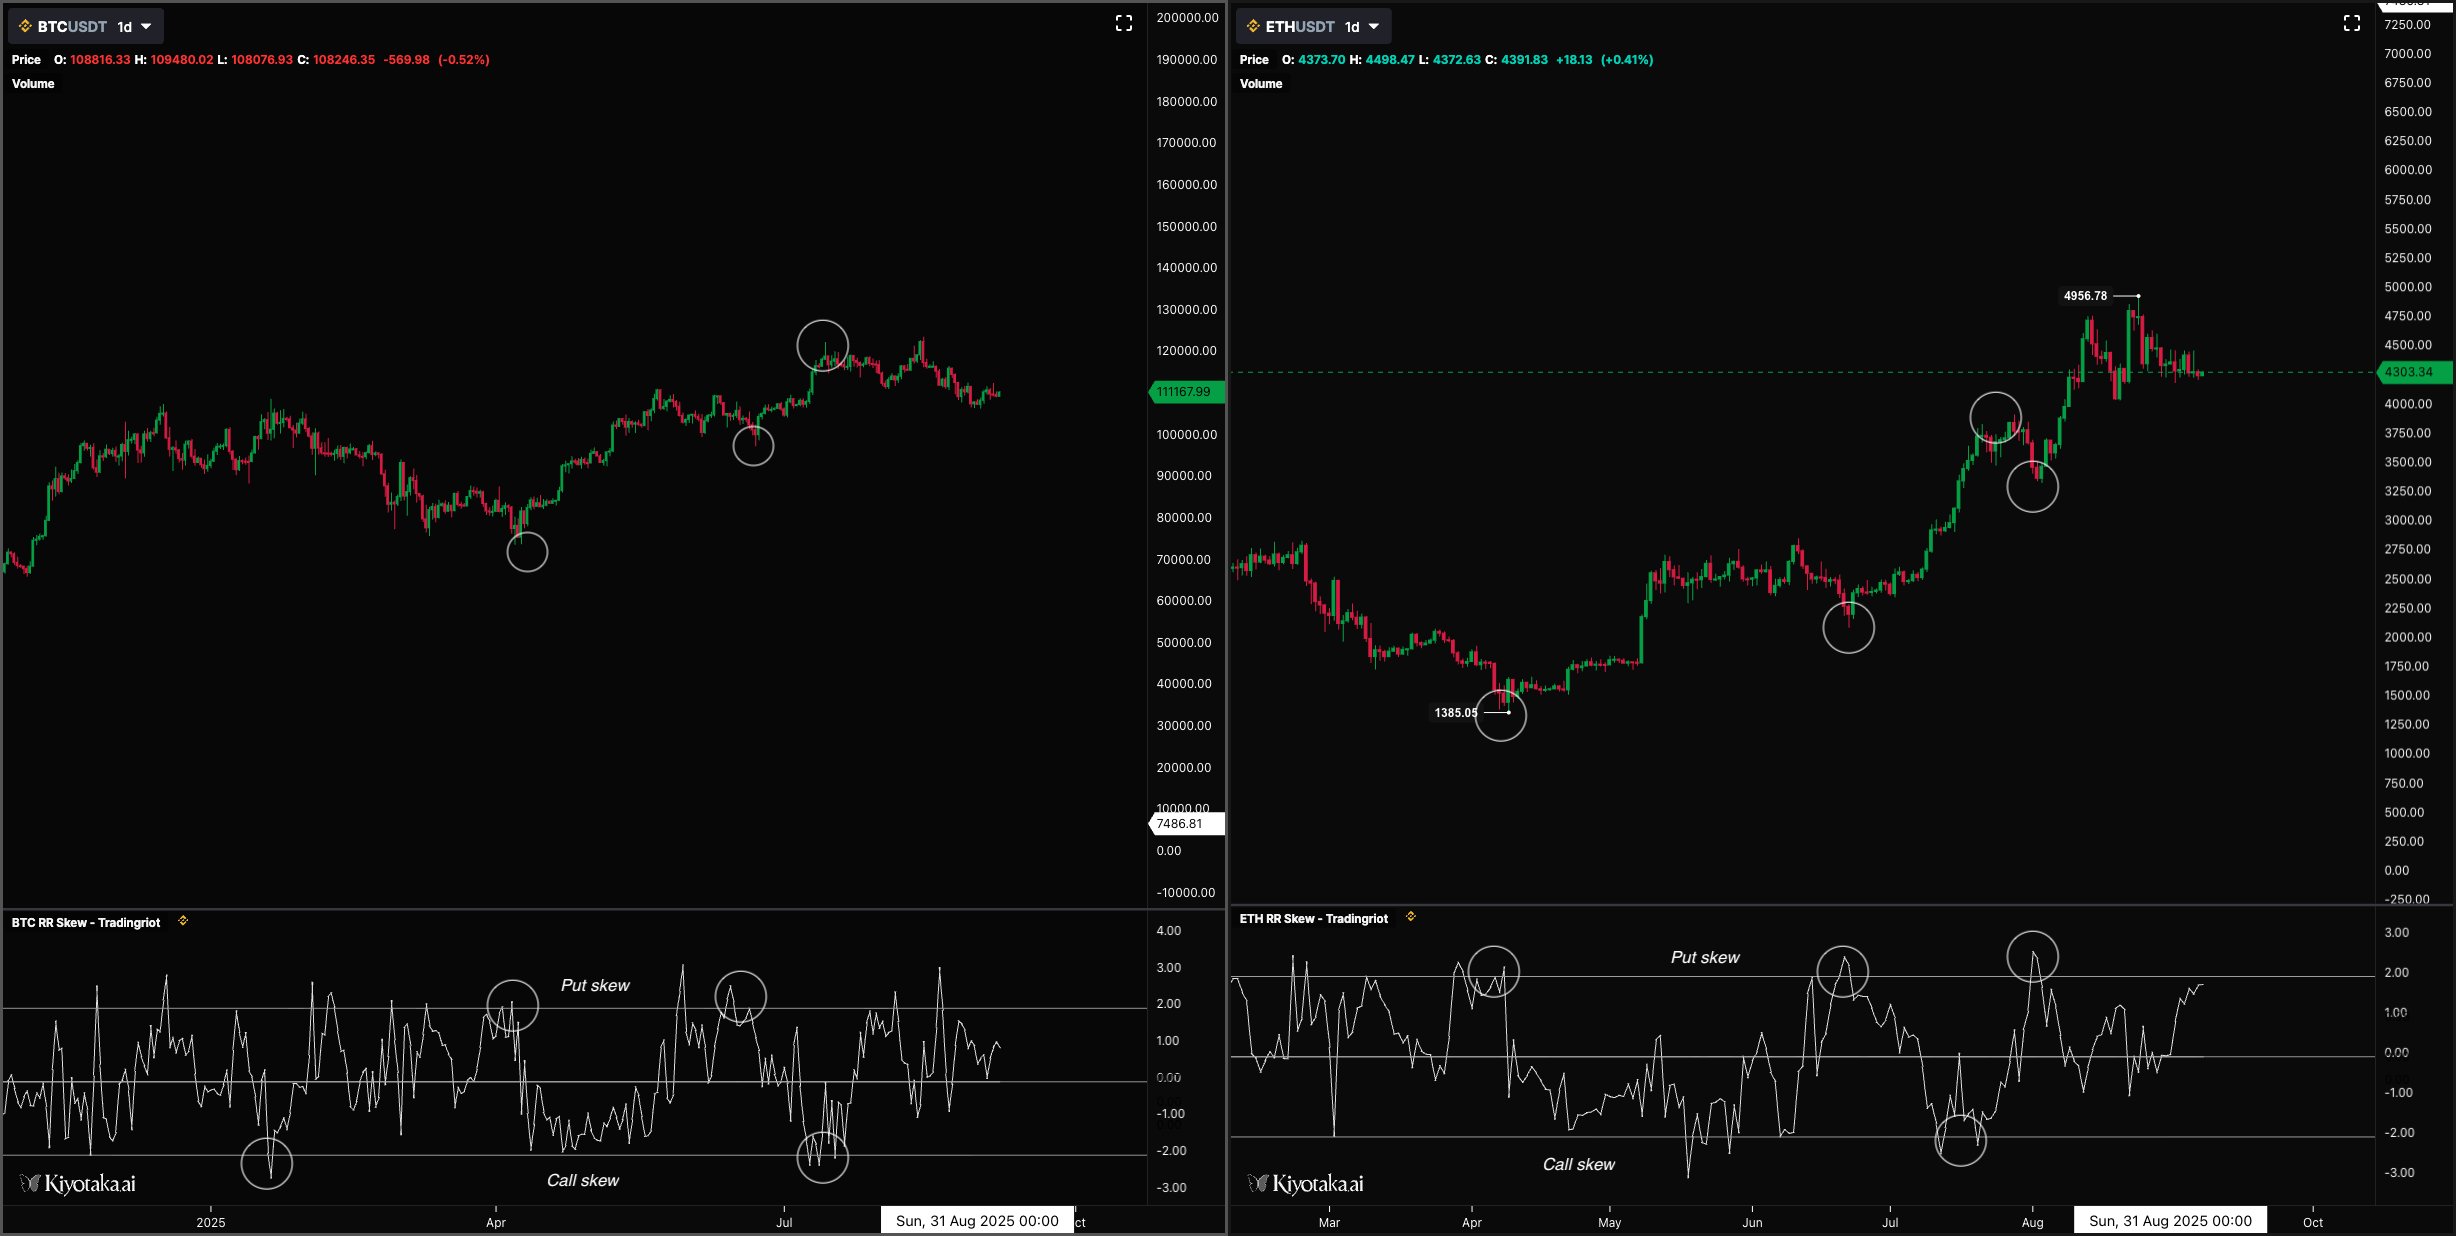
When examining the options market, focus on 25-delta risk reversals.
Risk reversal skew is calculated by subtracting the implied volatility of a put from the implied volatility of a call with the same delta.
Implied volatility is a forward-looking indicator of expected future volatility, while delta represents how much an option’s price changes for every $1 change in the underlying asset (calls have a delta between 0 and 1; puts have a delta between 0 and -1).

Understanding the 25-delta option is key for gauging market sentiment and options trading. It represents the midpoint of the volatility skew, sitting between at-the-money (50-delta) and far out-of-the-money (0-delta) options, offering insight into moderate price movement expectations.
Even for non options traders, grasping volatility skew, and thus the 25-delta’s importance, reveals market dynamics. Skew acts as a sentiment indicator: increased demand for out-of-the-money puts (higher implied volatility, delta closer to 25 or 50) signals bearish sentiment and downside anticipation. Conversely, high demand for out-of-the-money calls indicates bullish sentiment and upside expectations. Observing implied volatility shifts across deltas helps discern market concerns.
Option traders can directly trade skew. Even if you don’t trade options, understanding skew is invaluable as it serves as an excellent sentiment indicator, revealing high demand for either puts or calls.
Understanding “Trading Skew” and Market Extremes in Crypto
Trading skew differs based on markets, crypto often sees success in “fading the extremes” when it comes to trading skew.
For a deeper dive, my Risk Reversal Z-score indicator, available in Kiyotaka, helps identify these extremes.
- High Call Skew (demand for calls): Indicated by a Z-score below -2.
- High Put Skew (demand for puts): Indicated by a Z-score above 2.
Conclusion
This approach outlines my method for determining bias in the crypto market.
It’s important to remember that these data points are not direct buy or sell signals. The market often takes time before the anticipated move occurs, so it’s best to combine these insights with simple technical analysis for entry and exit points.
The most favorable trades, though rare, emerge when all indicators align in the same direction. This convergence allows for increased position sizing and confident trading.