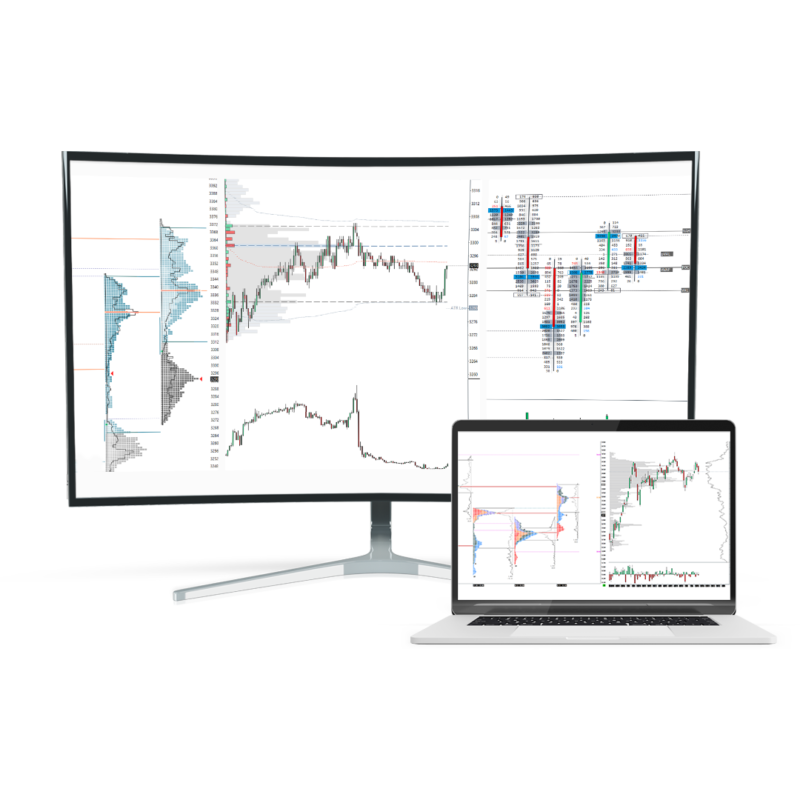

Trading with Volume Profile: Everything you need to know
There are three key components in every auction.
The price that advertises the opportunity.
A time that regulates price opportunity.
And volume that measures the success or failure of the auction.
From these three components of the Auction Market Theory, the volume is the most important in the current age of trading.
By looking at the volume, we can see where other market participants were interested in doing business, which can significantly help us make an educated decision in our trading.
This article is the third part of the series. To fully understand all the concepts mentioned here, I highly recommend reading the Auction Market Theory and Market profile articles before this one.
If you like this article, read the rest of the blog or join the Tradingriot Bootcamp for a comprehensive video course, access to private discord and regular updates.
For those who are looking for a new place for trading crypto, make sure to check out Woo. If you register using this link and open your first trade, you will get a Tier 1 fee upgrade for the first 30 days, and we will split commissions 50/50, which means you will get 20% of all your commissions back for a lifetime. On top of that, you will receive a 20% discount for Tradingriot Bootcamp and 100% free access to Tradingriot Blueprint.
What is Volume in trading?
Volume represents the number of contracts or shares of security traded between buyers and sellers for a given period.
In trading stocks, the volume is represented by the number of shares that were traded.
In futures and options markets, the volume is based upon how many contracts were traded.
You can either read the article, or watch the video version below.
Table of Contents
X-axis Volume
Traditionally, the volume is displayed on the X-axis and is used by traders to indicate the strength or weakness of undergoing price movements.
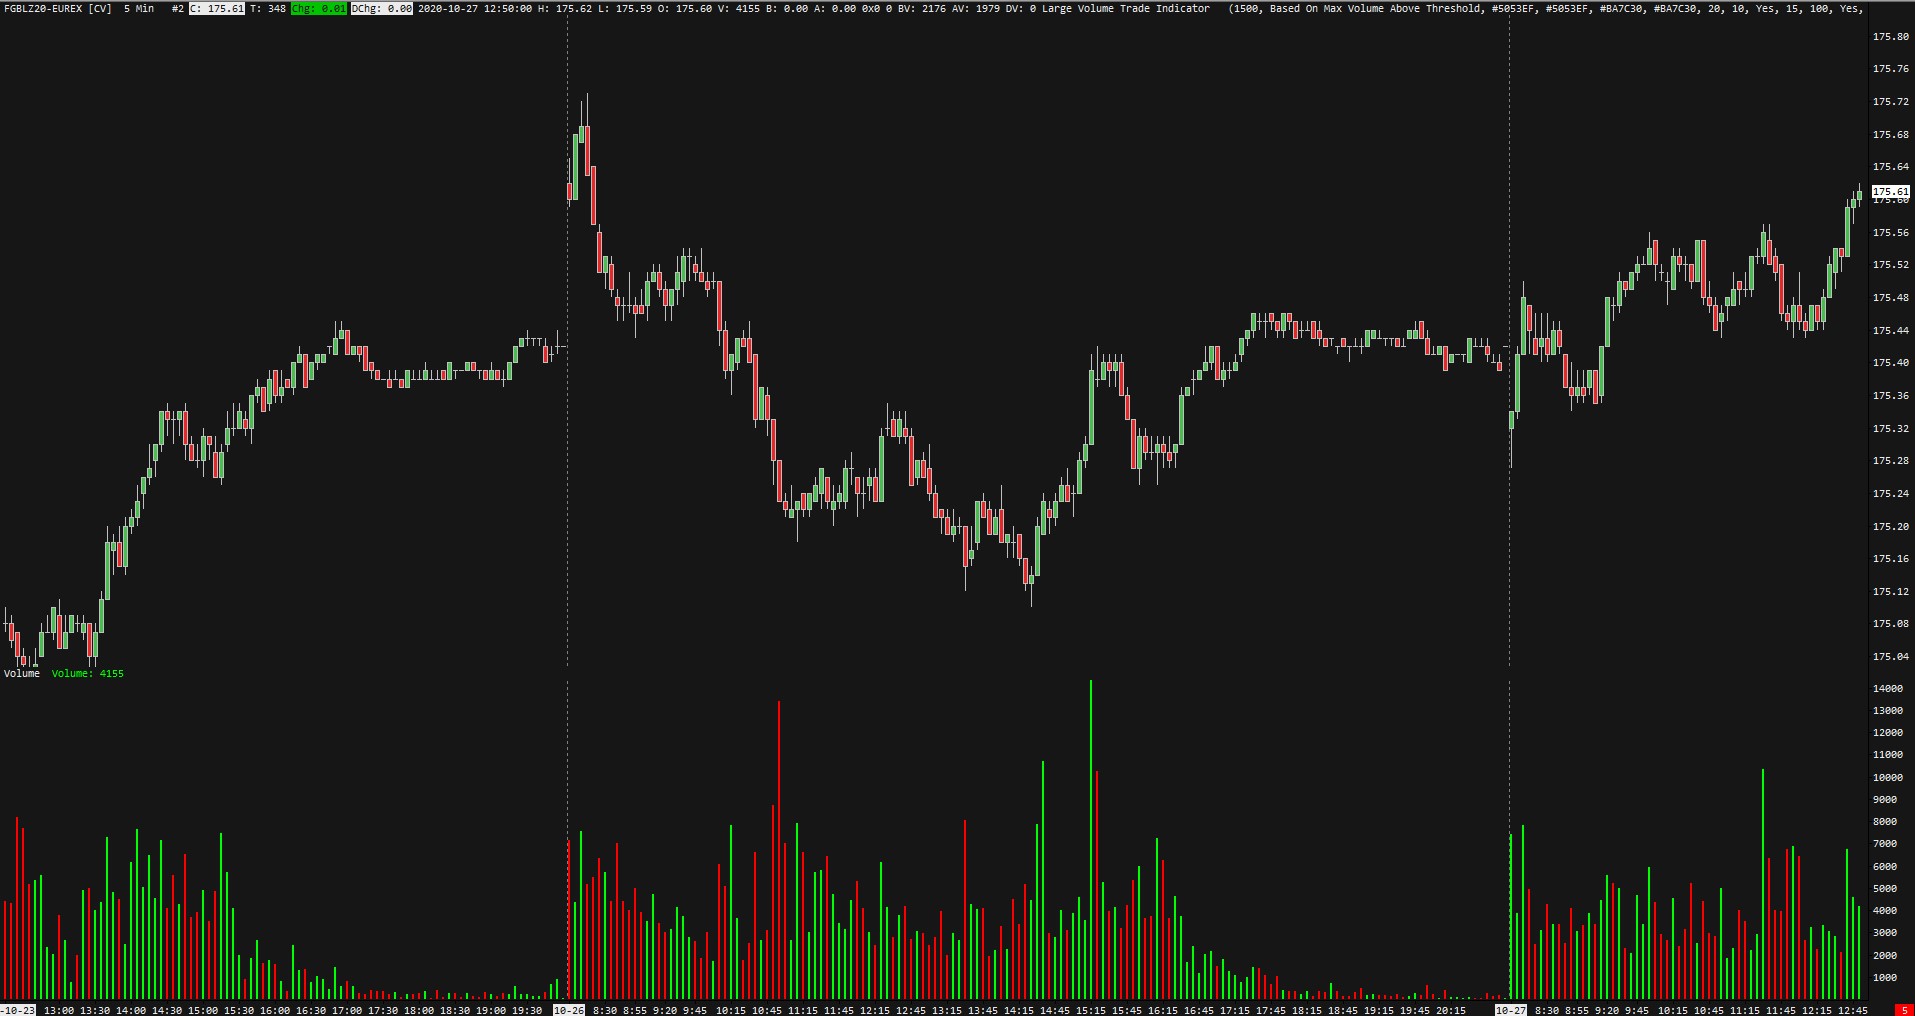
On this 5-minute chart of the German 10-yr Bund, we can see volume displayed on the x-axis below the chart for each 5-minute candle.
On the right side, you can also notice the number of contracts traded.
In the trending market, you want to see volume confirm prices.
That means you should see an increasing volume during trending periods.
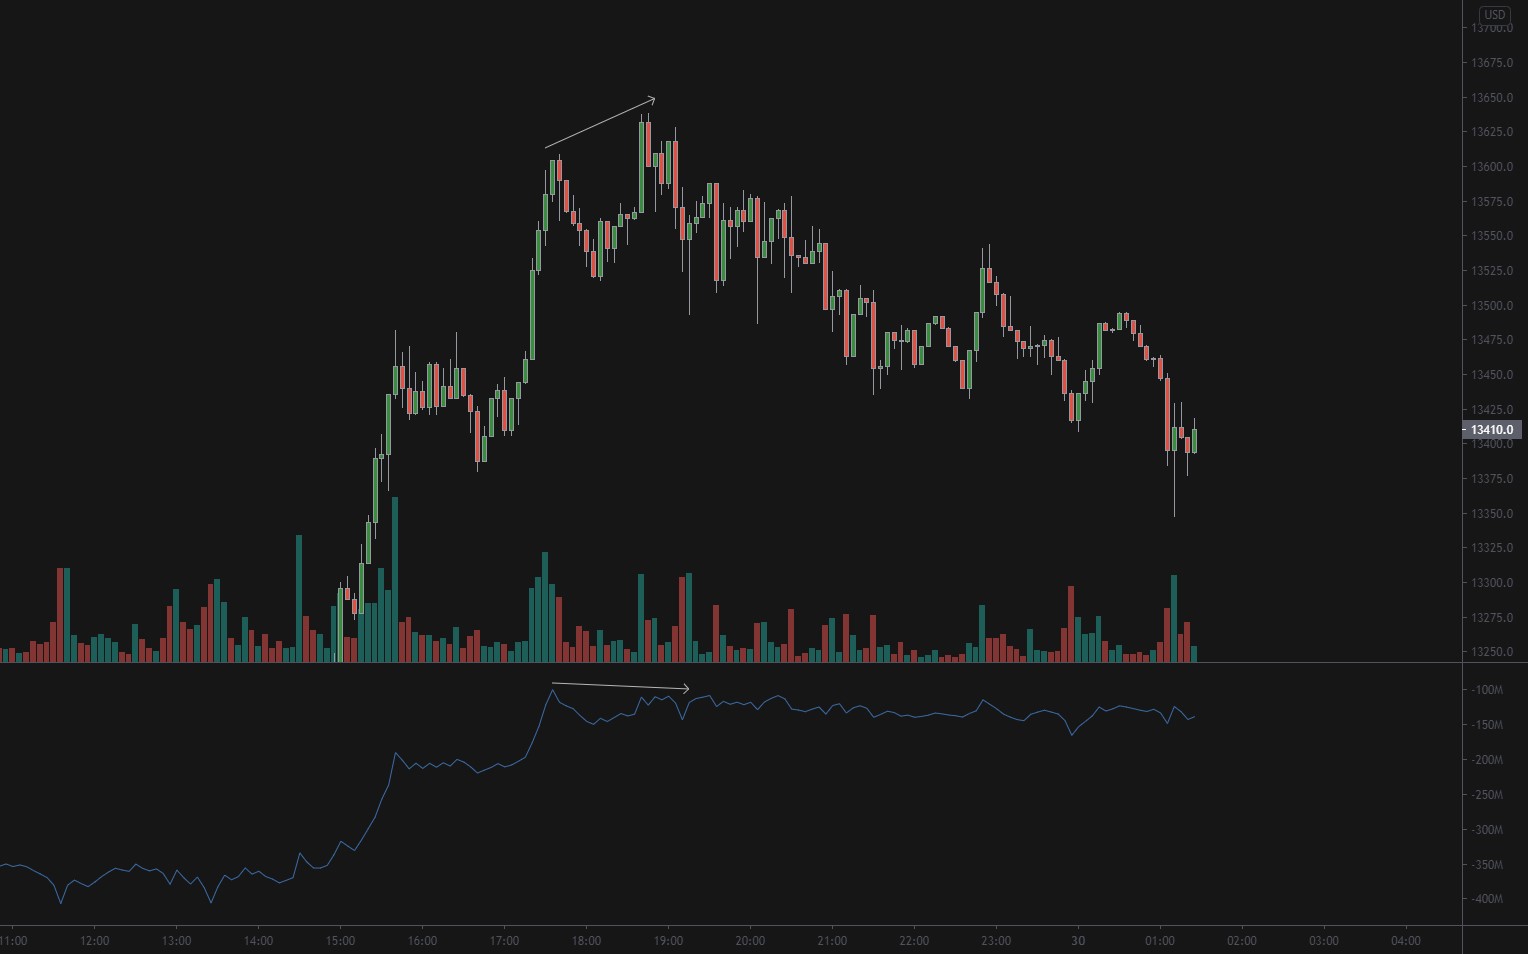
Once the market starts to make new highs or low that is not confirmed by volume, we can use this divergence to spot exhaustion and possible reversals.
To see this divergence, we can use an On-Balance-Volume indicator rather than a classic volume indicator.
On-Balance-Volume
On-Balance-Volume (OBV) is simple and easy to use oscillator.
When the market closes higher than the previous period, the volume is added.
When the market closes lower than the previous period, the volume is subtracted.
This provides a running total of volume and can give us simple divergences of higher/lower prices that are not confirmed by volume.
Relative Volume
From classical volume indicators, the relative volume is by far my favorite.
RVOL, tells us how current volume is compared to past trading volume over a given period.
The high relative volume shows late longs and shorts at end of movements, but also gives confirmation of breakouts from the ranges.
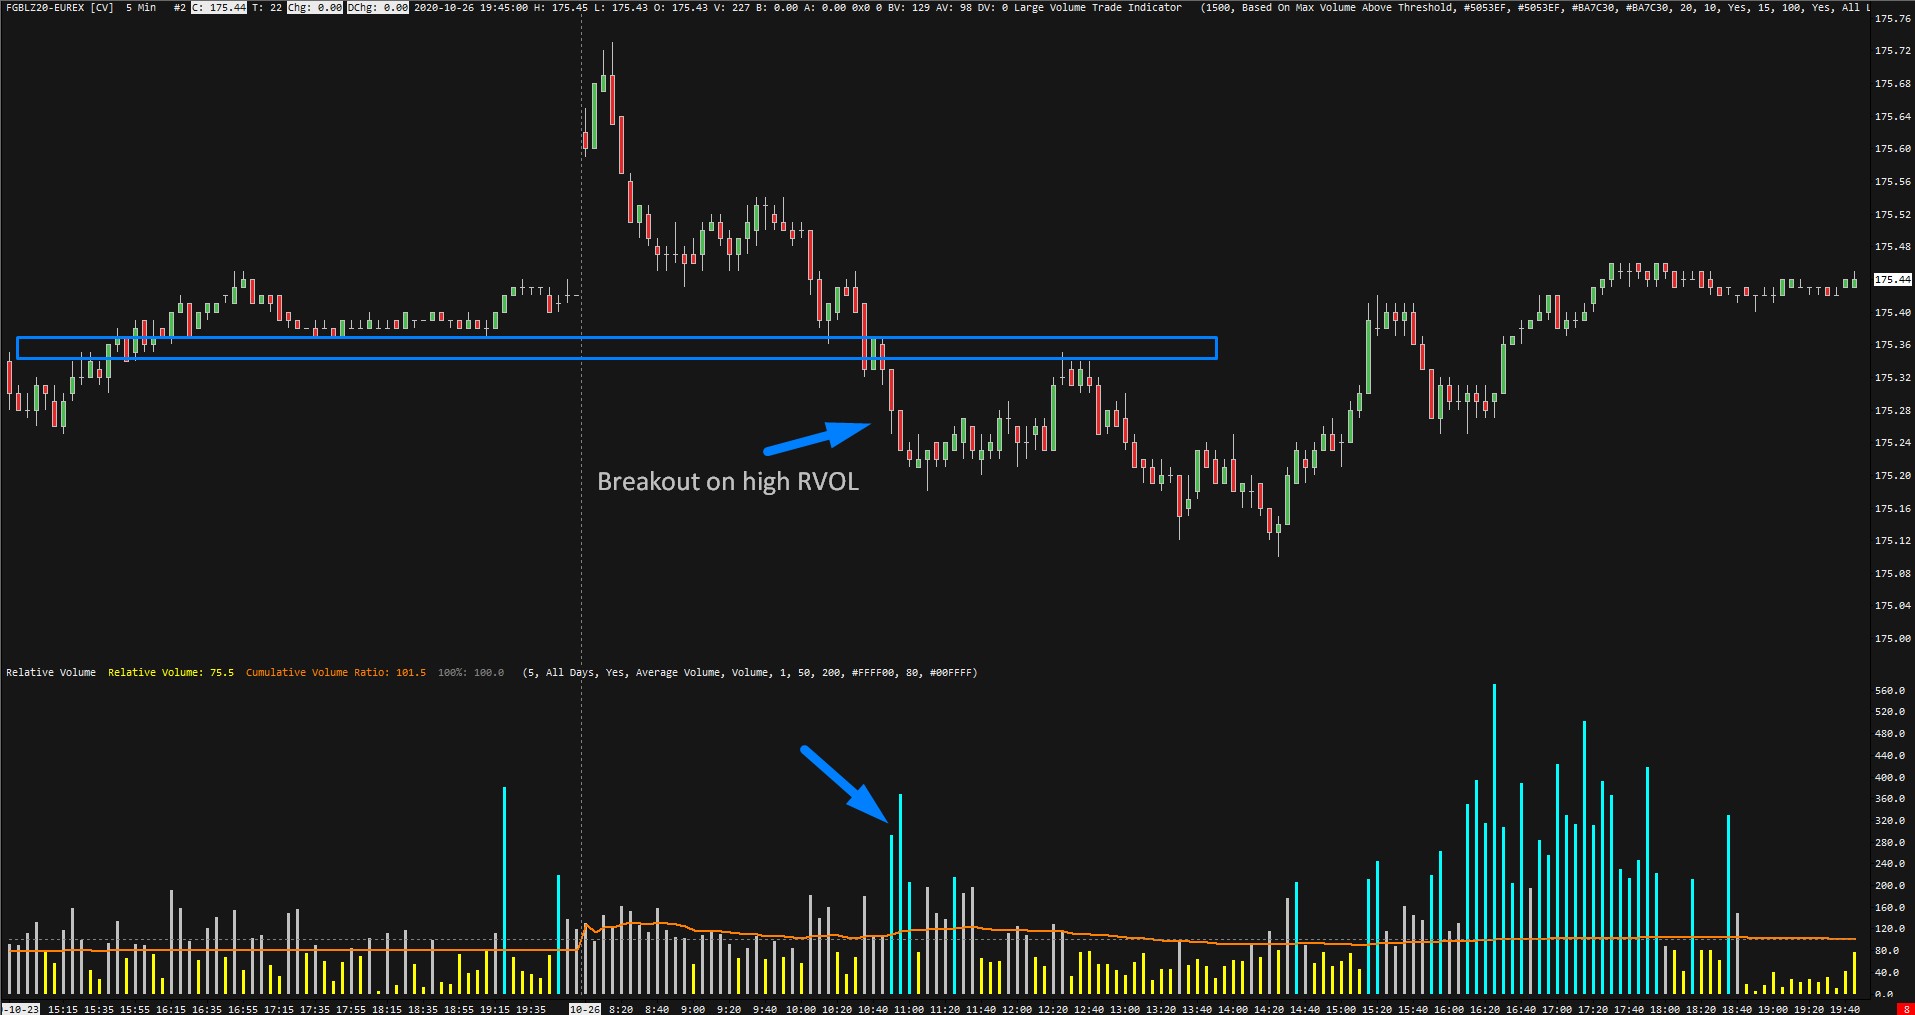
As you can see in this example, structural support was broken on high relative volume (above 200% of threshold).
This gives us an indication of sellers stepping in and the likelihood of level being defended on retest which happens later.
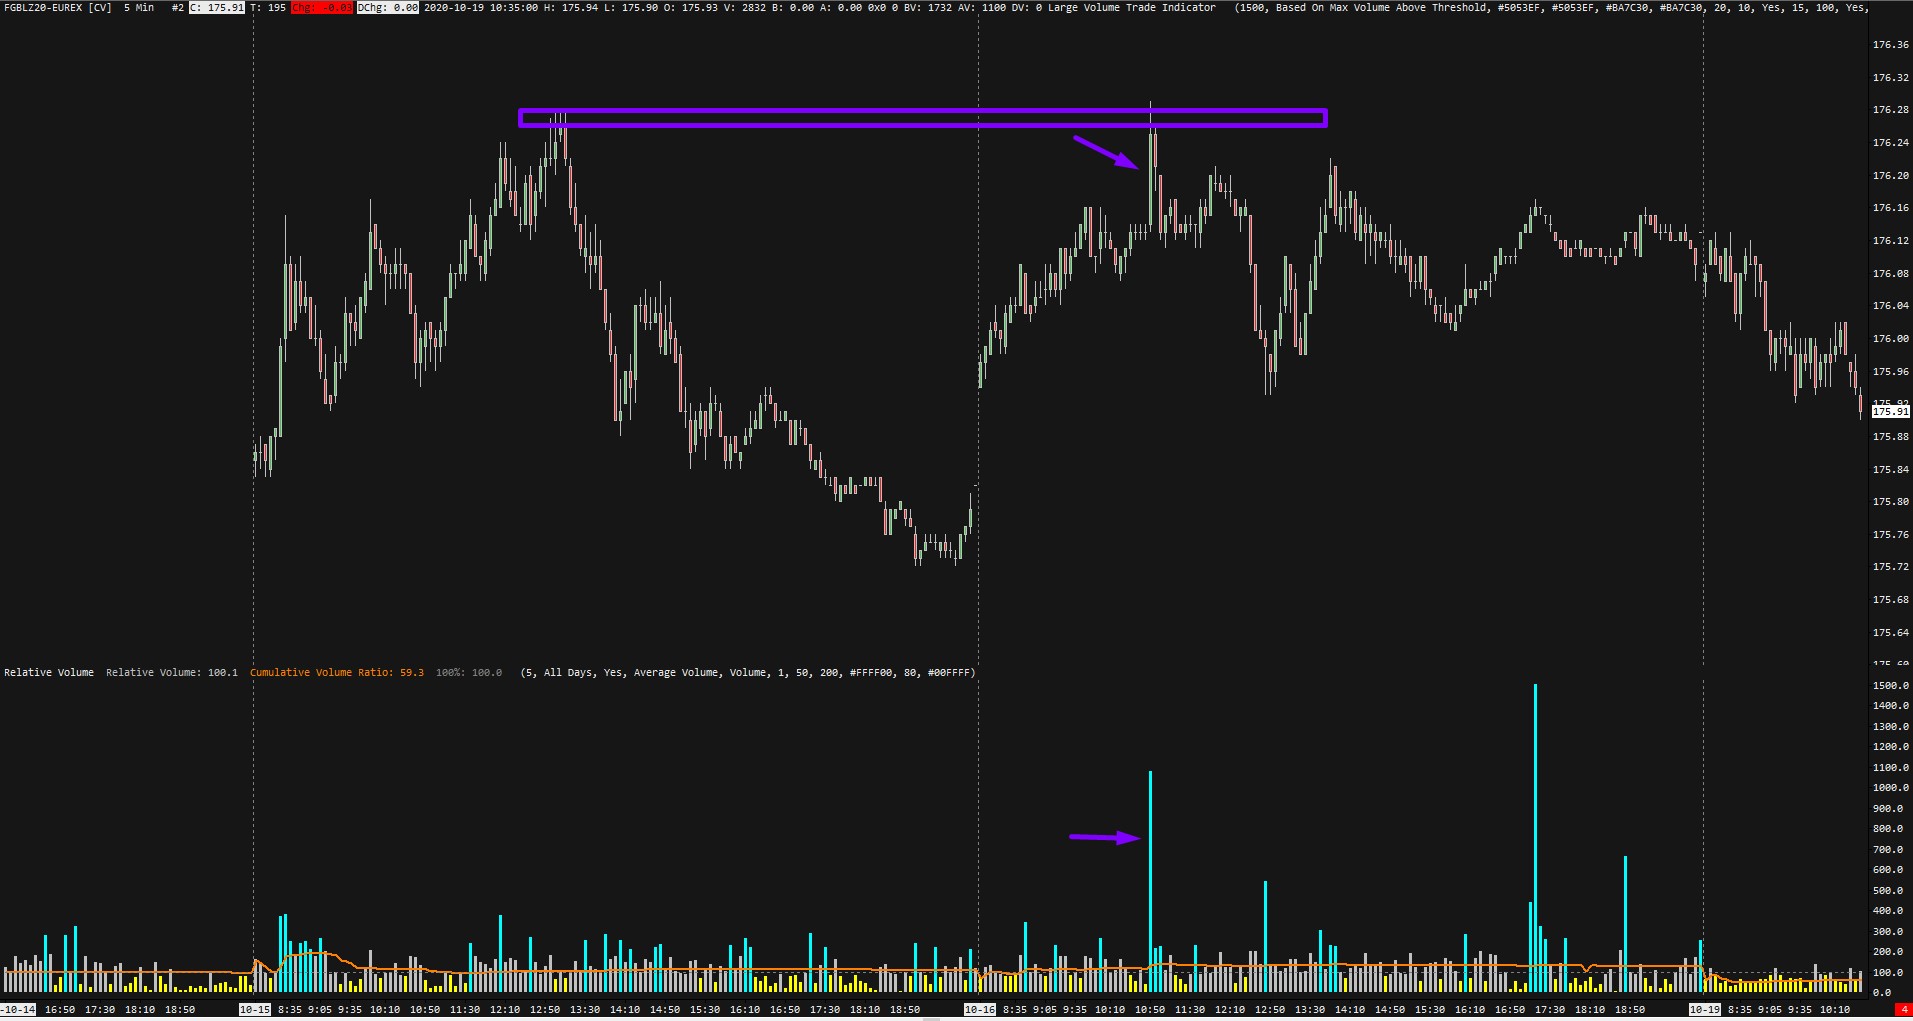
The second example shows late longs that are chasing the movements into the resistance.
If you have noticed, there are also yellow bars on RVOL indicators.
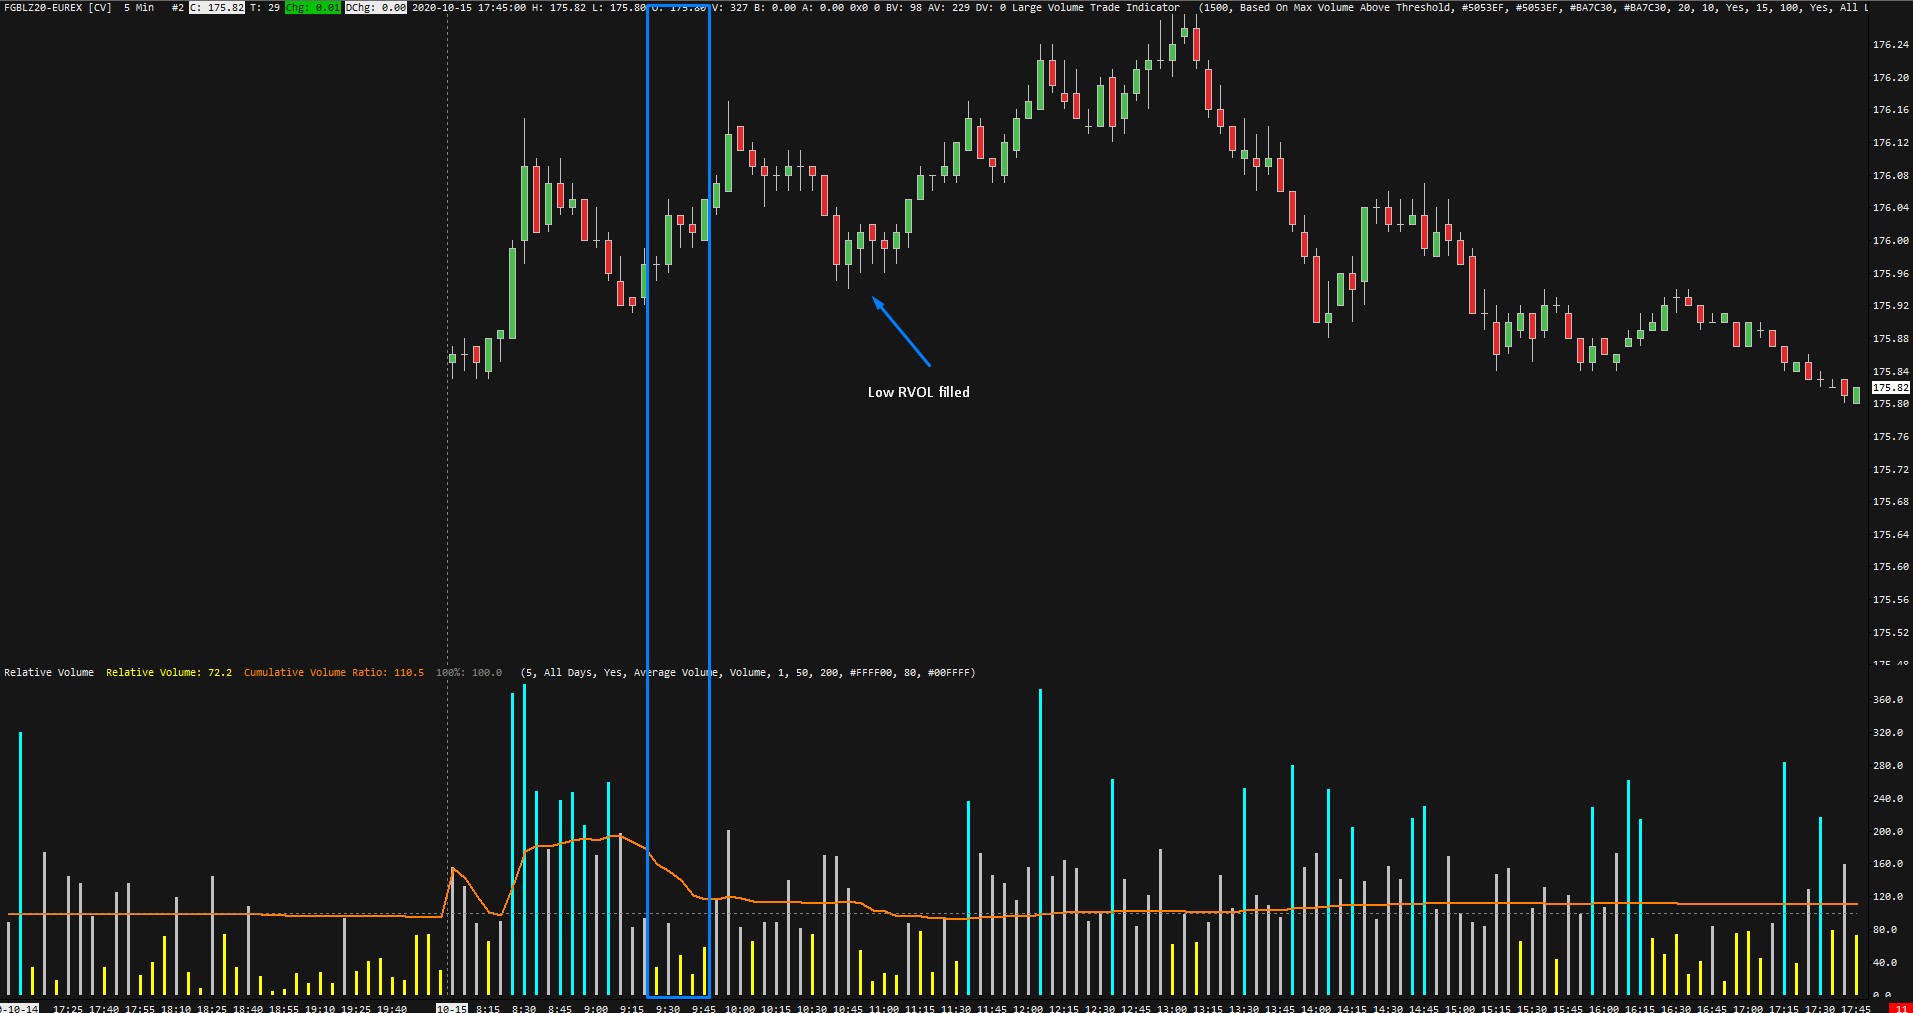
These represent low relative volumes and they are the same useful as high ones.
Moves on low relative volumes are oftentimes filled.
Because of that, we can use them as targets.
In this example, we could enter the trade once the price was not able to close above the prior high with diverging volume and delta on Footprint Chart.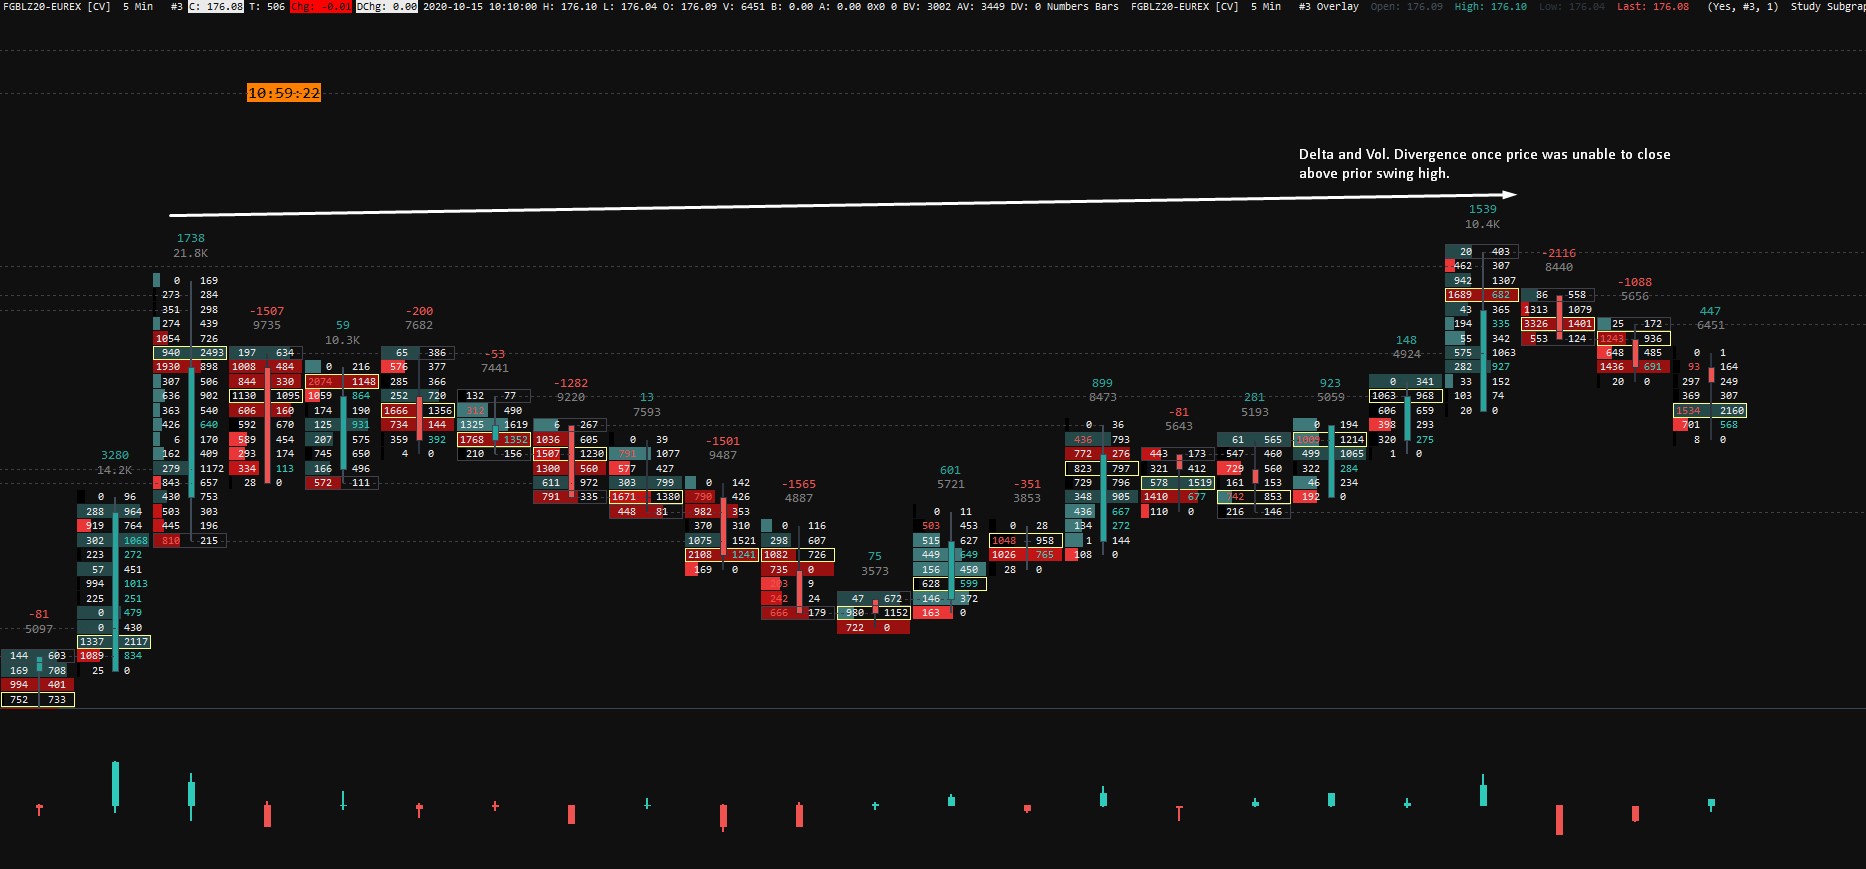
Explaining this is much beyond this article, but if you are interested in learning how I use volume and orderflow in my trading, you can have a look at the Tradingriot Bootcamp.
Anatomy of Volume profile
Compared to the traditional volume displayed on the x-axis, we can find the volume profile on the y-axis.
The volume profile shows us volume traded on a specific price instead of time.
Every time one contract is traded, the volume profile builds at the price where the contract was traded.
This way, traders can see where volume was and was not traded during a given trading period.
This volume profile is then displayed the same way as Market Profile with a distribution curve.
Throughout the distribution, we can look inside every price level to see how much volume was traded there.
These price levels are called Nodes.
The size of each node is determined by the number of contracts traded inside it.
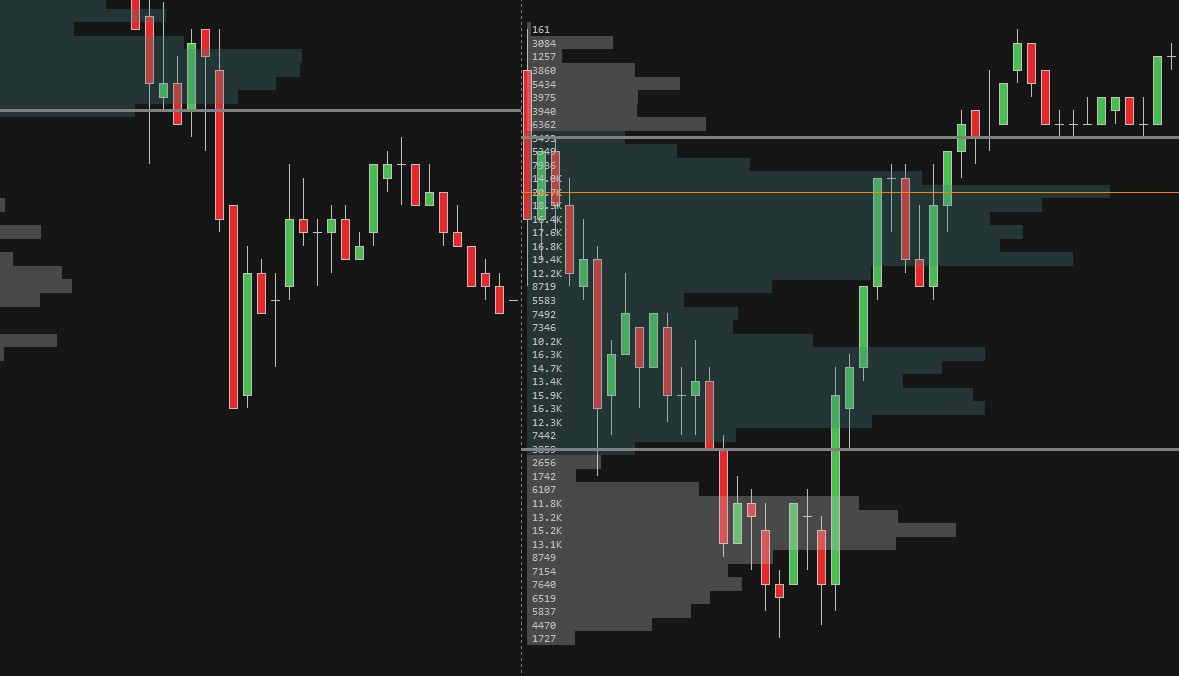
As you can see on the zoomed-in chart, each node has its own number of contracts traded.
So if there is number 6017, it means that 6017 contracts were traded at a given price point.
When the number is higher, it is a node with high executed volumes.
They are called High Volume Nodes (HVNs).
These balanced areas signal that market participants agreed on the fair value and no aggressive action was called for.
Opposite of these are Low Volume Nodes (LVNs). These consist of low executed volumes, similar to single prints, the price moved quickly through them on low volumes.
They work as a vacuum for prices as the market is often attracted to them.
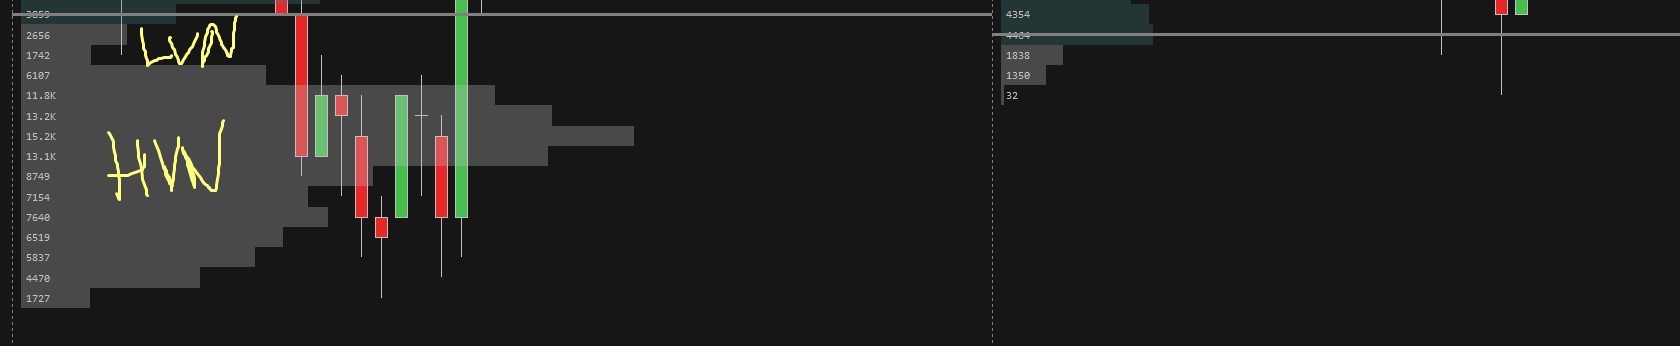
In most cases, high volumes accept and low volumes reject prices.
Because of that prices often bounce from edges of the high volume nodes, so they are great for entries and targets.
But if prices accept inside the HVNs, we can expect more range bound rotational behavior as we enter the areas of previously fair value.
These behavioral examples were shown at the end of the Auction Market Theory article.
Here is an example of HVN and LVN behavior.
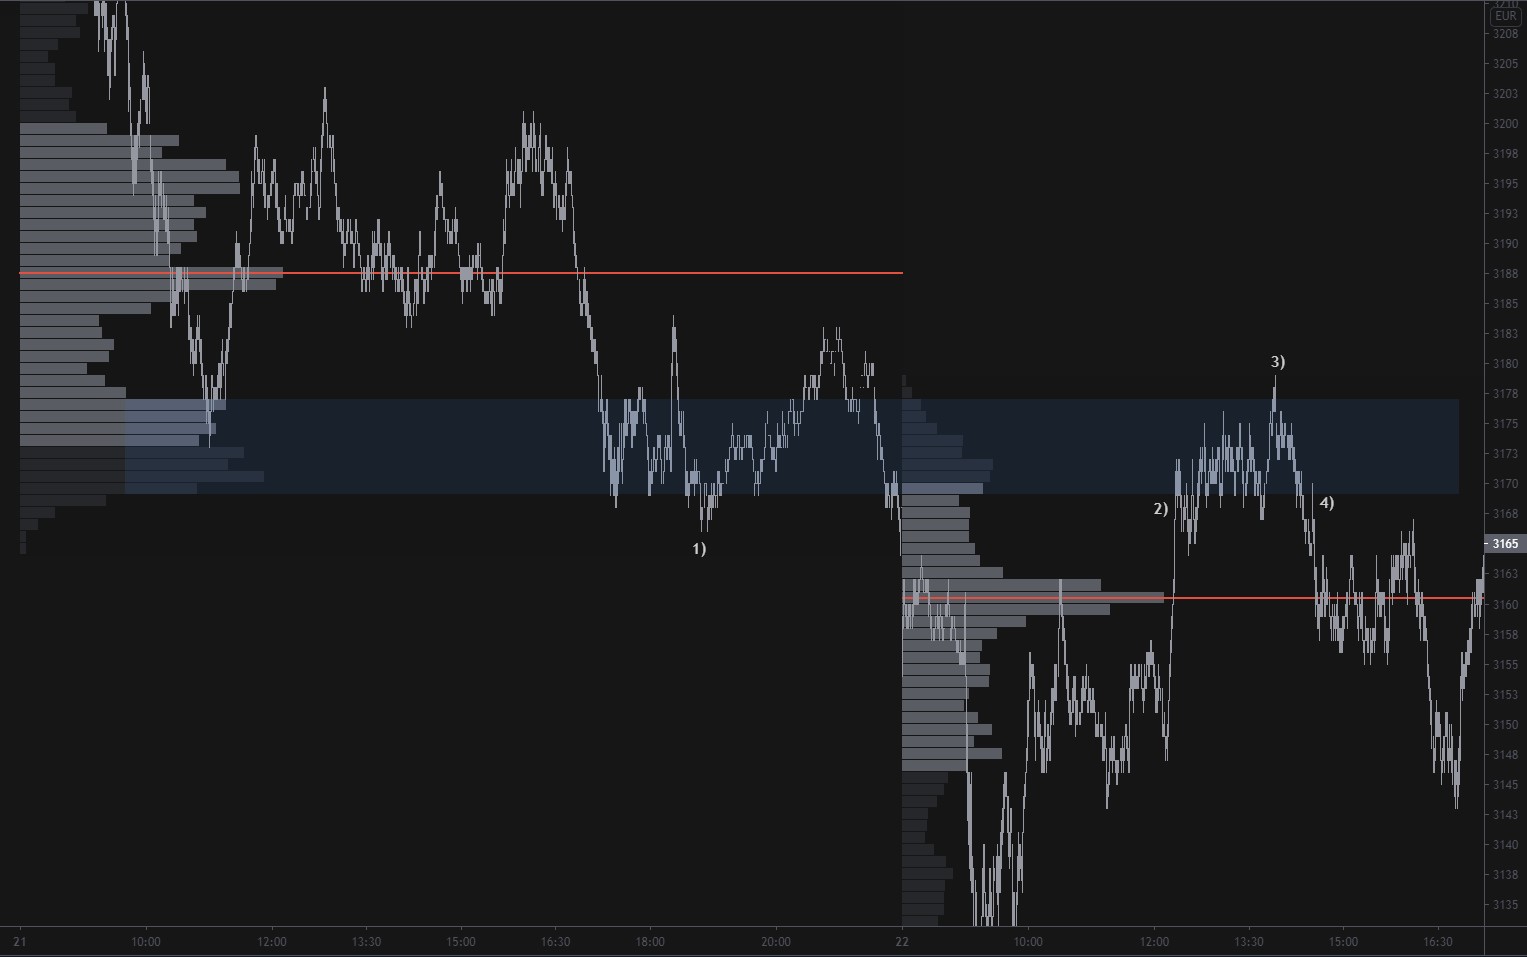
- On the Euro Stoxx 50 (FESX), the market builds up an HVN after the cash close.
- Once we come back to test the HVN, the market rejects it at first but accept inside the HVN slowly after, you can see how price instantly become more range bound and exploring the edges inside the HVN.
- Failed auction above the HVN, and a sharp rejection.
- Once the market broke below the HVN, we can see a quick retest of the edge before the further selloff.
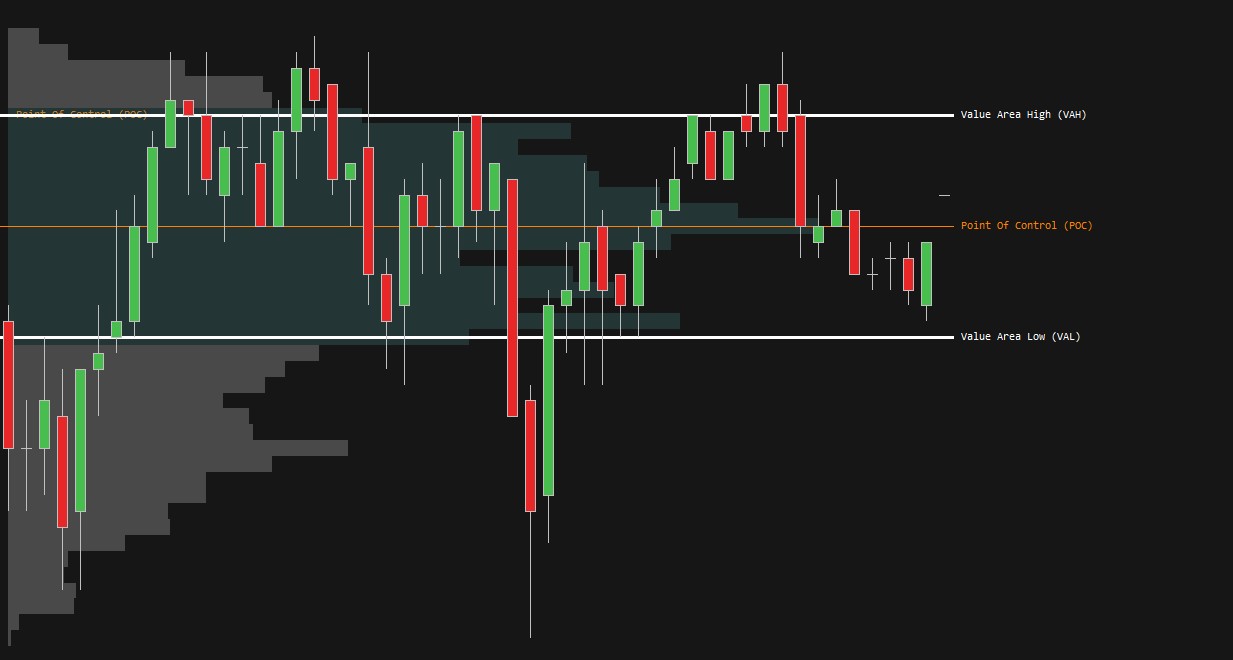
Besides HVNs and LVNs, the same as the Market Profile we can find a Value Area.
The value area represents 68% of the accumulated volume inside the profile.
And the Point of Control, which is a level with the most traded volume.
Market Profile vs Volume Profile
There is an ongoing discussion if traders should use the TPO Profile Value area High, Low and Point of control or Volume Value Area High, Low and Volume Point of control.
This is up to your personal preference, but most of the professional traders I have seen, put more emphasis on the volume than time.
Therefore, I personally use the Volume Value Area High, Low, and Point of control, but I still overlay it with the Market Profile where I monitor anomalies such as ledges (HVNs), Single Prints (LVNs), poor highs/lows and tails.
Most advanced charting platforms such as Sierra Chart, allows you to overlay these two and decide if you want your levels calculated based on volume or time.
Trading at the Point of Control
The point of control is a great magnet for the market.
They are much better targets than entry points as they represent the areas with the most traded volumes, and markets often tend to range around them since you have a massive amount of participants stepping in with interest in trade.
Especially on balanced days, you can get absolutely chopped out every time you try to place a trade at a previous Point of Control.
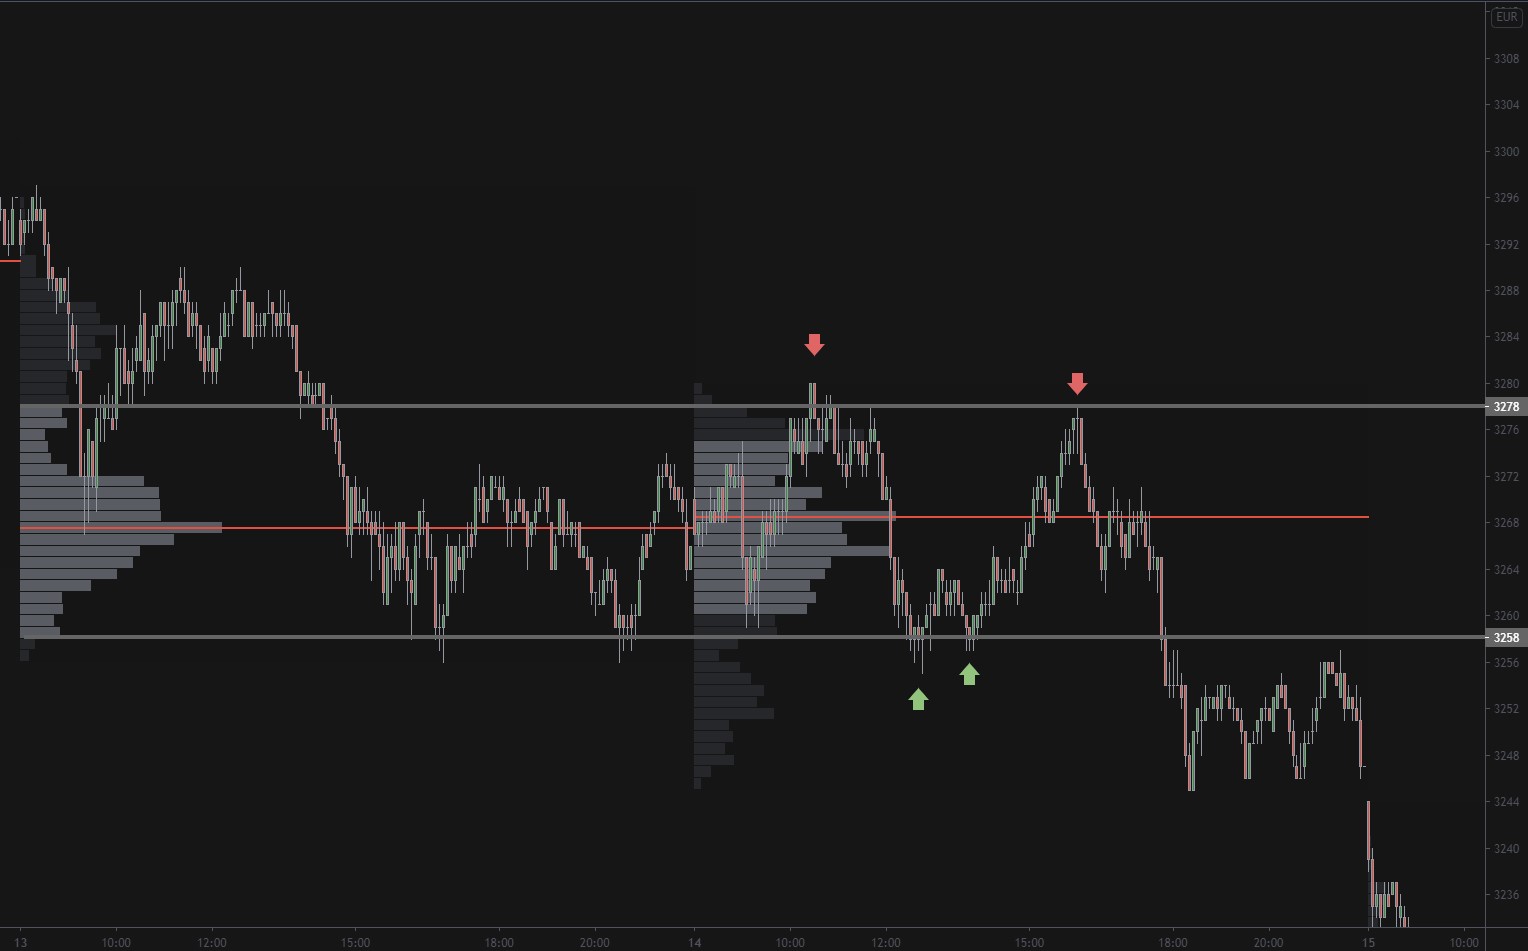
By looking at this example on Euro Stoxx, you can clearly see that your best bet would be executing at the Value Area Highs and Lows in a responsive manner where every time market tried to break through the area it was quickly pushed back in.
Tools such as footprint charts help us see what is happening inside those attempts of breakouts.
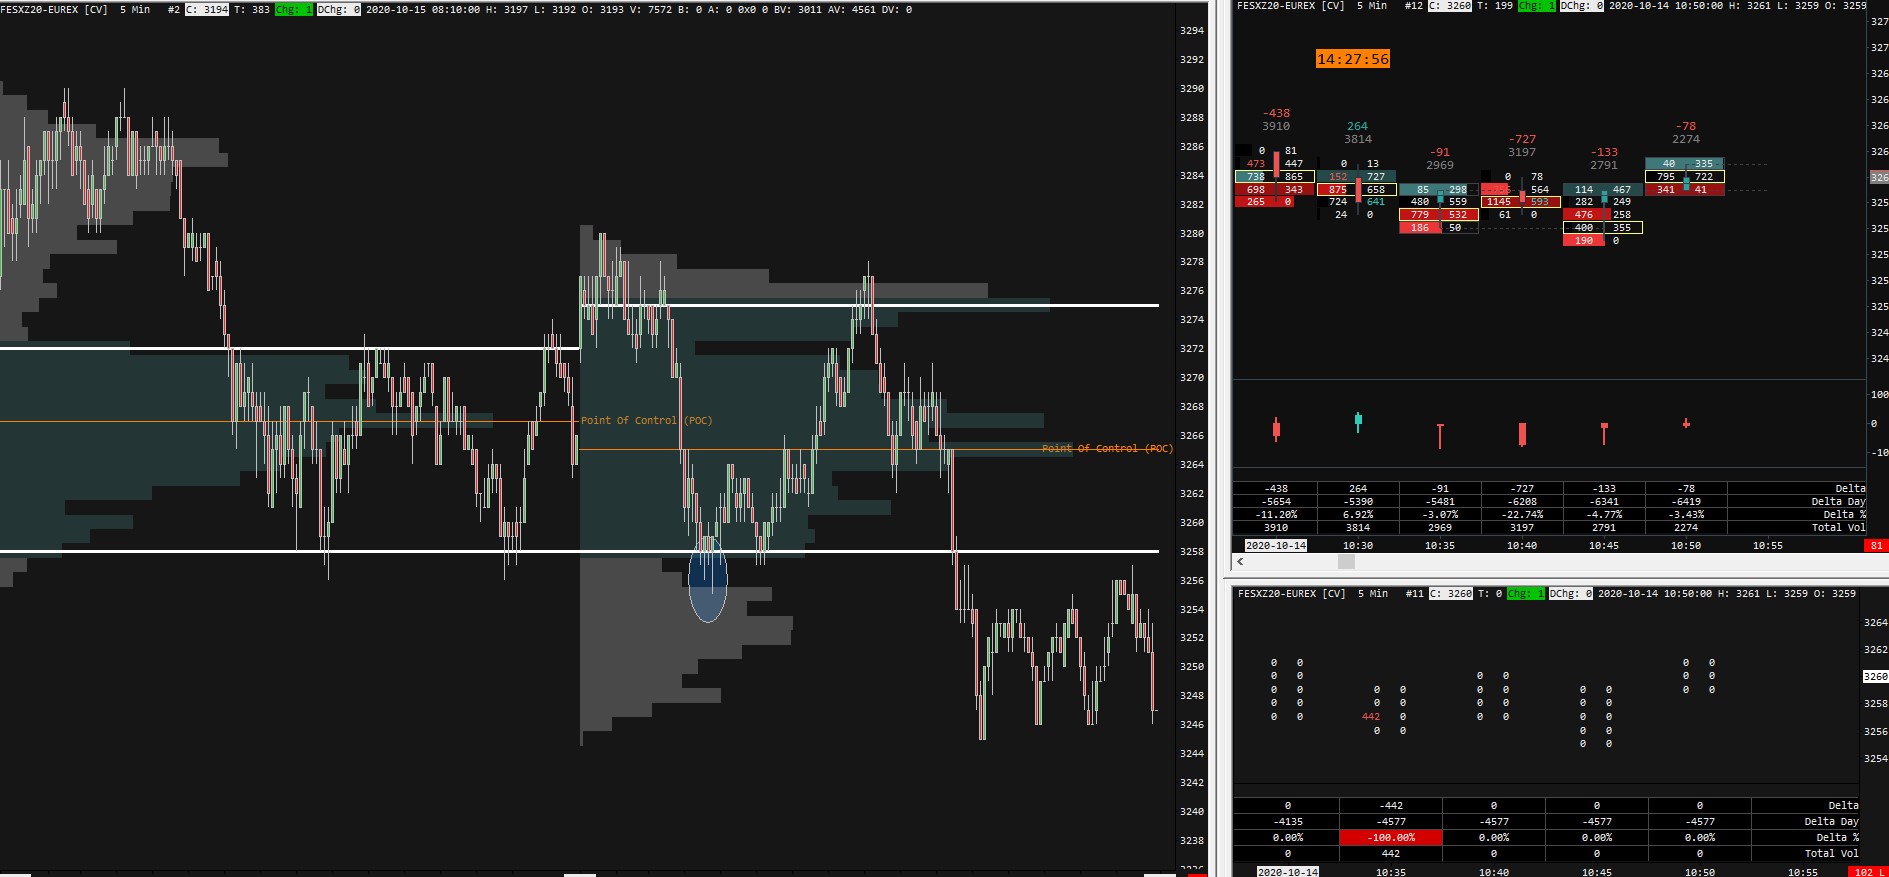
In this case, on the first attempt to break below the previous day Value Area low, we can see 441 contrast sold at once getting absorbed.
Shortly after that price down ticked lower and finishing the auction with the large seller of 190 lots stuck at the lows on delta divergence, this is generally a very good signal that the bottom is in.
Naked Volume Point of Control
Naked volume point of control presents the highest significance.
They are called naked because they were not tested yet.
This makes them important because as with every other untested level, there is a lot of eyes on nVPOCs and a lot of resting orders lying our them.
They are both great targets and entries as the market often offers a reaction upon hitting them.
A prime example of nVPOC trade is this Crude Oil, where we can see a sharp move through the LVN and price stopping right at the nVPOC where it eventually collapses from.
Accuracy of Volume Profile in Different Markets
A lot of Volume Profile traders put a large amount of emphasis on Point of Control and Value Area Highs and Lows.
This obviously brings a question that once everyone is watching the same level, is it accurate?
Not only that nothing in the market is 100%, but there are also different types of markets where the reactions from these levels will be different.
This is determined by the liquidity of the markets you are trading.
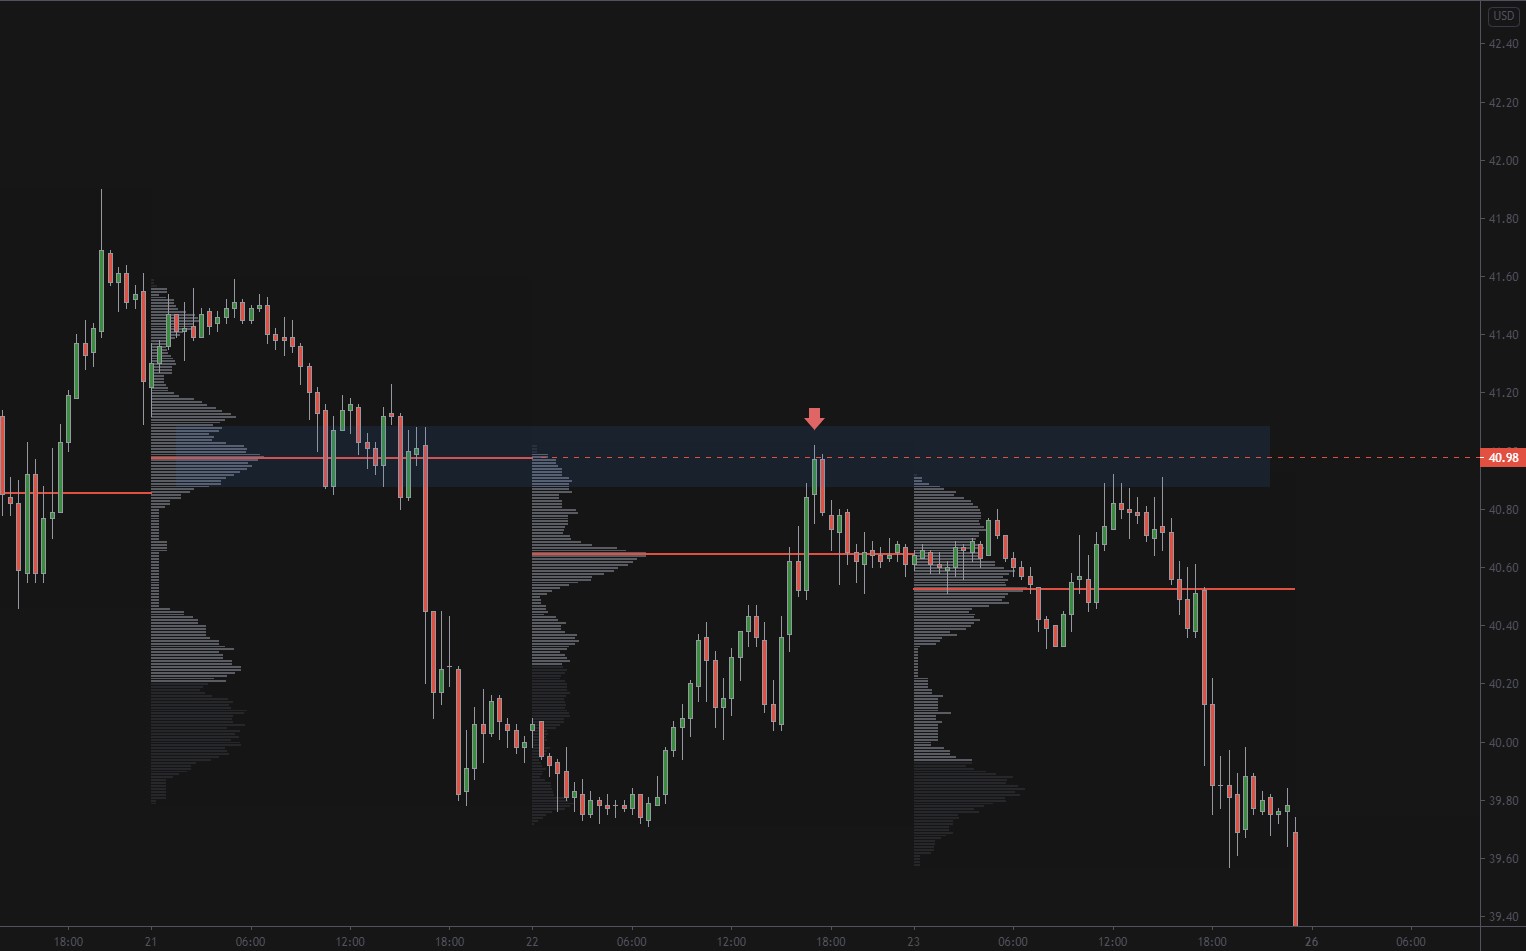
If you are trading high liquid slow-moving markets, such as Bonds, these levels will play a much more significant role compared to thin jumpy markets like Bitcoin or Dax.
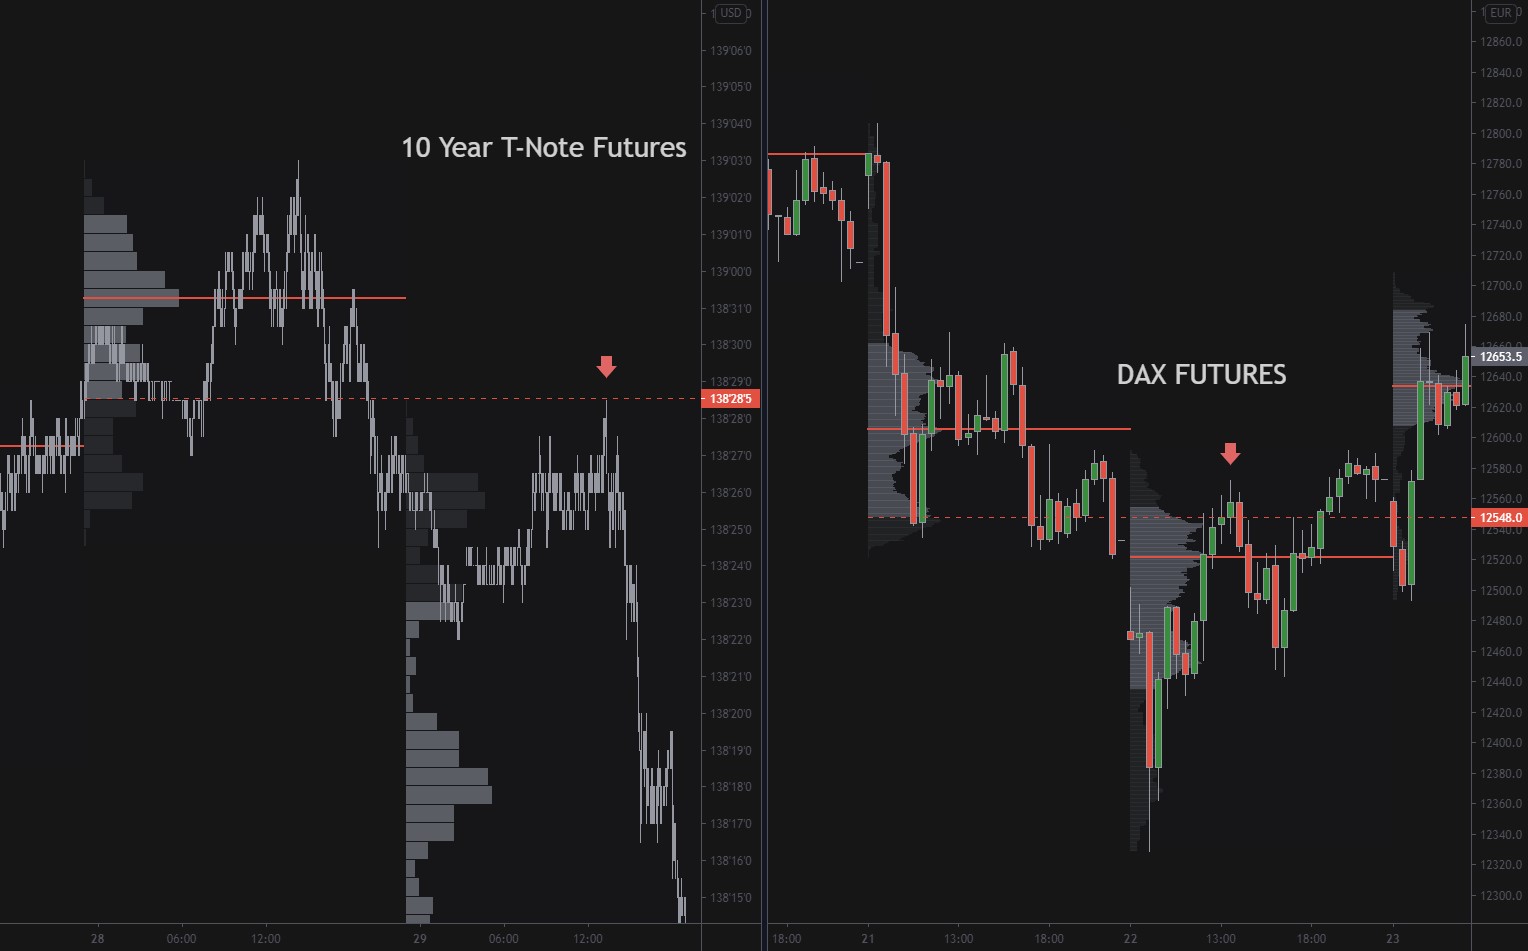
As you can see, both ZN and FDAX sold from previous day value area low, but Dax probed the level by 30 something points first compared to 10-year which tested it to the tick and sold off.
I am not saying that any markets are better than the other, as some traders cannot stand watching the slow-moving bonds market and they much rather trade fast-paced Dax or Bitcoin.
You should be aware of your market and don’t take POCs, VAHs, and VALs as 100% precise levels.
Here is the table of futures markets divided by their liquidity.
The most liquid one will respect these levels more precisely than the thin ones.
But this doesn’t mean that you should trade the thin markets as they offer a great amount of volatility almost daily and bring many more opportunities than thicker markets.
| High Liquidity | Medium Liquidity | Low Liquidity |
| Bund/Bobl | NQ | Dax |
| ZN/ZB | CL | Currency Futures |
| FESX | GC | YM |
| ES | BTC | ETH |
Don’t take this as 100%, market conditions constantly change so liquidity in those markets can quickly shift as we have seen during the Coronavirus crash in March 2020.
The idea of separating markets and reactions of Volume profile levels came from a great webinar with Kevin Toch hosted by Bookmap, I highly recommend everyone to give it a watch.
Composite Volume Profiles
Composite Volume Profiles typically span from several days to weeks, or years.
They can be separated into two categories.
Fixed periodicity profiles and custom profiles.
Fixed periodicity profiles
Probably the more popular ones are based on fixed periodicity.
Weekly and Monthly profiles give a quick view of the distribution of every trading week and month.
Traders often also mark out Value area low, high and point of control of previous week or month and anticipate reaction around those areas.
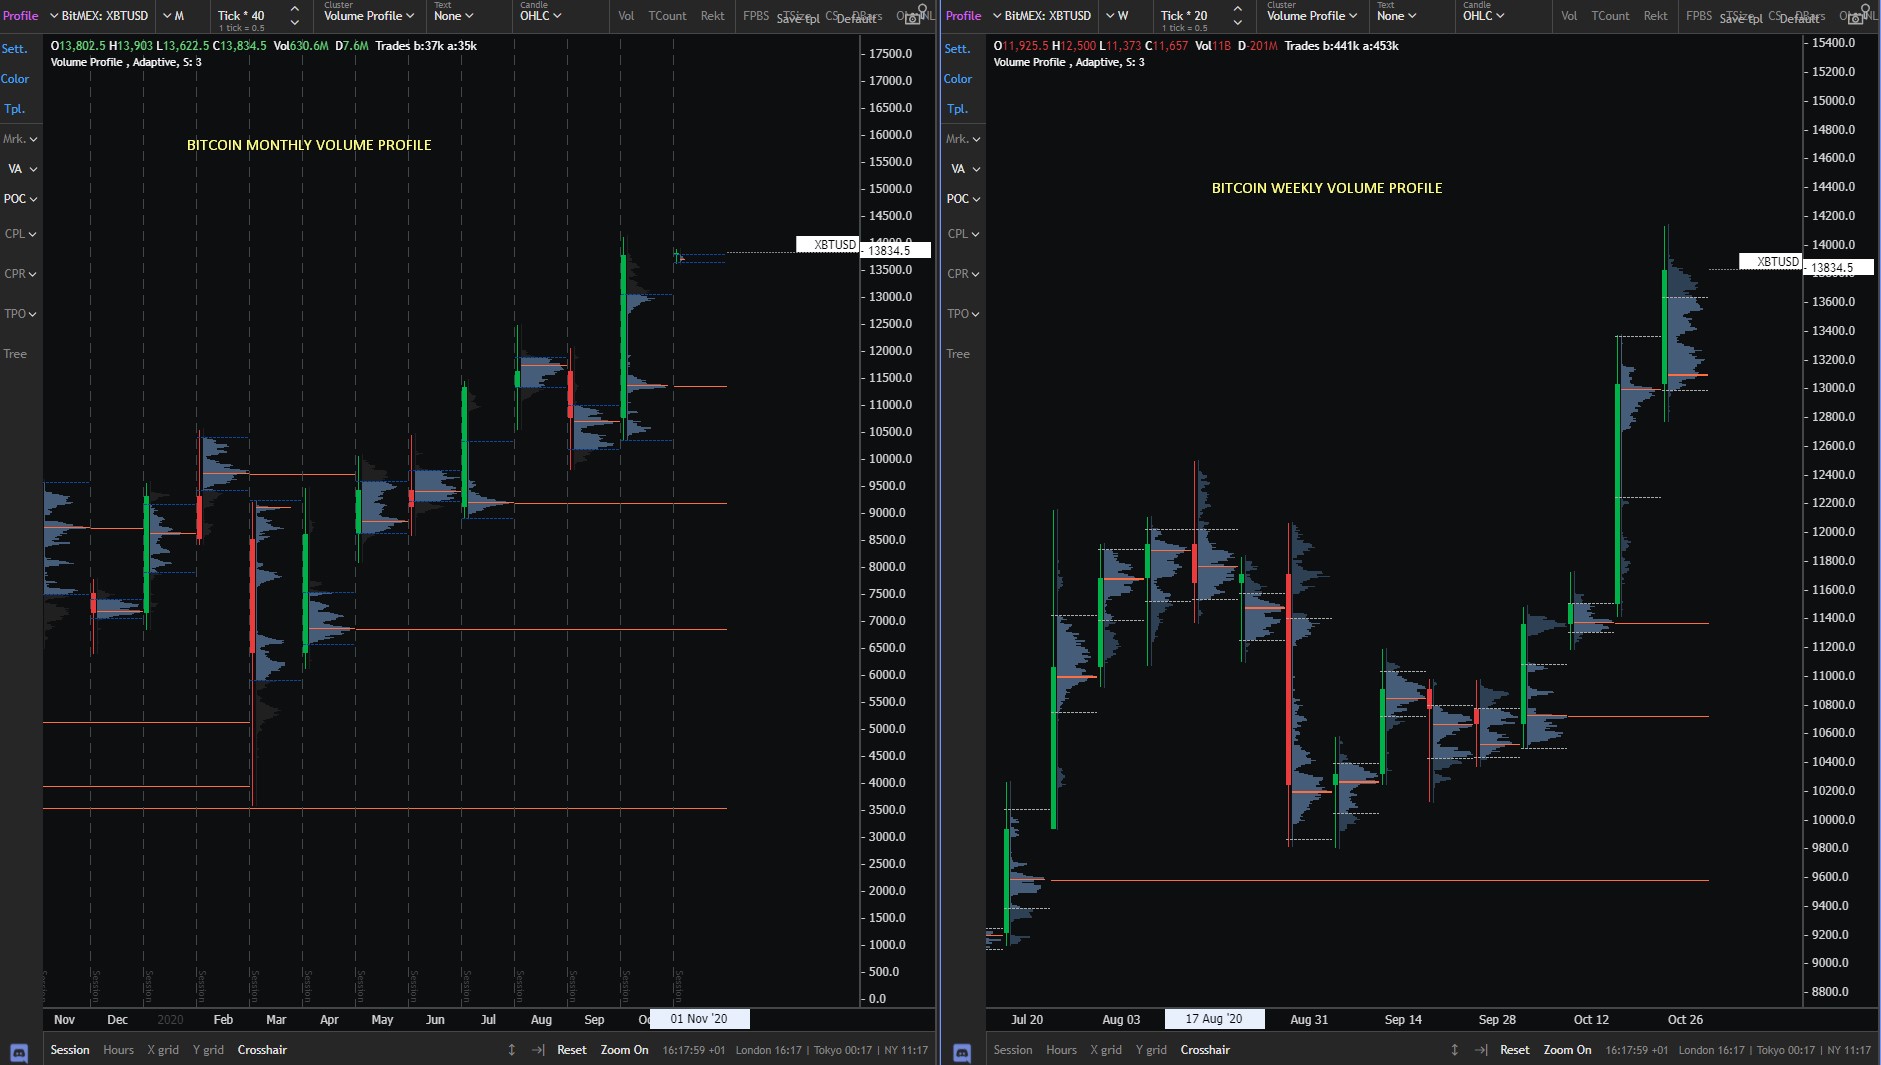
The chart above shows Bitcoin Monthly and Weekly Volume Profiles on Exochart.
The other fixed periodicity profiles are based on range-bound days, these were already explained in the Market Profile article.
Custom Volume Profiles
This is my personal preference for building composite volume profiles.
These are not based on any fixed time periodicity but on the market movements.
I have learned about these from Paracurve.
The goal is to mark out relevant price legs that the market is currently retracing and highlight HVNs and LVNs instead of VAH and VAL only.
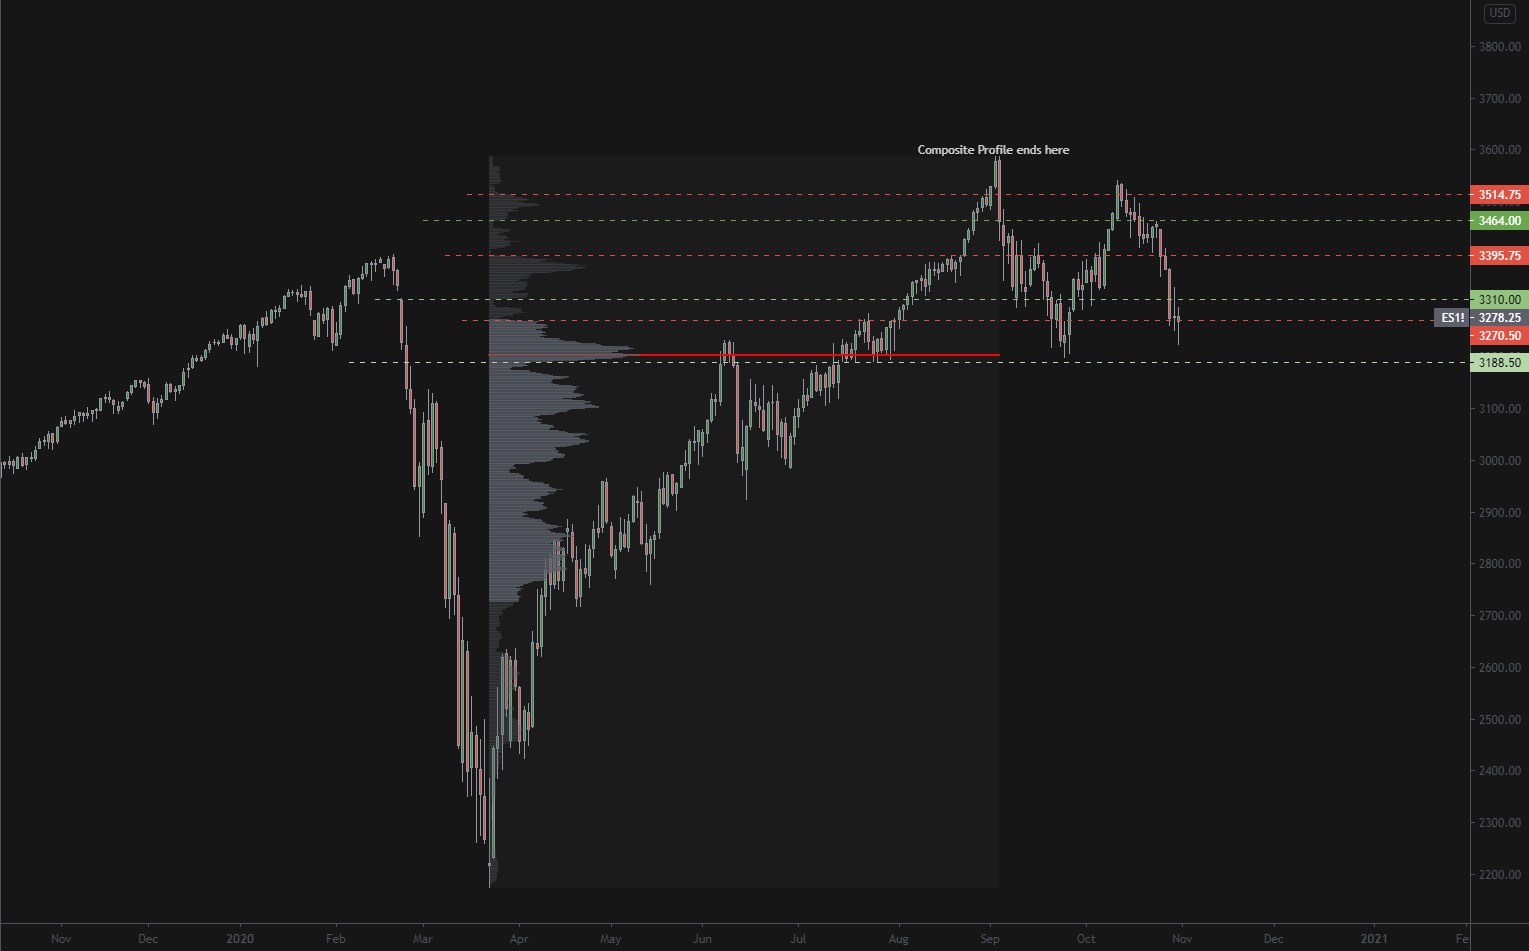
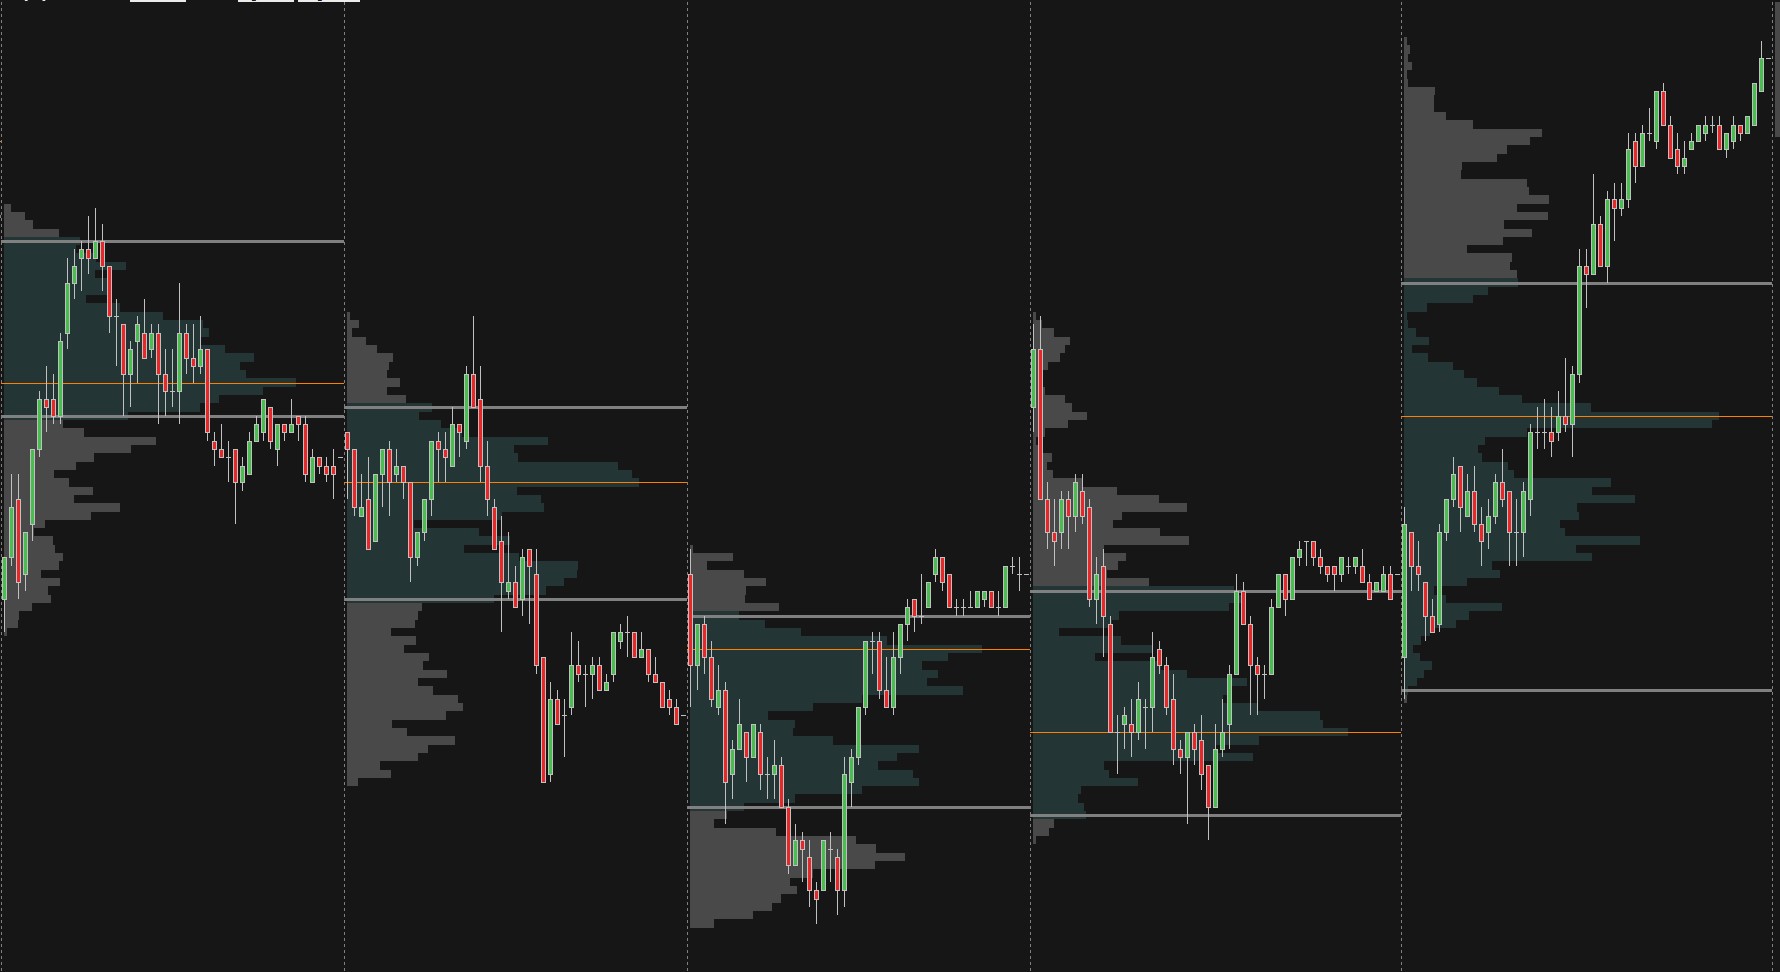
If we drag composite volume profile on E-mini S&P500 from March low to the September high, we get many high volumes nodes that were made on the way up.
Once we moved down the lower timeframes, we can use these high volume nodes as support and resistance and apply the Auction Market Theory’s acceptance/rejection rules.
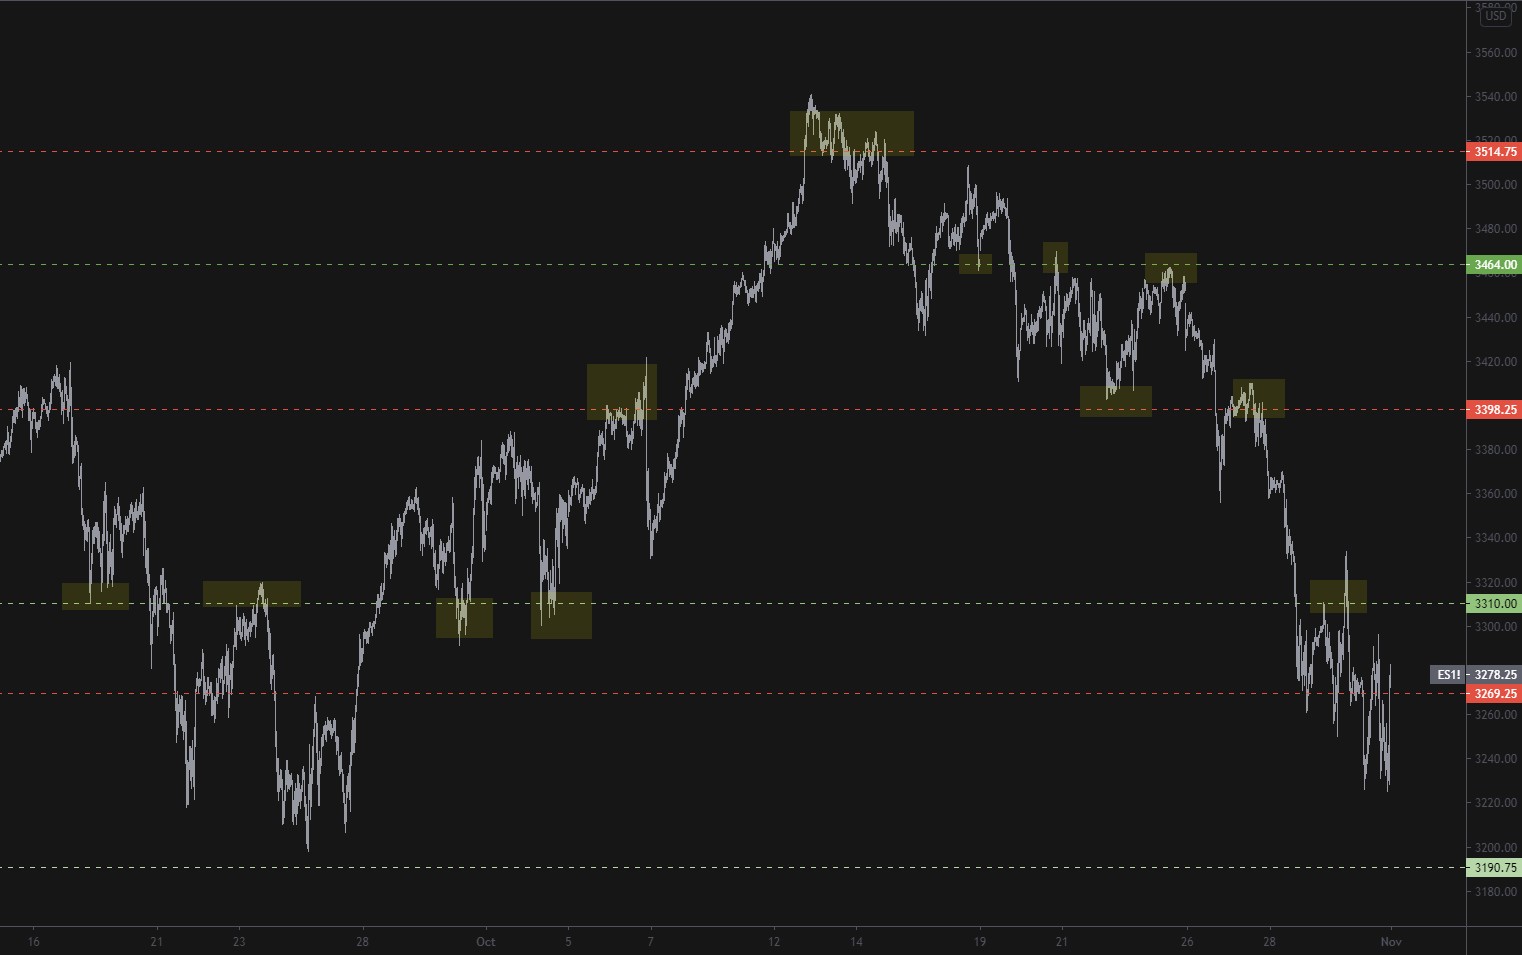
Fast forward to the end of September, and the month of October, you can see how these levels that were drawn a month ago get respected.
They are not perfect, and they only present one piece of the puzzle, but they give us a quick overview if we are at HVN or LVN and what type of behavior we can expect, trending in LVNs or ranging in HVNs.
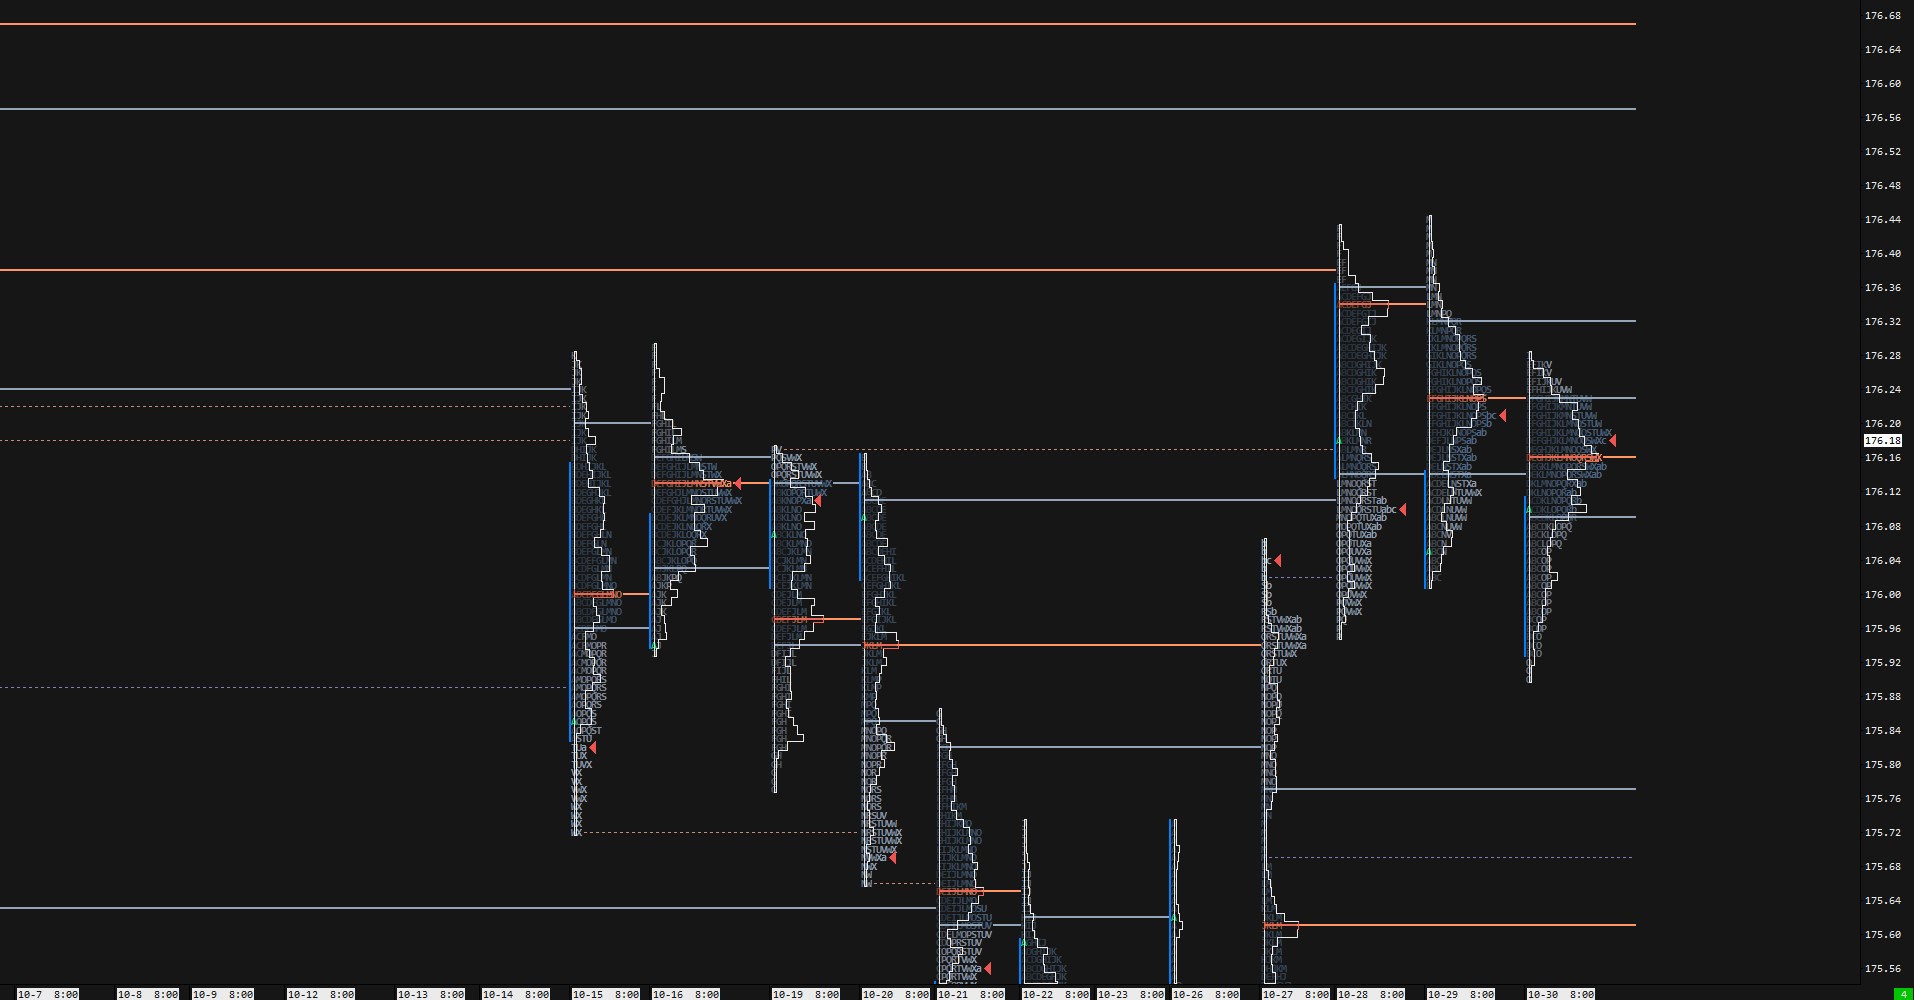
I use a “never-ending” composite Volume profile that simply marks out all bars in the chart and always updates evolving prices.
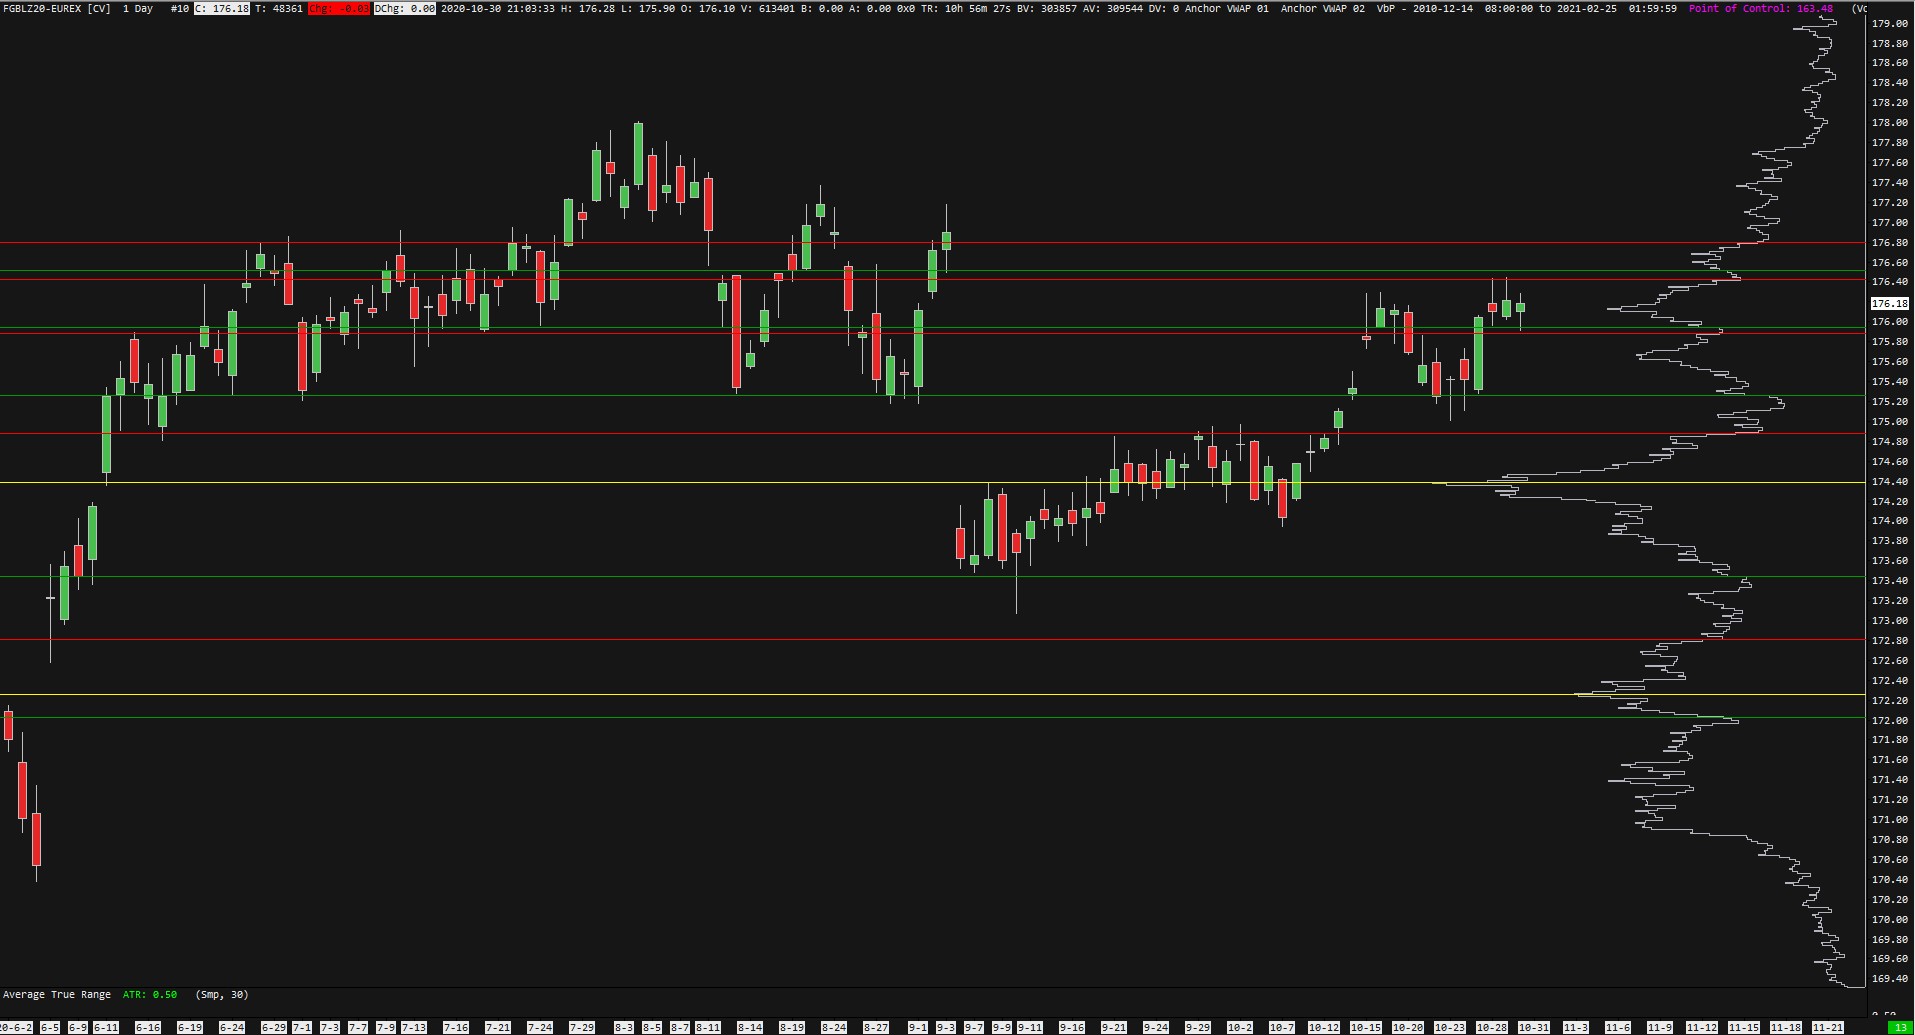
This is a composite volume profile on Bund from 2010 and continuously update to the future.
Green lines are bottoms of HVNs, red tops of HVNs, and significant yellow POCs.
This way, I can quickly determine what type of environment we are in and use other price action patterns and tools to find great trading opportunities.
More about how exactly I trade and use these levels can be found in the Trading Blueprint.
In Conclusion
Those that know the Auction Market Theory and Market profile find Volume Profile very easy.
It simply brings more accuracy in the form of levels in the age of electronic trading.
Applying concepts of Auction market theory, organizing data with Market profile, and executing Volume profile levels, you will have an excellent trading career ahead.
Testovito
Thx for article )
Ken
Thank you for this great article. I always wondered is there anyway to draw top/bottom of HVNs accurately? I can definitely spot HVNs with your lines but without those lines, I am sure my eyes will catch HVNs in different slopes of VP. May be I need to work on it more.
Cheers!
Adam
Since they are more of a zones to show you a bigger picture there is no need for them to be 100% accurate. If you are using Sierra Chart they recently added function of VP shading by volume, this helps a lot as you can see where volume dropped off.
Marty Jay
Great article, it nicely complements information provided in BluePrint which I believe is worth every cent. I’m reading it 2nd time now as there’s lots of info.
I started using sierra charts which seems to be great charting/trading platform even though much less intuitive and more complex when it comes to constructing and setting up charts than other platforms out there.
Was looking for Time Segmented Volume is sierra without success until I read this article and discovered it is Relative Volume in Sierra. The only thing that I’m missing (at the moment) in sierra is anchored VWAP.
Adam
anchored VWAP is also in sierra
James
Volume profile has made a huge difference to me. I attended a trading seminar Steidlmayer gave in Sydney once and have used the ideas my entire life, but VP completely transformed my trading. He taught (but in not so few words) the market has its own fractal cycle that begins and ends at usually different points of control – the idea that the market is constantly going from balance to imbalance and back to balance again but starting and ending at the point of control.
I use that idea to create distributions see for example https://www.tradingview.com/x/K2Wggt9F/
Thanks for sharing your knowledge!