
Using orderflow and market profile for swing trading, is it possible?
One of the questions I get asked a lot is if the concepts of Market Profile and orderflow can be applied in swing trading.
However, I have already discussed that in this article; I have decided to revisit this topic and dwell more into the detail.
If you like this article, read the rest of the blog or join the Tradingriot Bootcamp for a comprehensive video course, access to private discord and regular updates.
For those who are looking for a new place for trading crypto, make sure to check out Woo. If you register using this link and open your first trade, you will get a Tier 1 fee upgrade for the first 30 days, and we will split commissions 50/50, which means you will get 20% of all your commissions back for a lifetime. On top of that, you will receive a 20% discount for Tradingriot Bootcamp and 100% free access to Tradingriot Blueprint.
The difference between swing trading and day trading
In the article from begging of this year, I covered this in bigger detail from a risk management perspective, getting a sample size, etc.
To keep this simple, we can say that the biggest use of using orderflow/market profile in day trading is the ability to spot inefficiencies in the market and see what participants did during the short period and hopefully be able to profit on that.
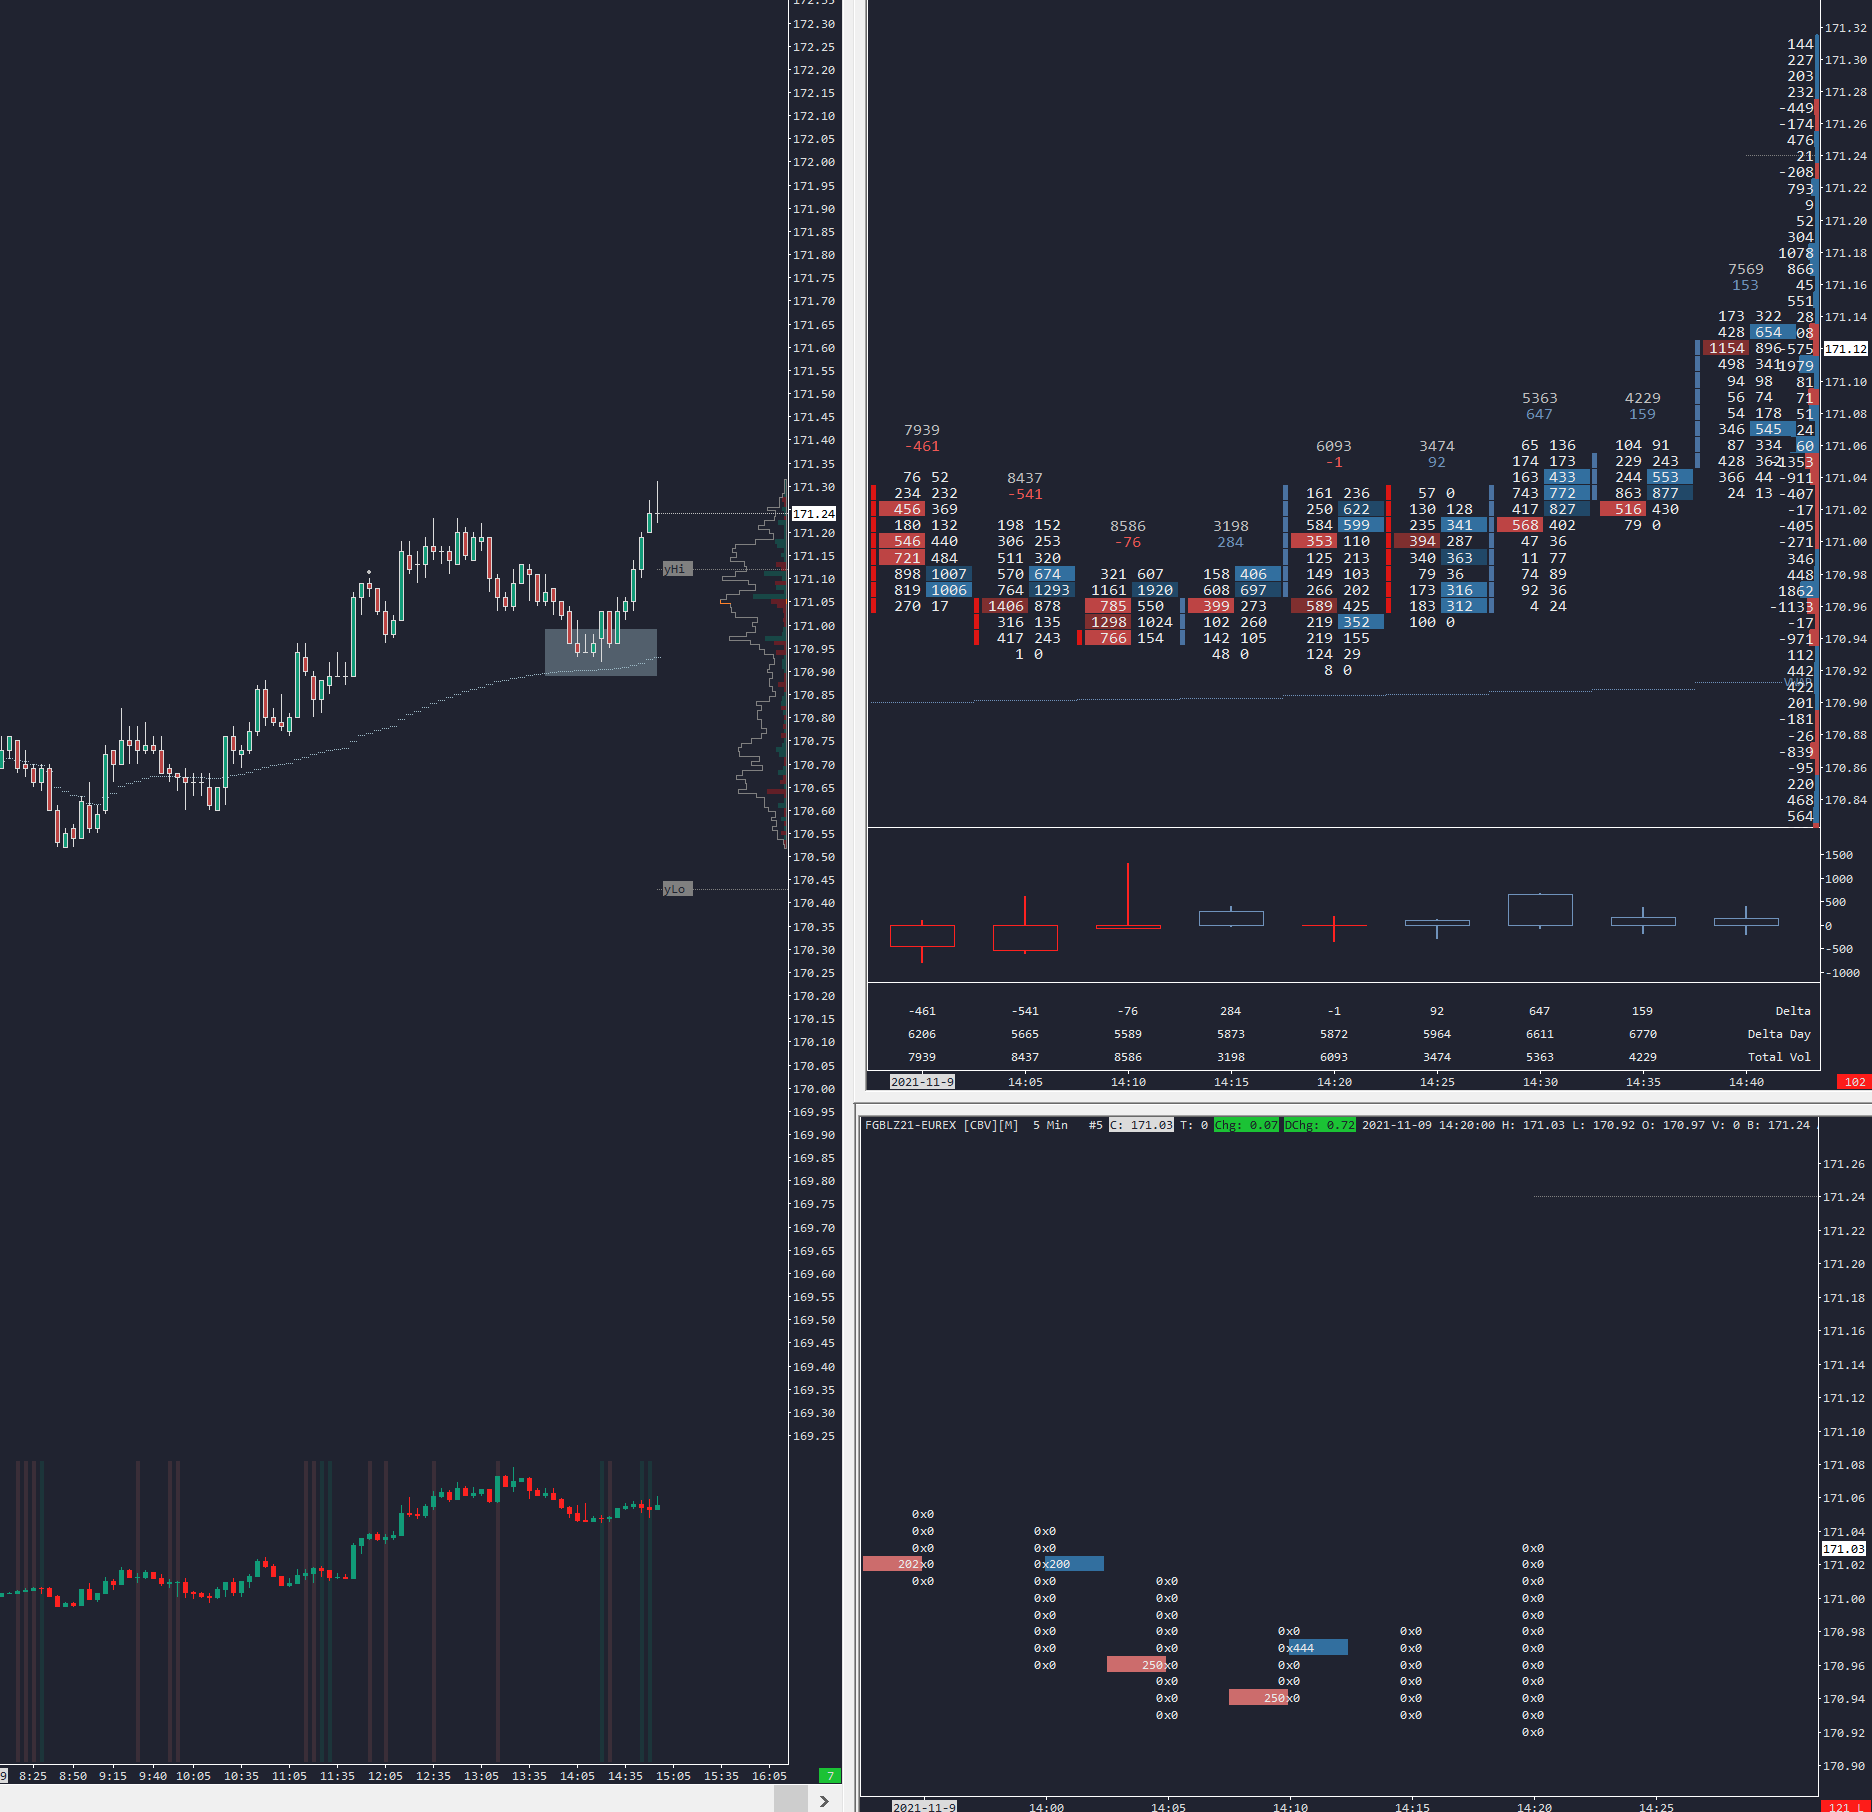
To demonstrate this with an example, we can look at the German Bund from the 5th of November, 2021.
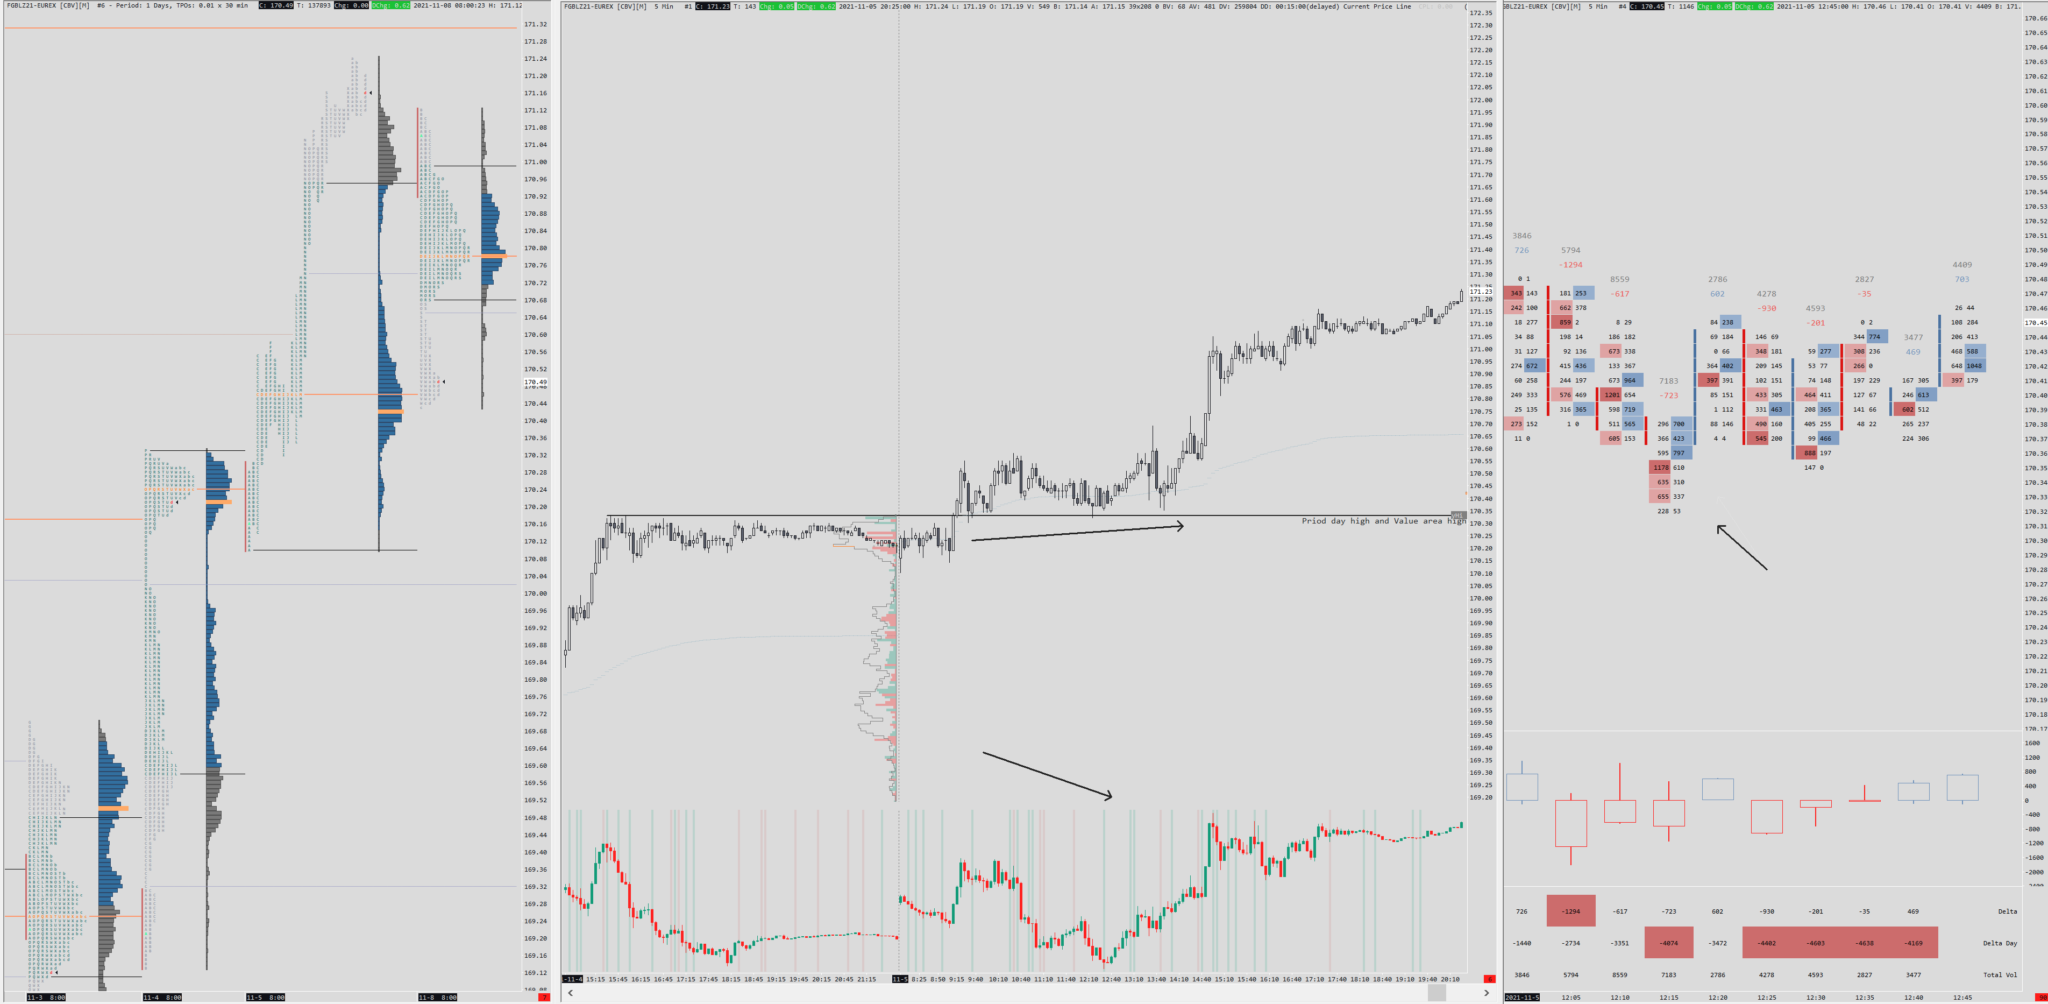
As you can see market broke above the prior day range, which was also a VAH.
From the cumulative volume delta and footprint, we can clearly say that aggressive sellers were trying to take the market back below but got heavily absorbed by passive buyers.
Once you get this information from the market profile and orderflow, you can profit by taking long and holding the trade for a few prices higher or towards the end of the trading session.
Now let’s look at an hourly Bund chart; as you can see, we have been in a strong uptrend for the last week.
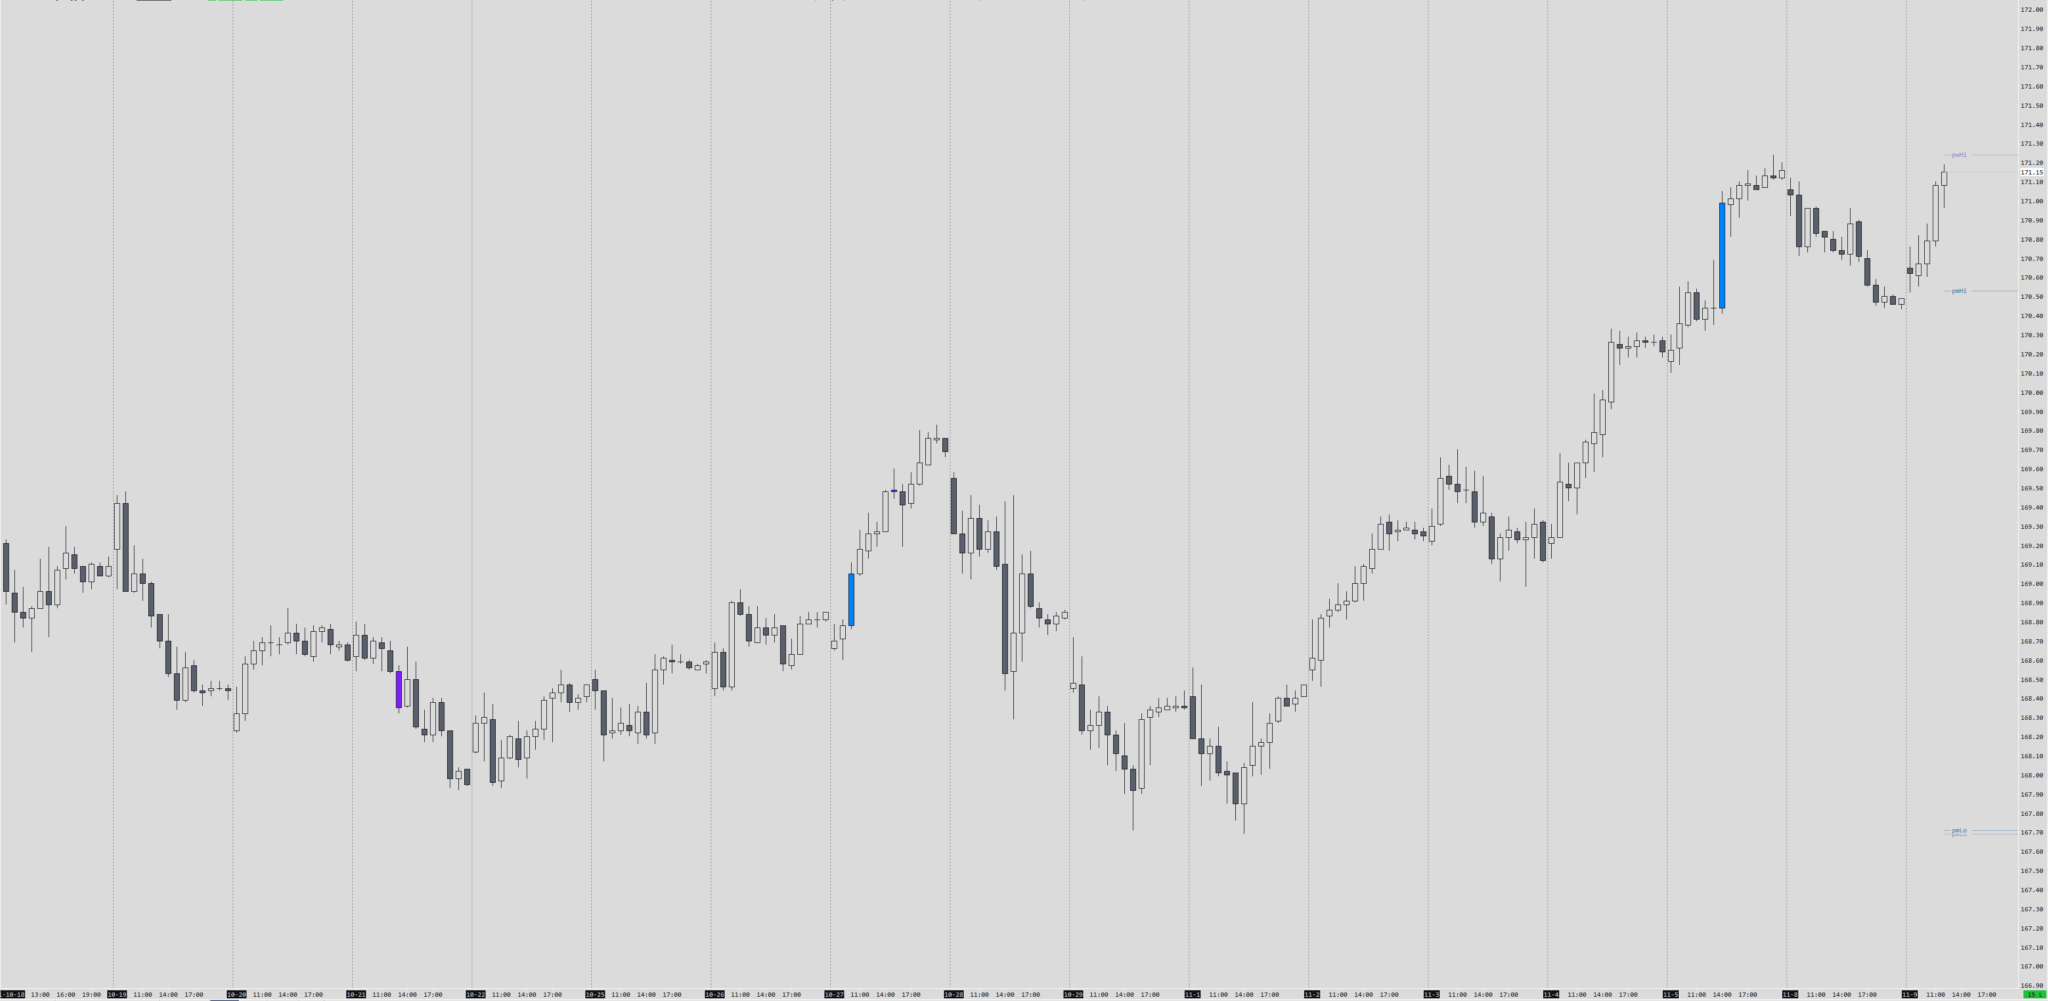
Compared to short term intra-day moves, the long term swings in price don’t happen because of inefficiencies in the orderflow, but due to fundamental beliefs of long term market participants.
Bund, which has been in a multi-year range, is a great example of this as those market participants that trade with large size are not interested in participating in intraday moves and trade for a few ticks; they rather wait for the market to reach clean higher timeframe levels where they know there will be enough liquidity to get in/out of the market.
Most retail traders often disregard fundamentals completely, yet at the same time, they are swing trading crypto and have 48 long positions opened at the same time.

So can we use volume/orderflow for swing trading, or is it not worth bothering with, and we should stick with simple indicators?
DOM/Heatmaps
If there is something I feel is not worth using with swing trading, it would be DOM and heatmaps.
These tools are made for daytraders/scalpers as the edge in them is not as straightforward as it seems.
Just ask yourself why anyone who is trading a large size willingly put it in the order books for anyone to see and potentially front-run it.
Although it happens from time to time, most of this size is usually spoofing.
It doesn’t mean that there is no edge in using DOM/heatmaps, but you need a lot of practice so you will be able to spot pulling/stacking orders, spoofs and so on.
This will take place on very short timeframes, so using it for swing trading doesn’t make much sense.
Volume Profile/Market Profile
The concepts of auction market theory apply to all timeframes.
In the same way, you are using a daily profile; you can use weekly, monthly or build your composite profiles.
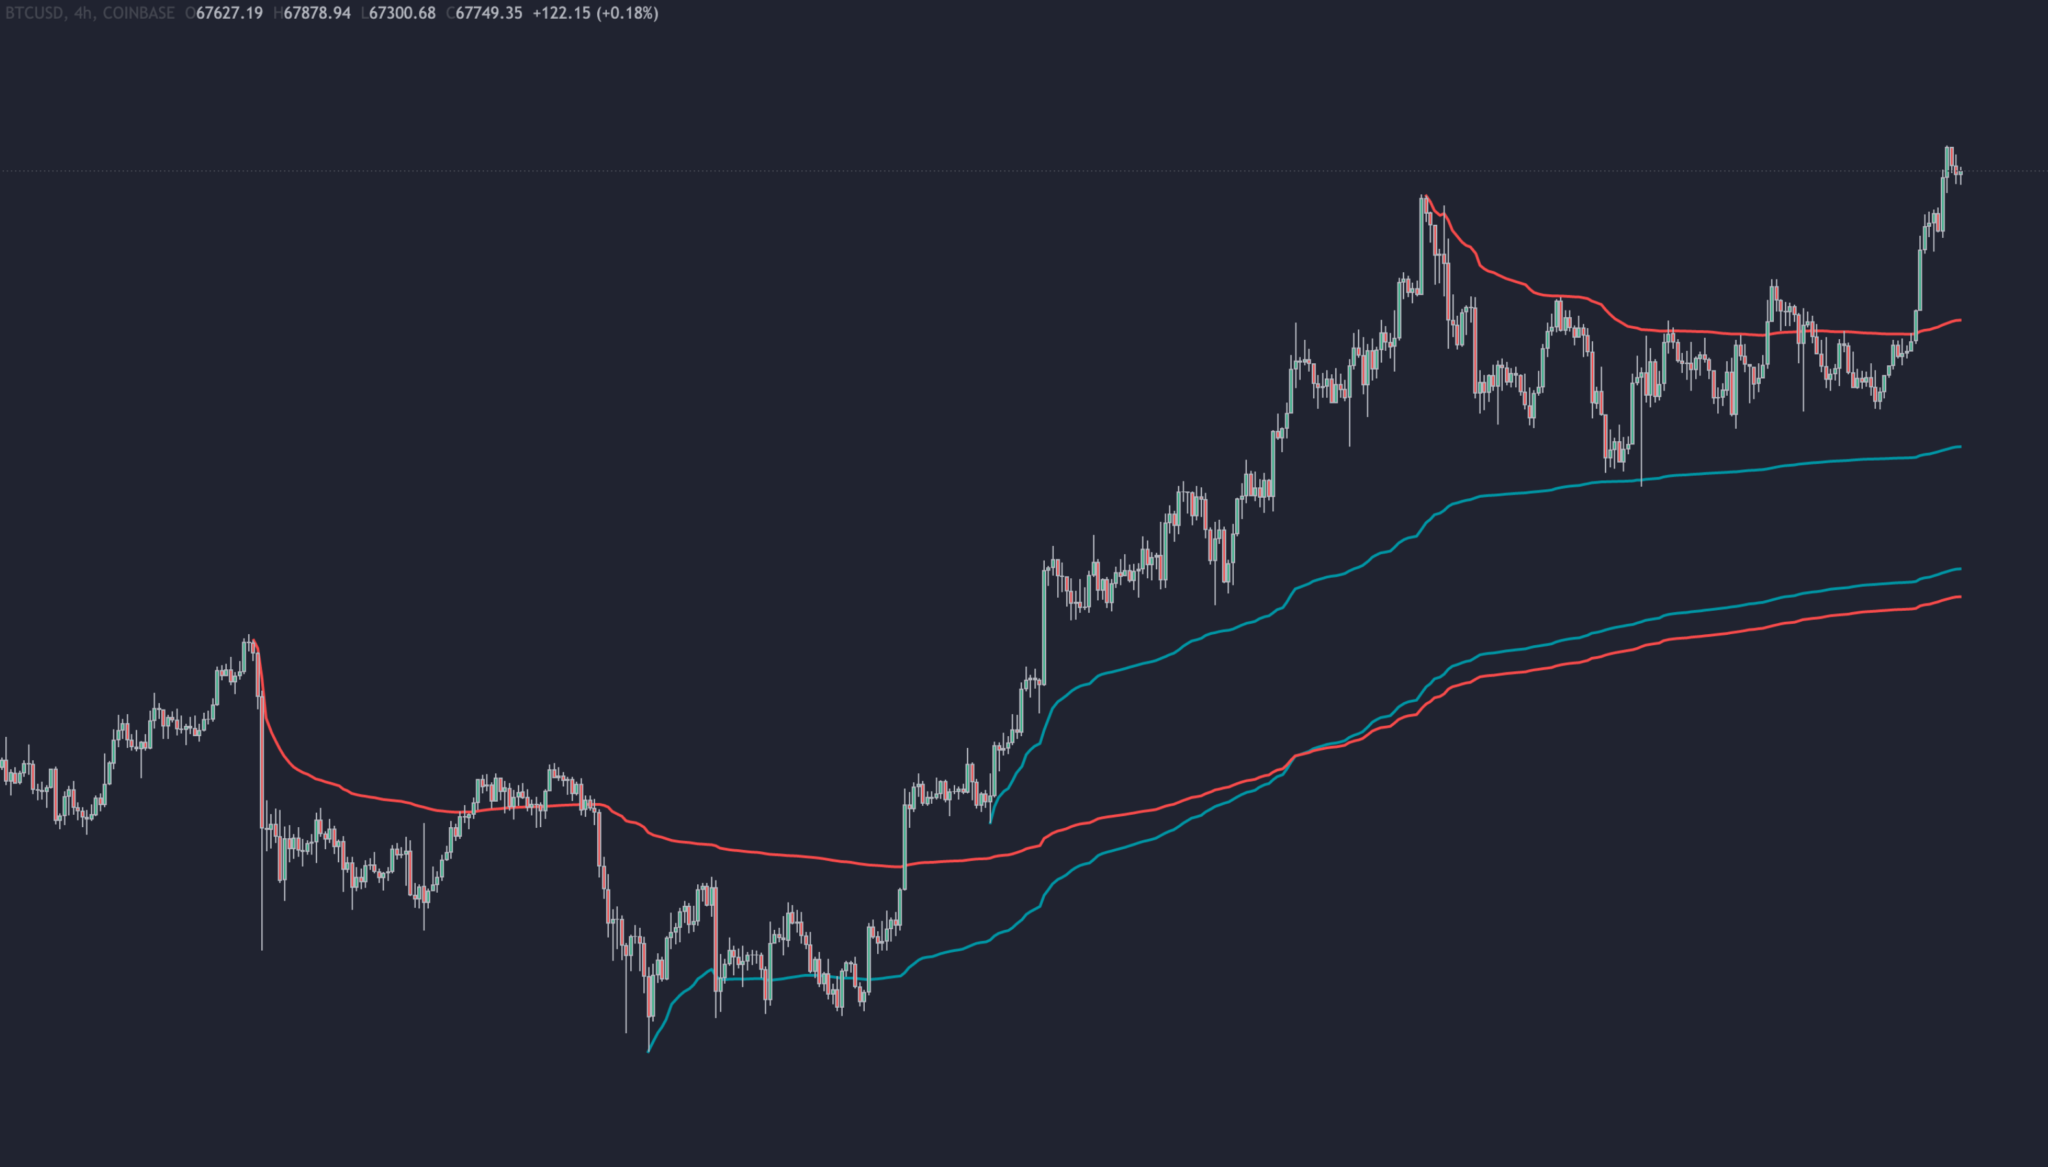
If we look at this H4 Bitcoin chart with a monthly volume profile plotted, we can see reactions every time the market traded around prior months Value area low, Value area high or POC.
What is, in my opinion, a better approach is building your composite profiles based on market ranges instead of focusing on fixed periods such as a month, week or a year.
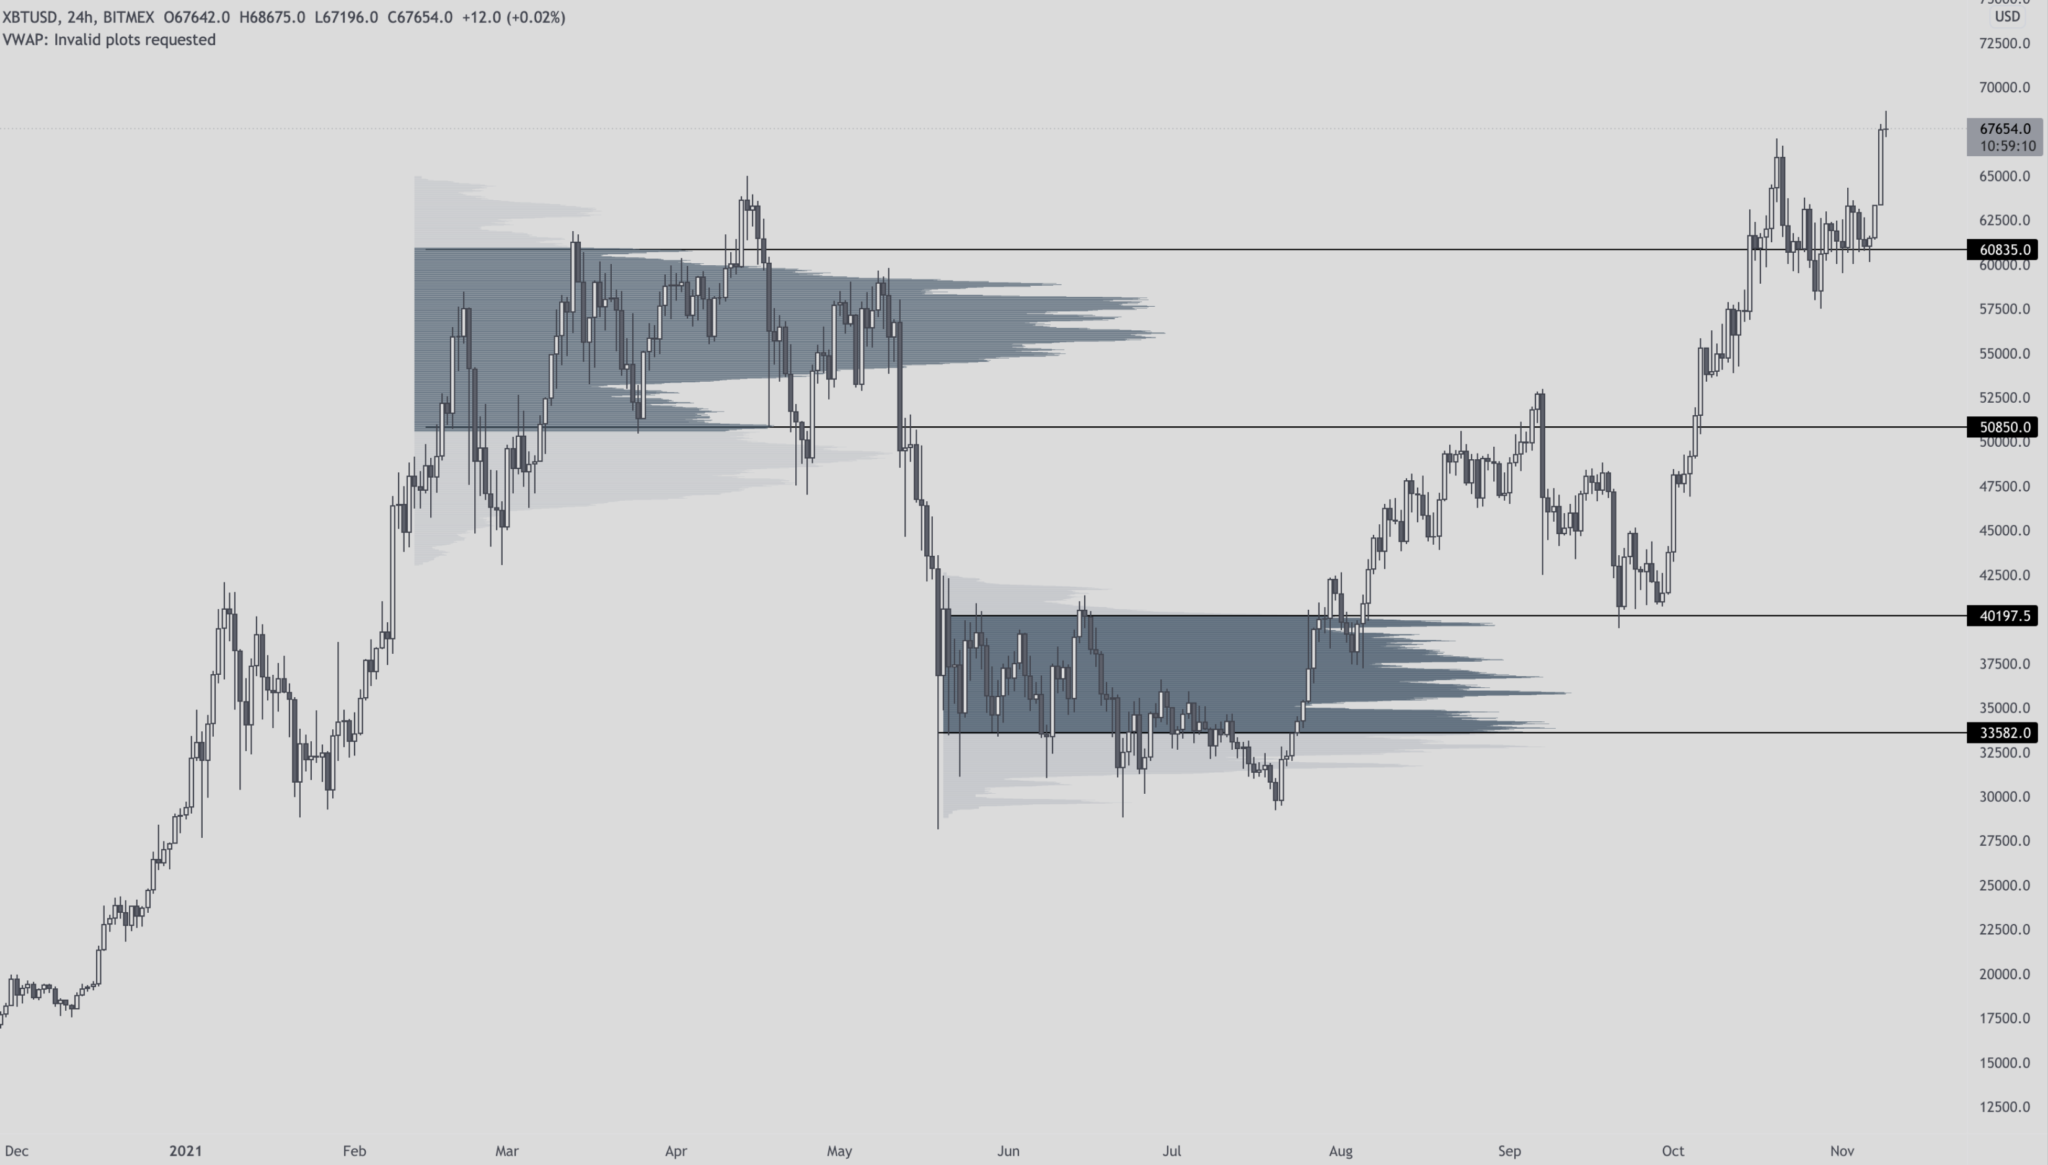
As you can see, building composite volume profiles over the two largest ranges on Bitcoin would give you very clear reference points for the future.
Volume weighted average price
Another indicator that is often associated with day trading is a VWAP (Volume weighted average price).
In the simplest sense, VWAPs can work as an alternative to more popular moving averages.
Although I wouldn’t necessarily look for a “crossover”, VWAPs work very well, like dynamic support and resistance levels.
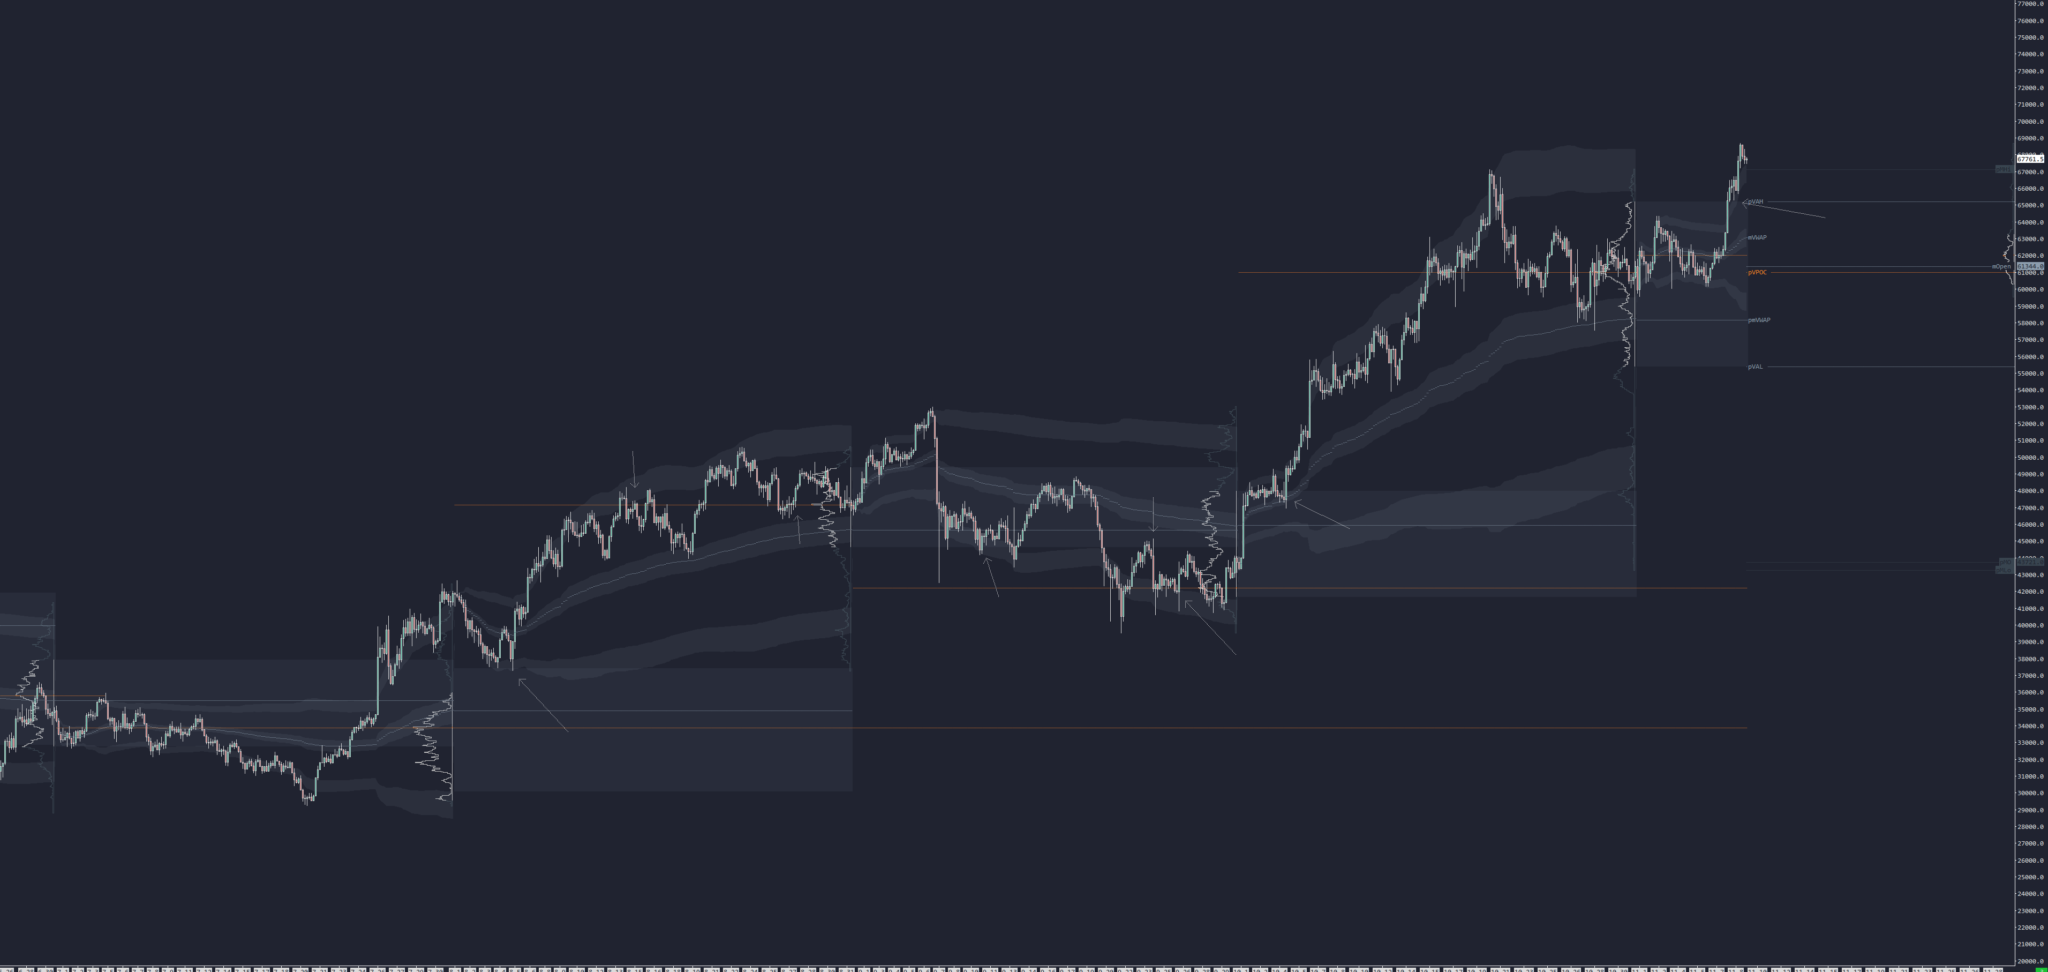
This can be seen on Bitcoin 8 hour chart with monthly VWAP plotted.
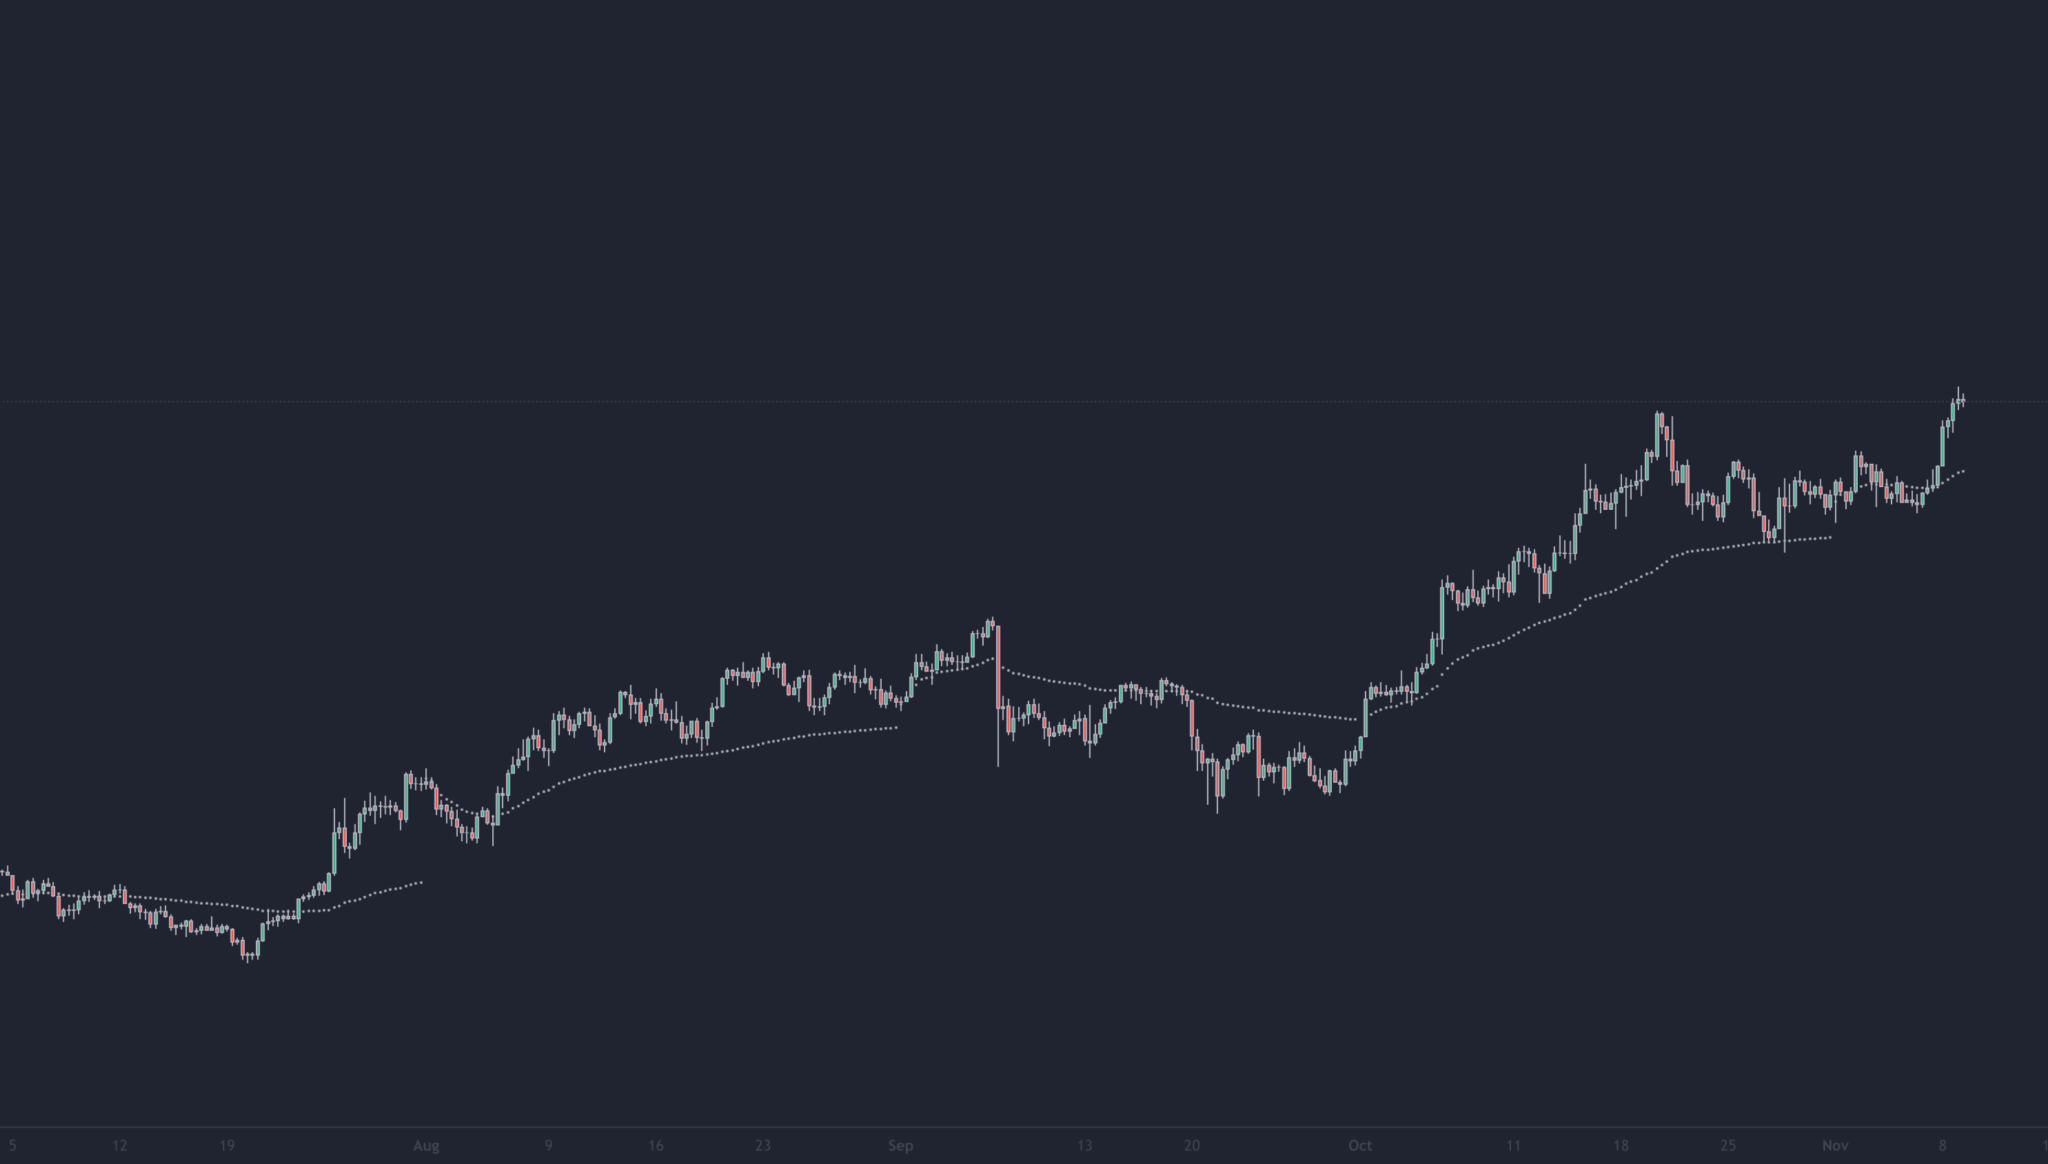
Same with the Volume Profile, it might be worth it to get more creative with the VWAP and instead of using a fixed period, try using anchored VWAP from key market swing points that you can find on daily or weekly charts.
You can see from this example how anchoring VWAP from key daily swing points would provide you will dynamic support and resistance levels for future reference.
Footprint charts
The last frequently used orderflow tool are footprint charts.
Although some of the features of the footprint chart are once again suited more towards day trading/scalping, there is still some alpha you can get from watching footprint charts, even on higher timeframes.
Especially in thicker markets, traders use footprint charts to spot absorptions, finished auctions that signal a lack of participation or buying and selling imbalances that give them a clear signal of buyers/sellers stepping in.
You can see this in the example above how the market retested VWAP with heavy selling, but it just couldn’t crack it.
The downtick was made with a nice 8×0, and the market just went up from there.
For daytraders, this is extremely relevant as they are looking at this zoomed-in picture to be able to get into the market as close as possible to the invalidation.
If you are executing trades on an hourly chart, do you care that much if the market goes a few ticks against you? Probably not.
But using a footprint chart and looking at where trading happened inside the candle and what buyers and sellers did can still be extremely useful.
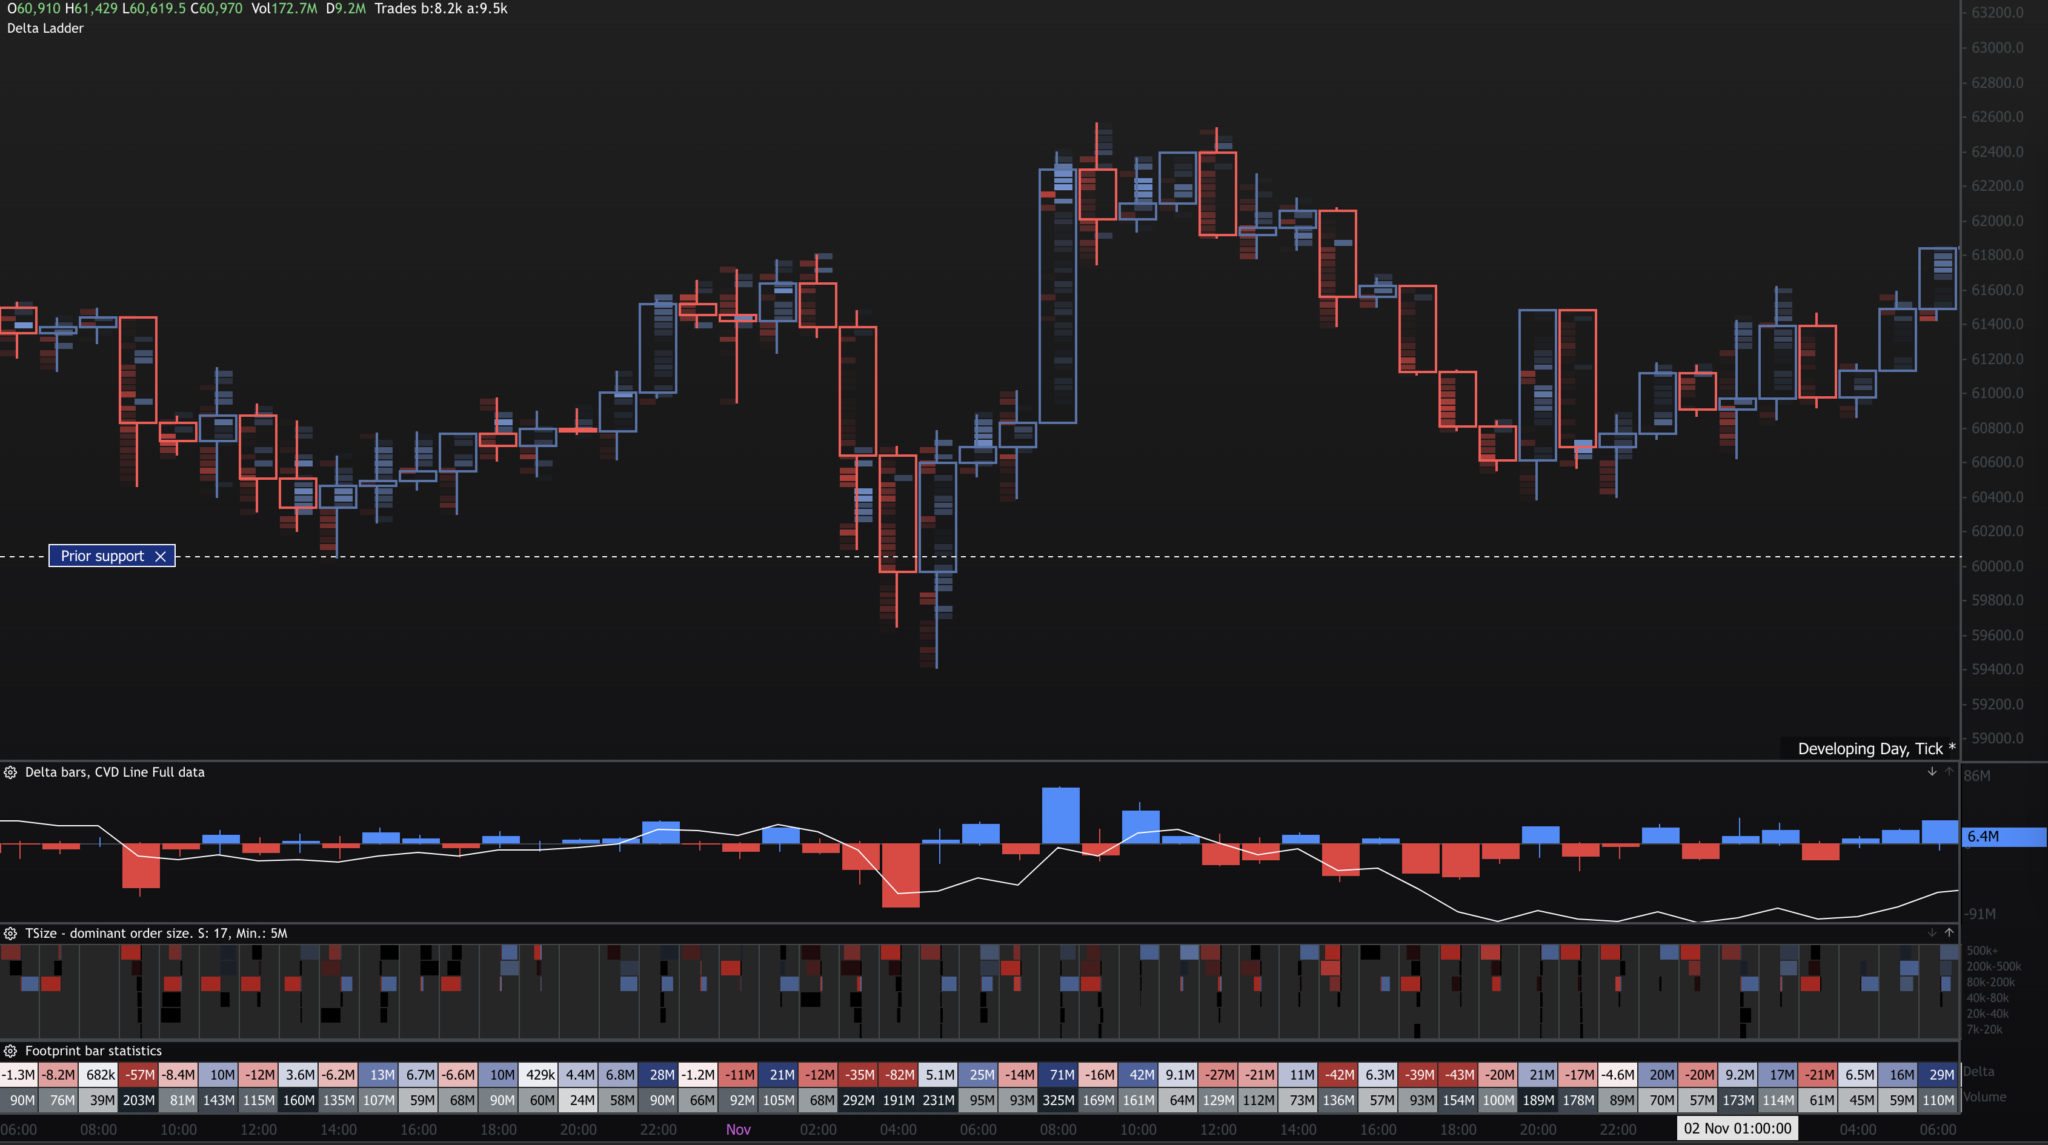
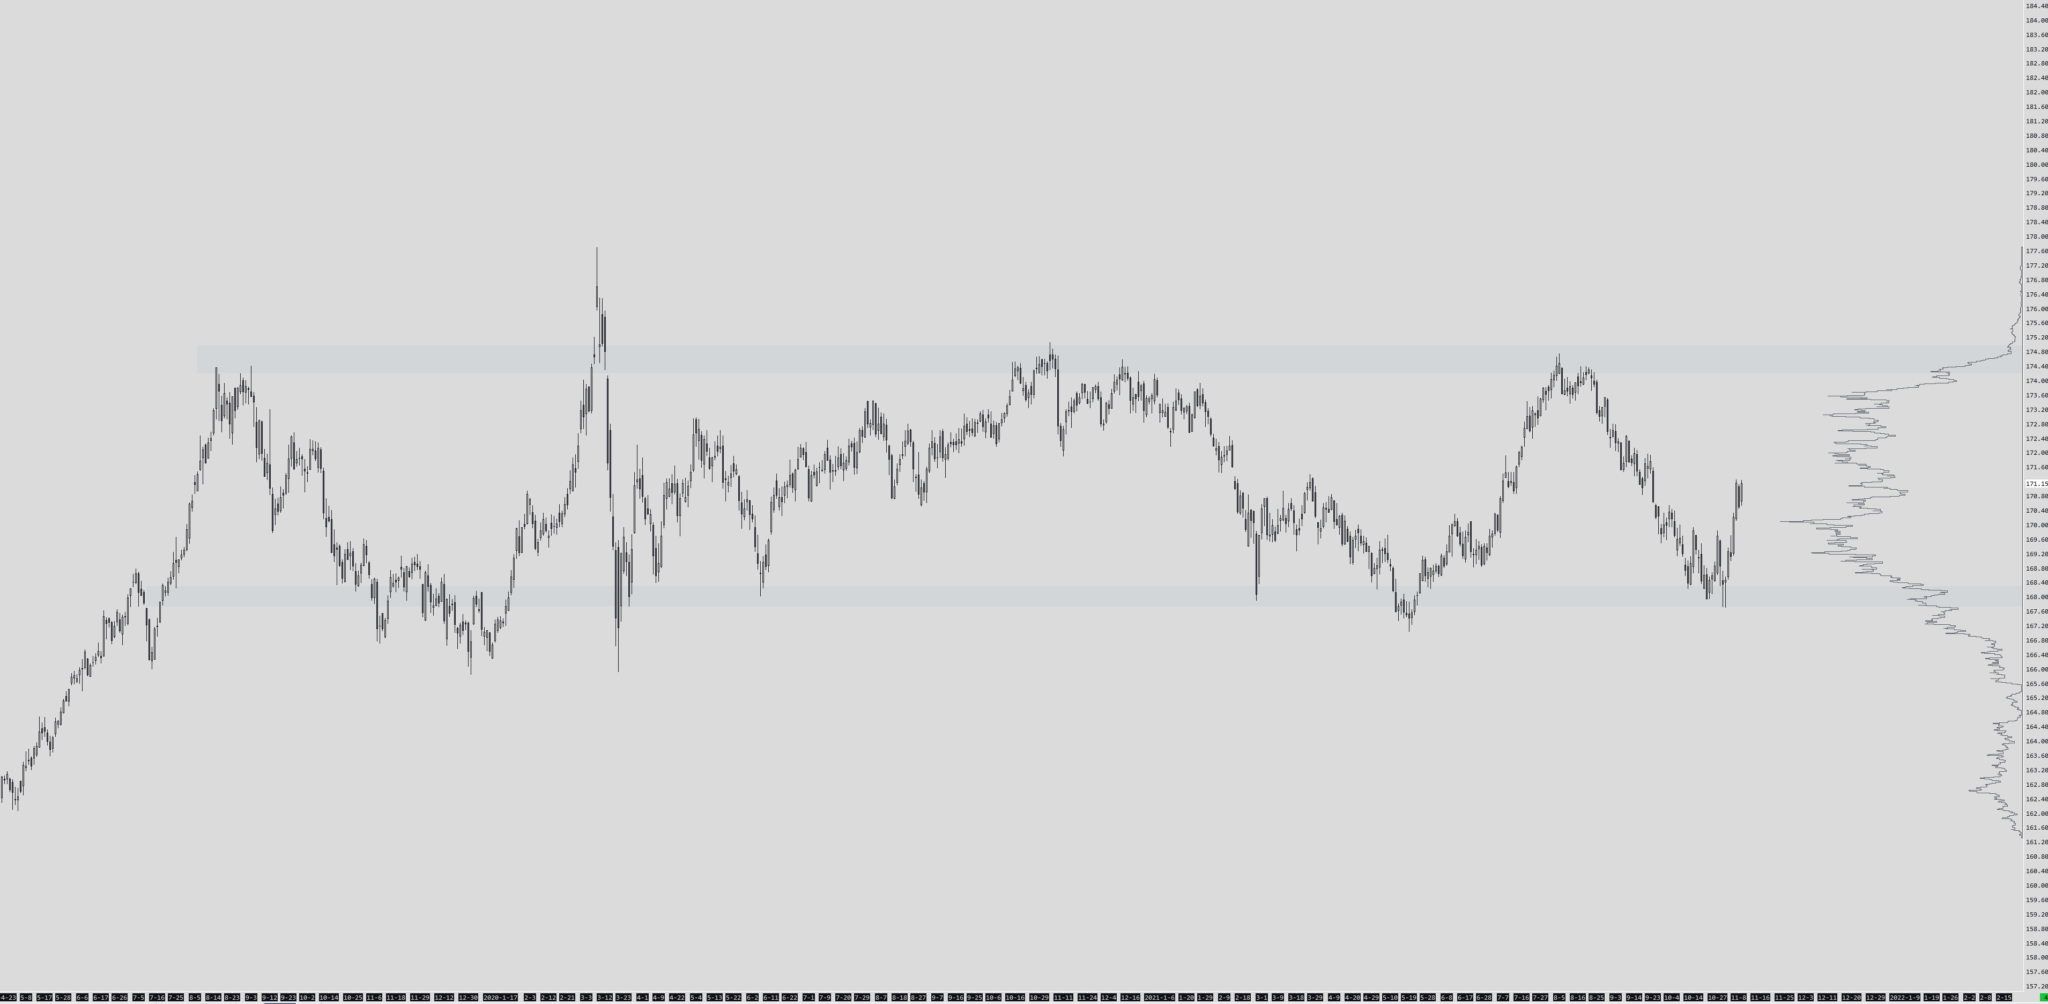
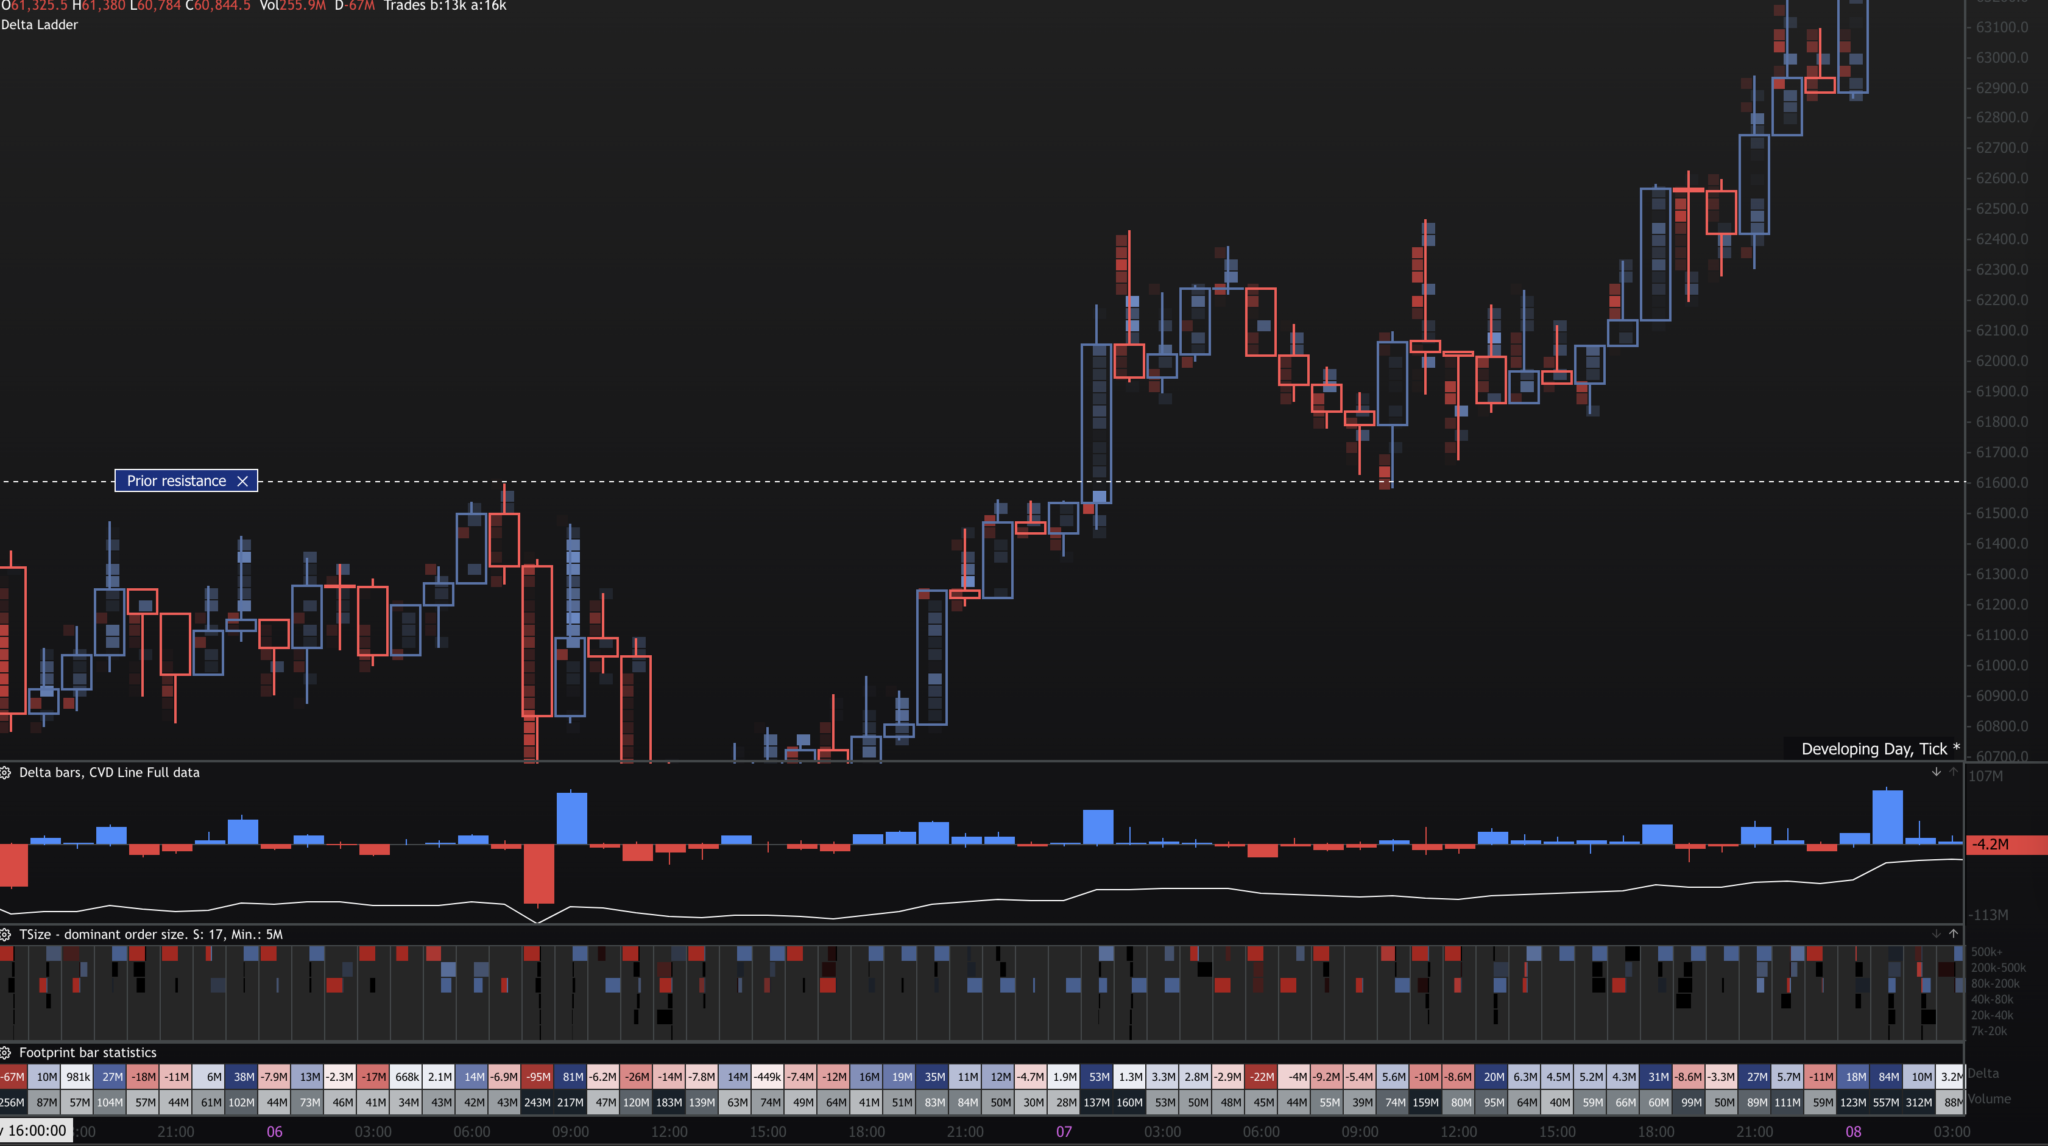
As you can see in this example market traded below the prior support on high volume and high negative delta; if you take a closer look, you will also see dominant selling inside the wicks of both candles below the prior support.
What does this tell us? It tells us that sellers tried to break this level (neg delta + high volume) but got absorbed by passive buyers.
You can also see how the market tested the bottom selling candle before the rally; this often happens as there are still unfilled orders in areas of high participation.
A footprint chart can also be useful in trend following instead of looking for mean-reversion.
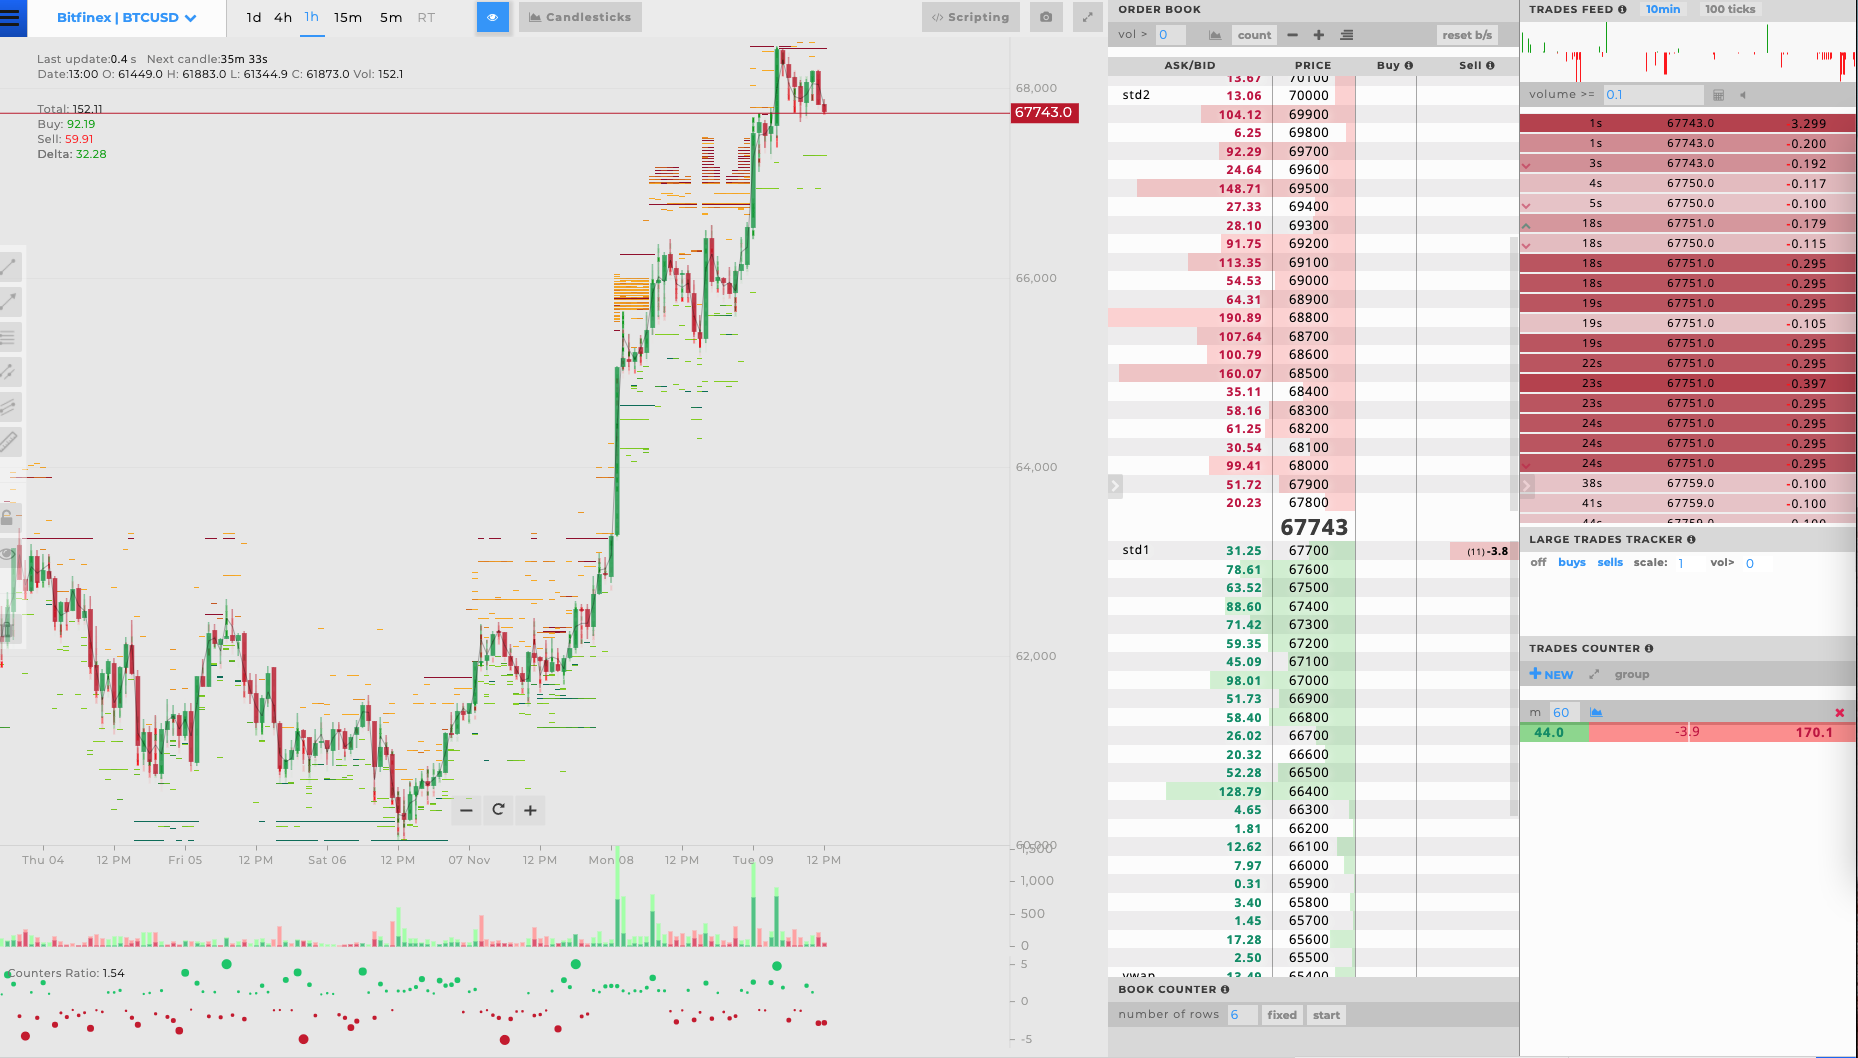
If you look at this example, the market broke the support on high positive delta and volume; this tells us that buyers are interested in exploring higher prices.
Since the market did not mean-revert immediately and started building time and space above resistance, we can use this interest in buying as our confluence to the classic S/R flip setup.
Conclusion
If you are not a long term investor who is only doing business on weekly or monthly charts, it is worth exploring market profile and orderflow tools.
The volume profile and concepts of auction market theory can offer you strong levels of support and resistance, which will very often go hand in hand with other indicators or price action and orderflow can help you with the confluence on your entry points or give you additional conviction on your trade ideas.
If you are interested in how I use these concepts in trading, check out the Trading Blueprint.
nufty73
Awesome content, as always.