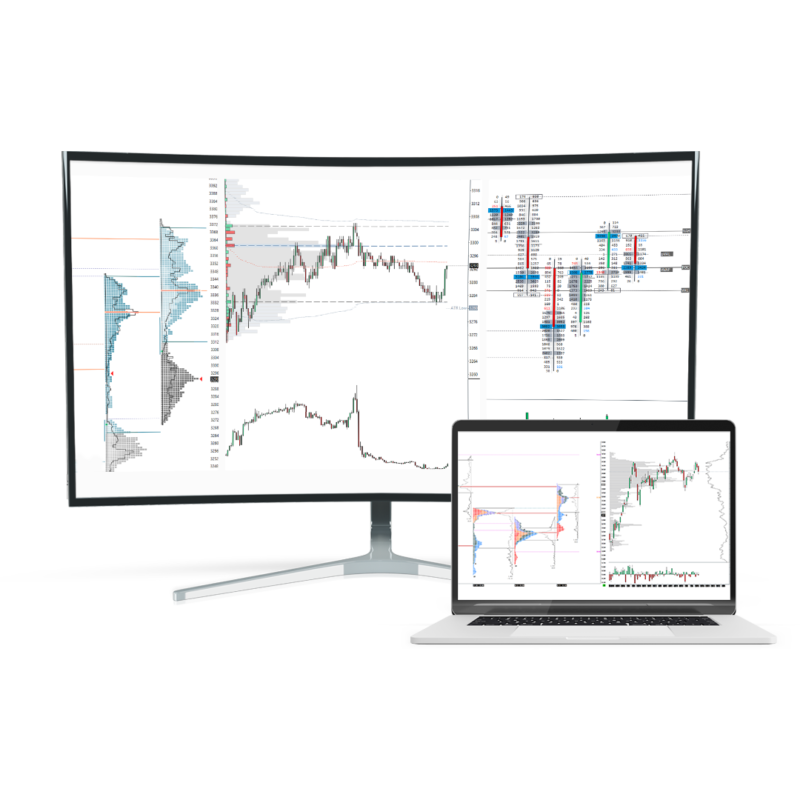

Trading With Data-Based Charts – Tick, Renko, Volume, Delta, Range and PnF Charts
There is a lot of trading education on the internet; some focused on trading futures, some on stocks or forex.
One thing that is the same in the vast majority of videos, courses and articles is that examples are demonstrated on time-based charts.
Whether it’s a monthly, daily, hourly or 1-minute chart, these timeframes are what most brokers and trading platforms offer, making it the most popular amongst the traders.
But with the huge popularity of electronic trading since the early 2000s, more sophisticated platforms started to offer different charts.
These are not based on time but on data.
How they are calculated, and are they worth to use?
This is what we will explore in this article, where I will talk about why you might want to experiment with data-based charts and some cons of classic time-based charts and my favourite chart type I for my trading.
If you like this article, read the rest of the blog or join the Tradingriot Bootcamp for a comprehensive video course, access to private discord and regular updates.
For those who are looking for a new place for trading crypto, make sure to check out Woo. If you register using this link and open your first trade, you will get a Tier 1 fee upgrade for the first 30 days, and we will split commissions 50/50, which means you will get 20% of all your commissions back for a lifetime. On top of that, you will receive a 20% discount for Tradingriot Bootcamp and 100% free access to Tradingriot Blueprint.
Table of Contents
Time-based Charts
Before we go into the data-based charts, let’s have a look at the typical charts based on time and look at some of the pros and cons of them to understand why a lot of traders seek data-based alternatives.
Time-based charts are very commonly used.
If you open an H1 chart of a given instrument, the cycle of every candle takes 60-minutes.
Using time-based candles is more than fine, but as most price action traders use candle closes as bias confirmations, it can lead to some confusing decision.
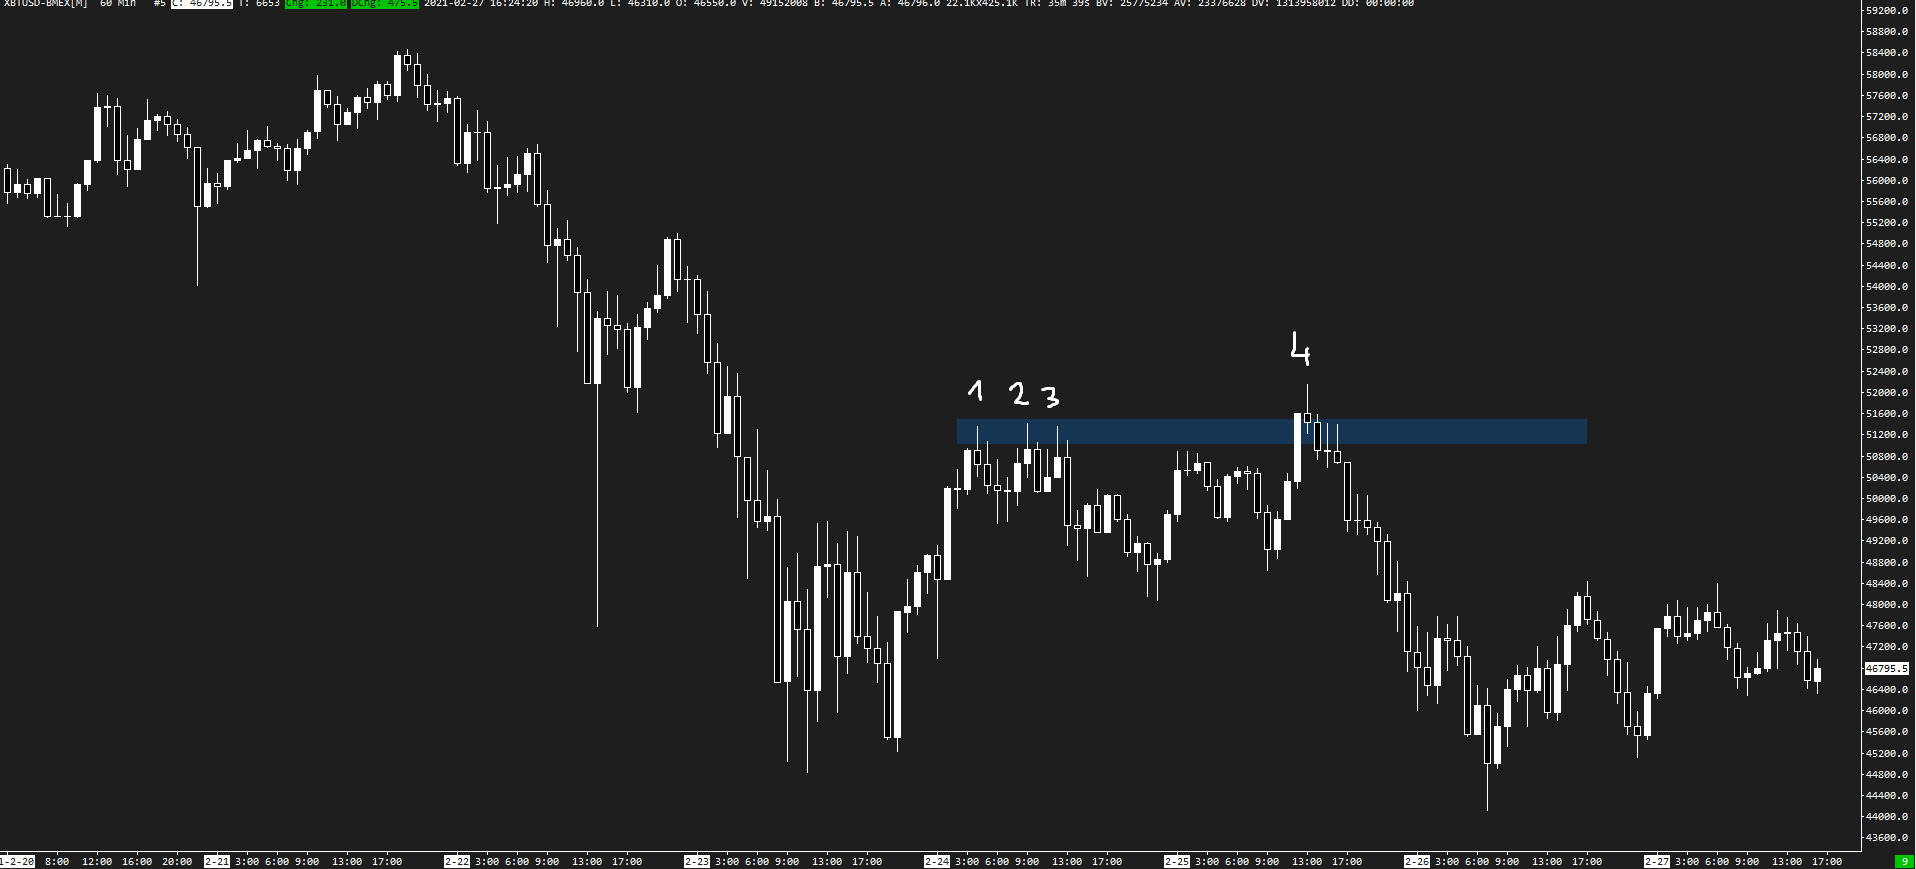
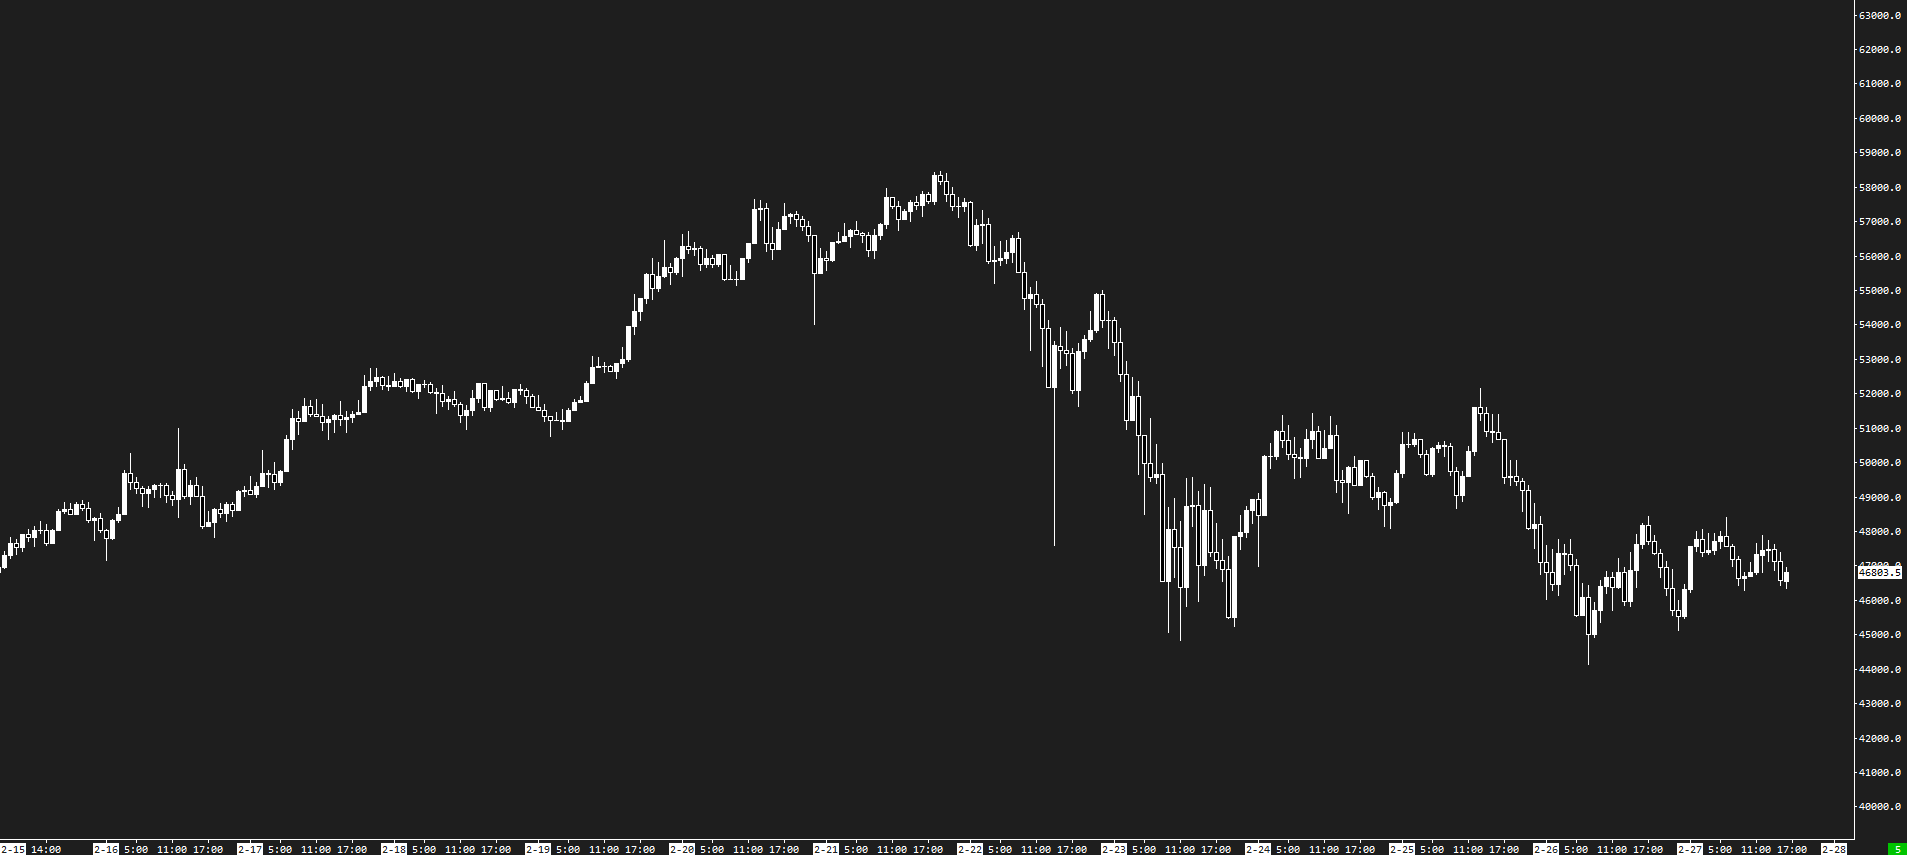
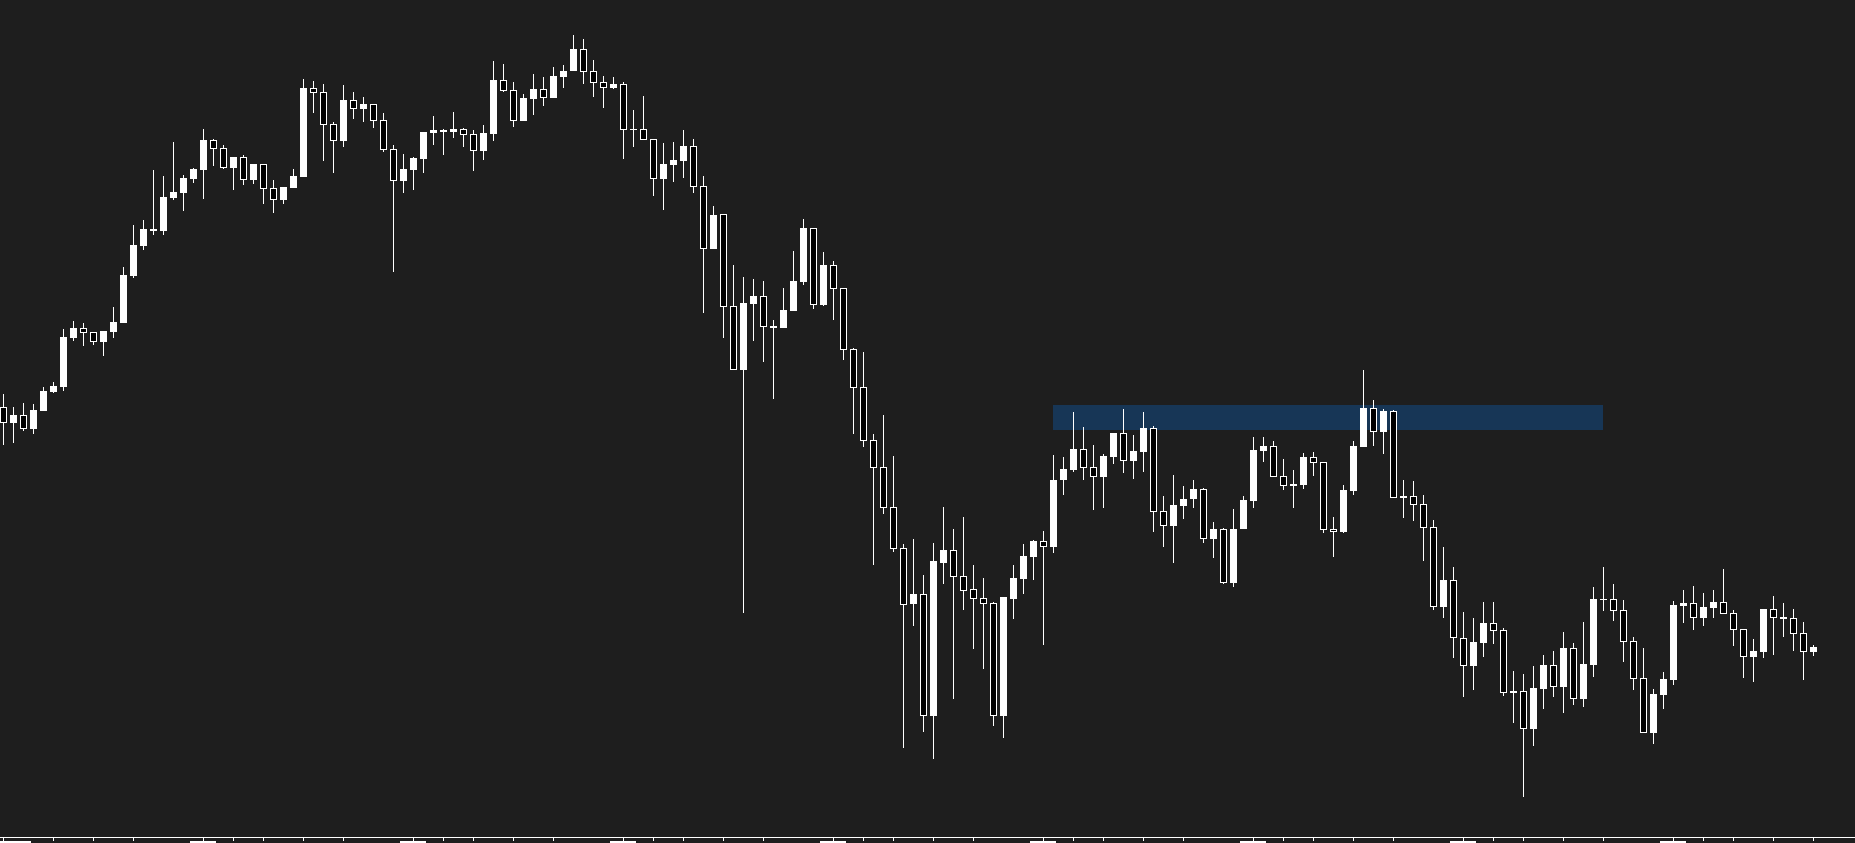
For the example above, you can see a Bitcoin 60-minute chart with a clean resistance level tested three times.
This will be an interesting area for most traders to do business in either buying a breakout or selling a false break above.
On this, the 60-minute chart story is quite telling.
A strong bullish close through the resistance is giving a clue of bullish continuation.
But if we change this chart to a 70-minute timeframe, these 10 extra minutes tell quite a different story.
Suddenly, the strong bullish close looks much weaker, and this does not look like a solid long trade anymore.
Which, as you can see, turned out to be a good idea as the market sold off.
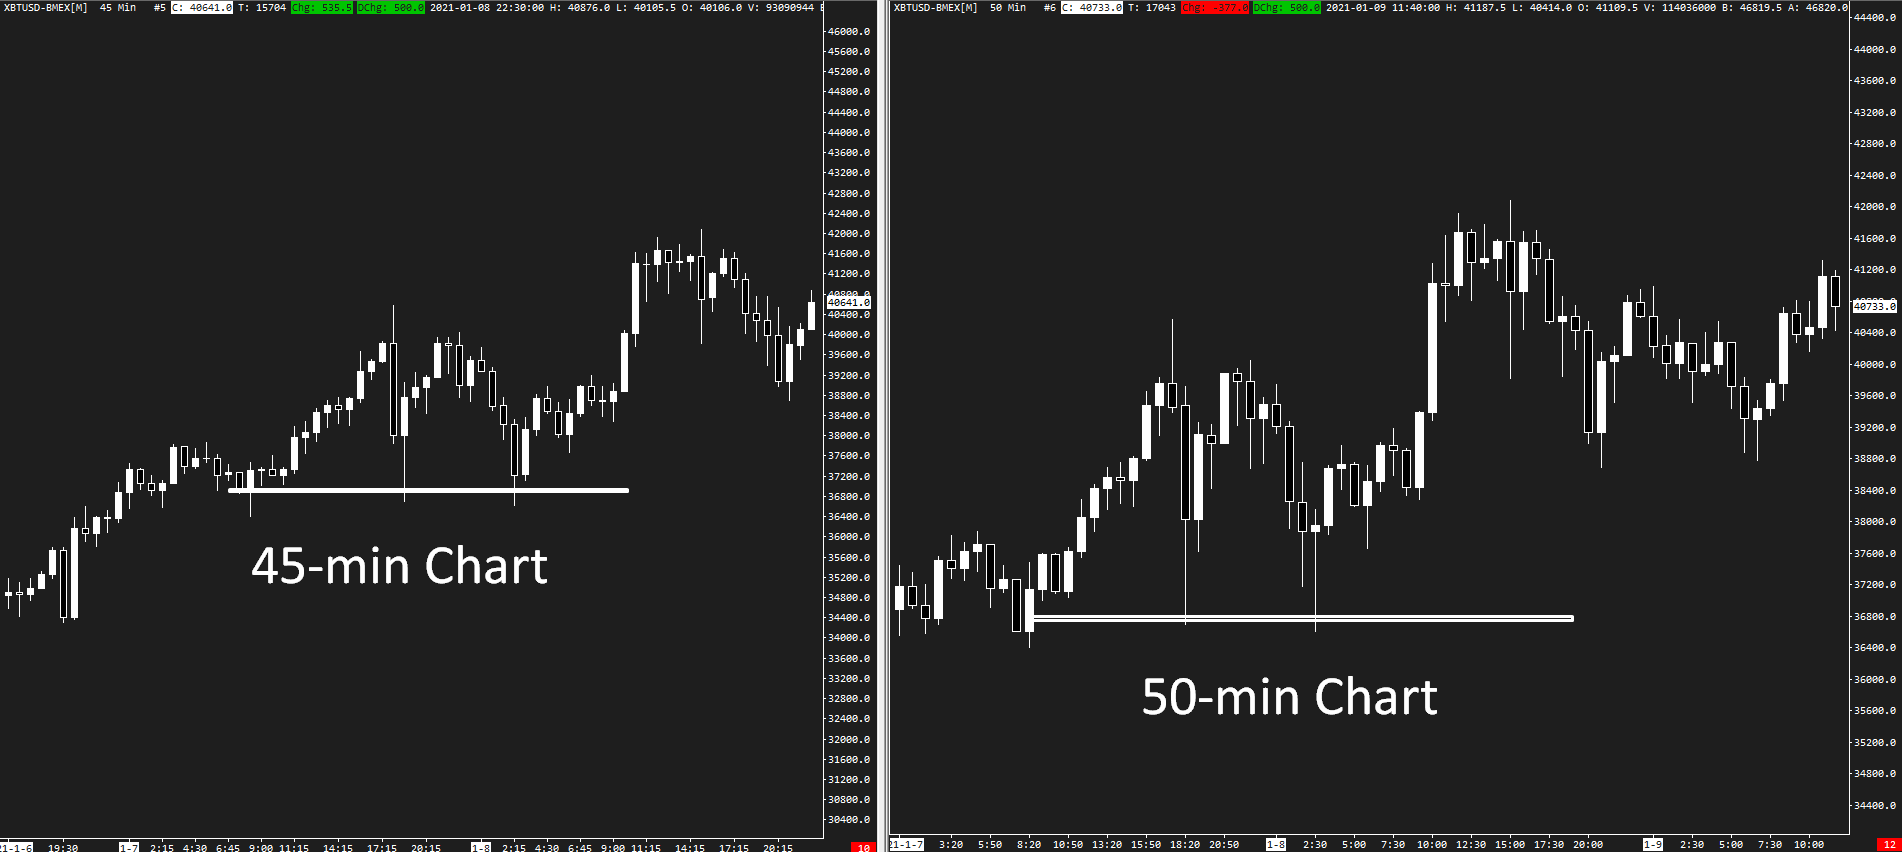
As you can notice in this example, sometimes even a few minutes can print a completely different picture.
45-minute chart indicates a weak market that is about to break support, but 50-min candle close just showed the false break with candle closing much higher a clean long continuation.
Another issue of using a time-based chart is the noise.
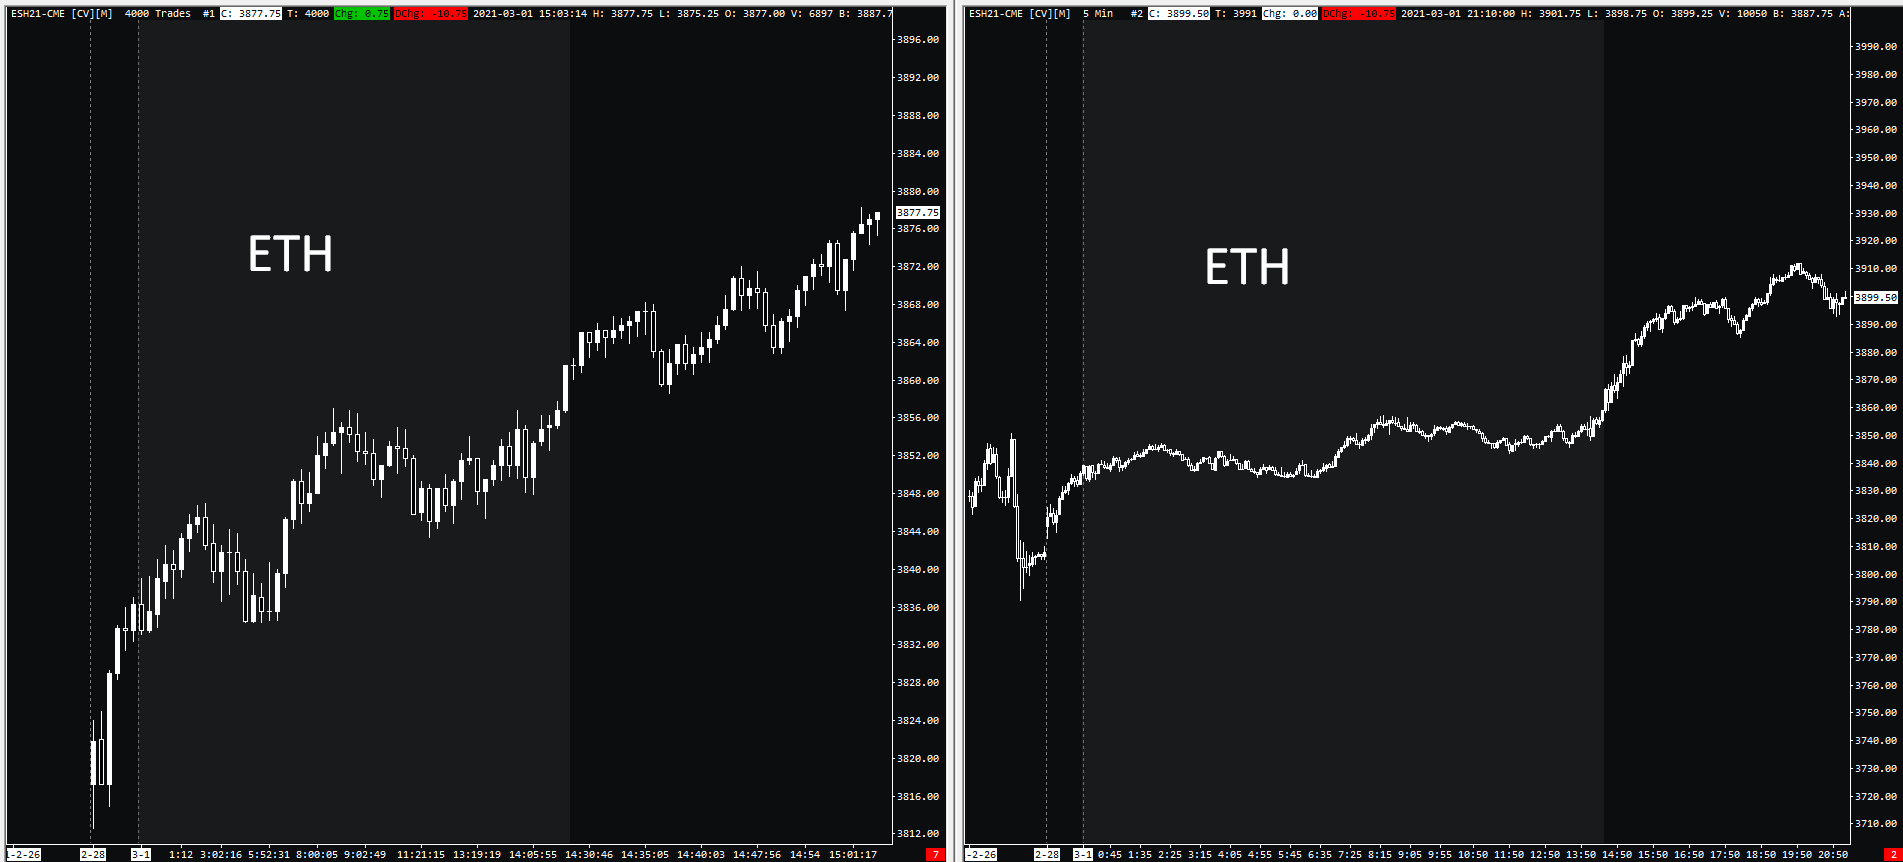
Many legacy futures markets like e-mini S&P500 futures traded on CME or Euro Stoxx 50 futures traded on Eurex are separated into RTH (regular trading hours/cash hours) and ETH (Globex/electronic session).
The RTH (pit hours) are the ones with a large influx of volume where we can find many trading opportunities compared to ETH, where most of the price movements can be classified as noise.
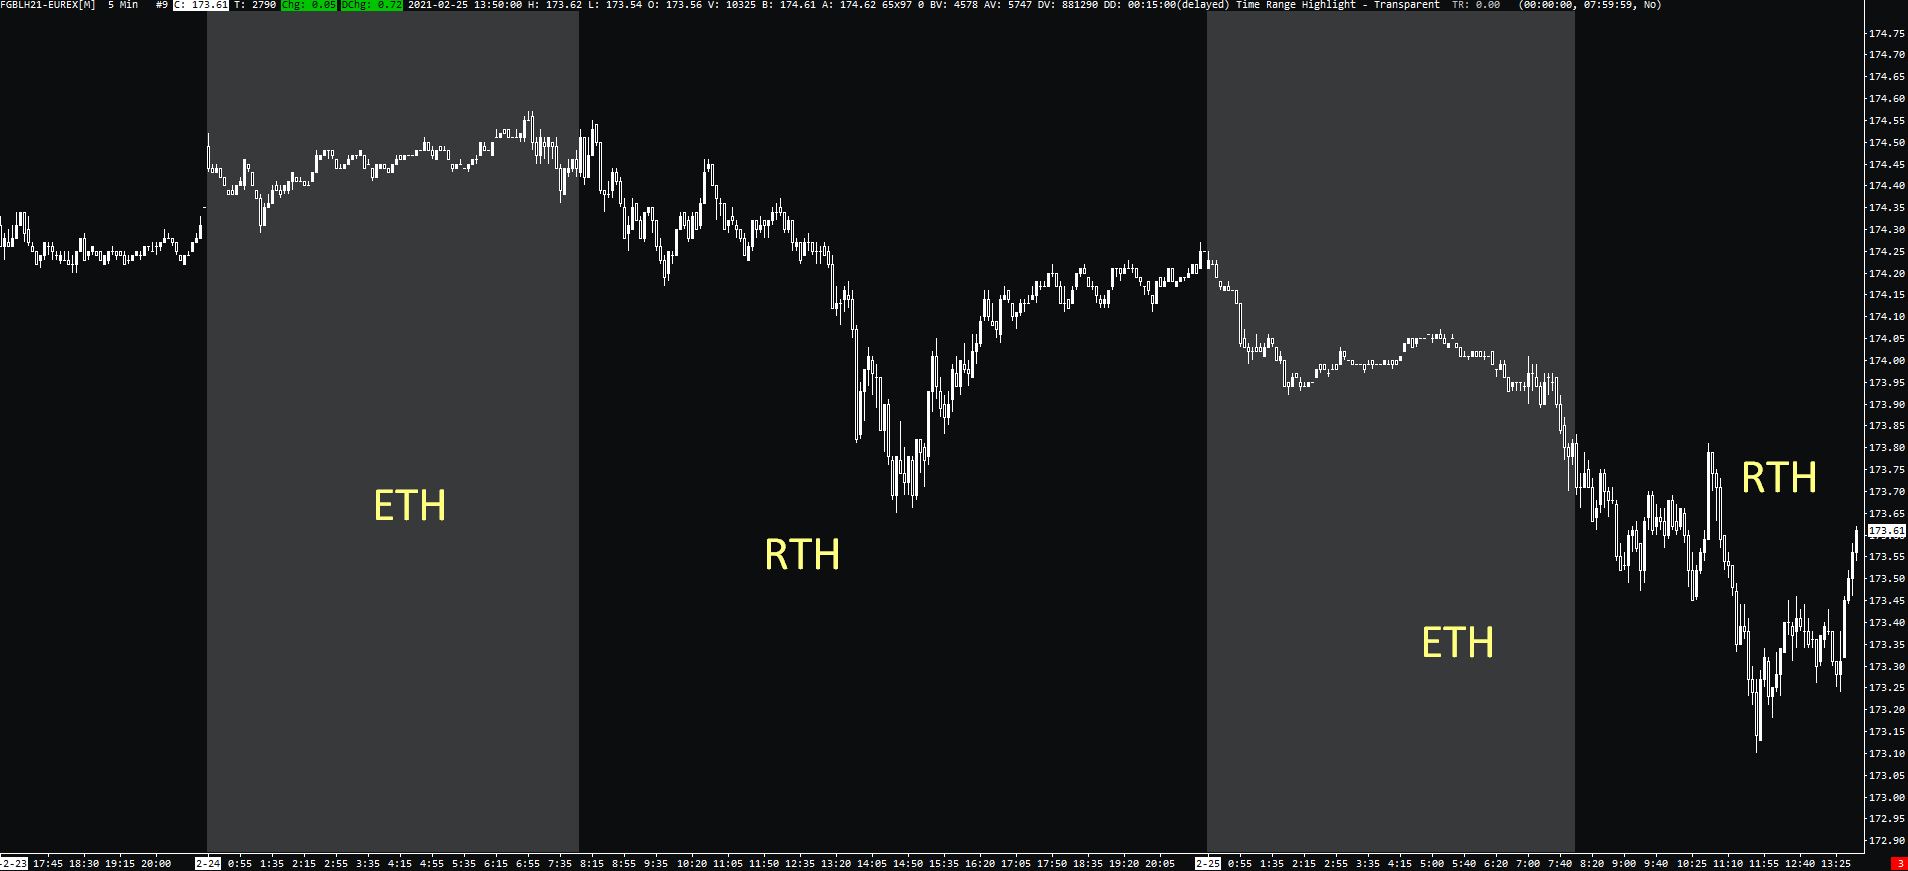
This is demonstrated on the 5-minute Bund (FGBL) chart with ETH from Midnight to 8 am CEST and RTH from 8 am until the market close at 10 pm CEST.
As you can clearly see, the ETH session is represented by many chops and even gaps within the single candles as liquidity is very low.
If we change the setting from time-based chart to tick chart, you will be presented with a much cleaner chart that reduces all the noise.

If you take aside the noise that a time-based chart creates and try to be less strict with specific timeframes, time-based charts will always be a solid choice to use.
Weekly, daily, 1-hour, 30-minute, of 5-minute timeframes are extremely popular, and they will always play significance in the decision making of a lot of traders and trading algorithms.
Also, data-based charts are constantly changing due to volatility.
10-Renko chart can be optimal for trading one day, but minute volatility kicks in (or dry-down), it can instantly become too fast or slow.
This is not the case for time-based charts.
Now that we covered some pros and cons of time-based charts, let’s look at data-based alternatives.
Data-based charts
Before we start, it is worth to mention you won’t find these with all platforms.
All examples are from Sierra Chart and Point, and Figure charts can be found on Tradingview.
If you came to this article to find out which chart is the ultimate key to trading the markets, there is no such thing.
It is always up to personal preference and nothing more.
The popularity makes the following list of what I have seen traders use over the years.
Tick Charts
Tick charts are probably the most popular data-based charts, and they have also been my intraday chart choice for quite some time.
1 tick in a tick chart represents one executed transaction.
This means that at 4000 tick chart, a new bar is created every time 4000 trades have executed in either direction.
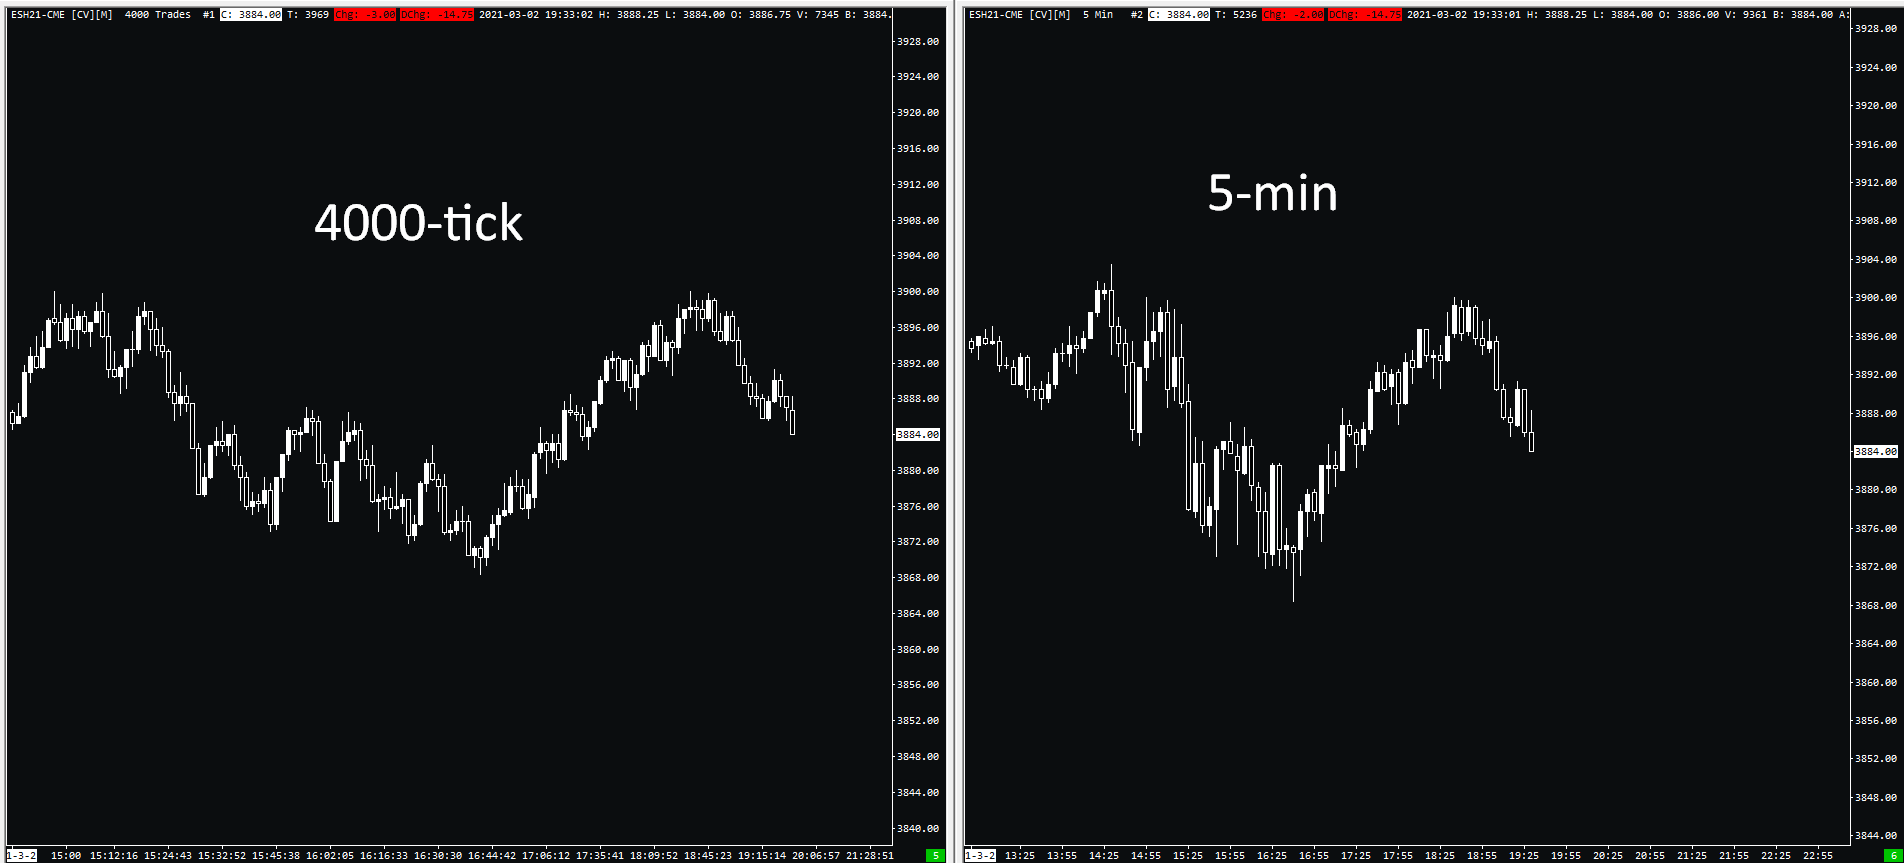
As you can see on the E-mini S&P500 example above, the 4000 tick chart shows more granularity and gives better insight into the price legs where there is a lot of activity going on.
During times of low volatility, tick charts will cut all the noise as there is very little trading activity going on.
Coming back to the 4000 tick chart example, it is important to realize that it doesn’t matter if there is 1 contract traded 4000 times or 1 person buy/sell 4000 contracts at one go.
This is why tools that are monitoring orderflow, such as footprint charts or volume profile, can be very useful.
If you are interested to see how I use these tools trading on tick charts, make sure to check out the Trading Blueprint.
Range Bars
Range bars were introduced in the 90s by Brazilian trader Vicente Nicolellis.
Nicolellis goal was to adjust his trading to the high volatility of Brazilian markets at the time.
Range bars are built on one pre-determined price increment.
They have the same height, and every bar closes at either high or low.
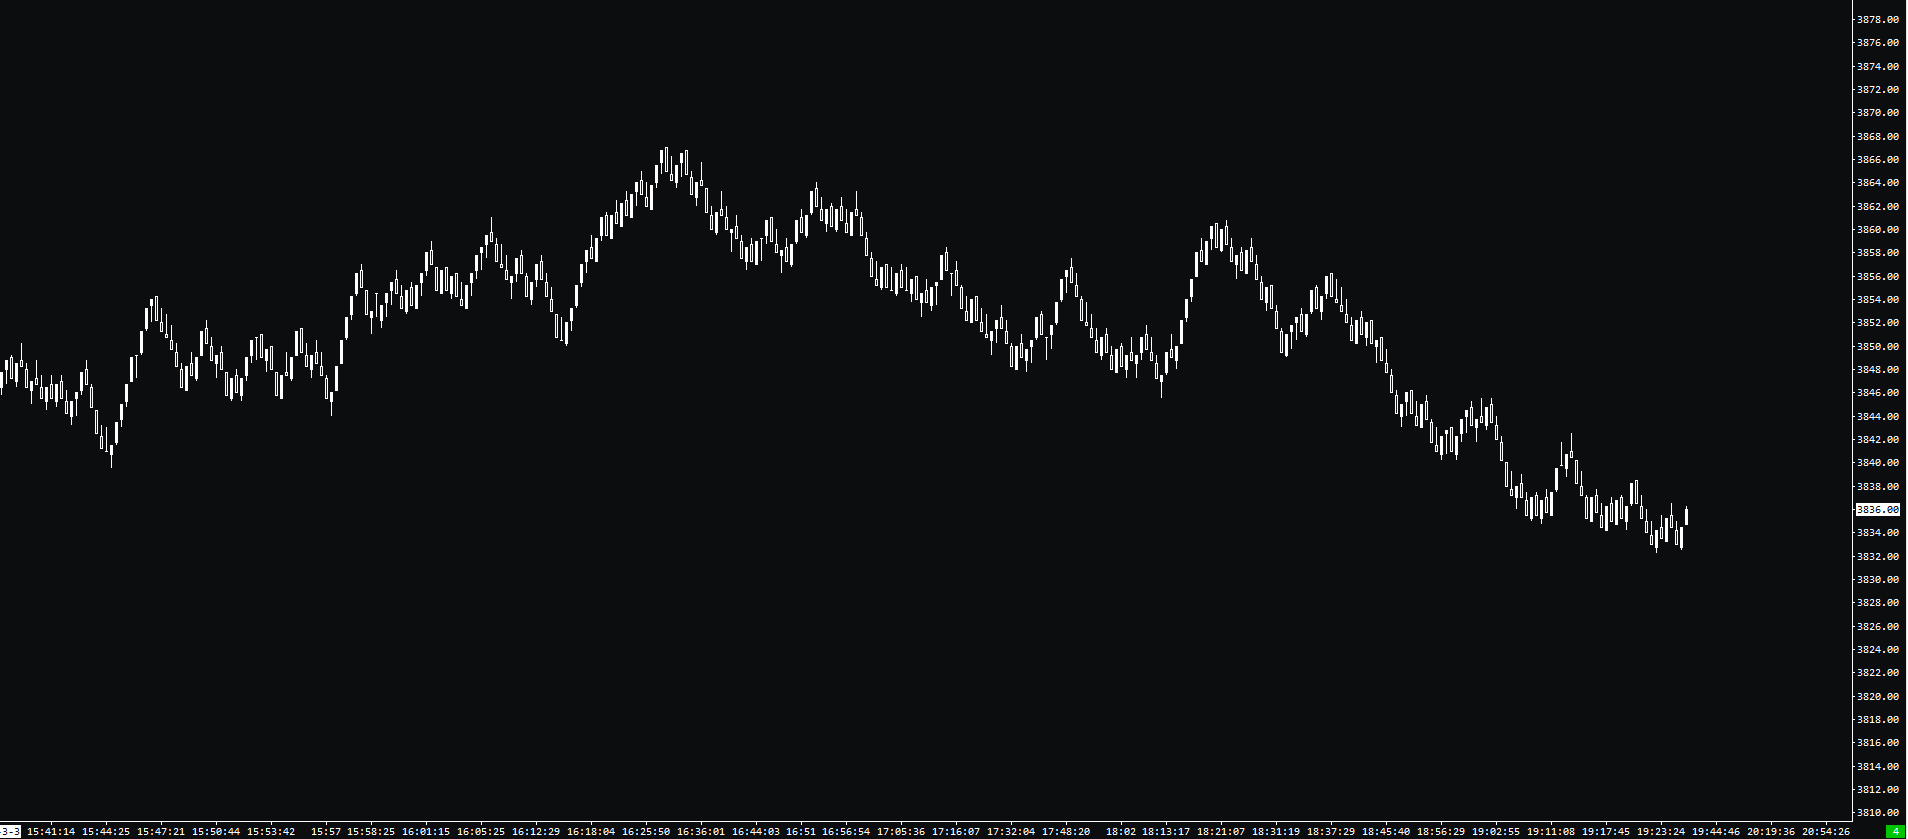
As you can see on the chart above, this is an 8 tick range bars of E-mini S&P500.
Since there are 4 ticks in 1 point, this chart represents 2 points.
Every time S&P5000 moves 2 points up or down in total, the new bar is created.
Thanks to this calculation, range bars never have long wicks and provide us with a clearer view of price rotations.
Same as a tick or other data-based charts, range bars eliminate noise during low volatility periods.
Renko
Renko charts are named from the Japanese word Renga which means “brick”.
They have a fixed size bricks that are printed based on price movements.
Bricks print only when a predetermined price movement occurs.
Renko charts are extremely popular as they show us clean price movements, but you can also use Renko charts for marking out support and resistance levels.
Renko charts can be used with many popular trend-following indicators and oscillators that mark out overbought and oversold levels.
Some trading platforms like Tradingview allow you to set Renko charts based on ATR rather than your pre-determined size.
This way, they will automatically adjust to the current volatility.
As you can see from the example above, this Renko chart also has wicks for every brick.
This is not a default setting for all platforms, and sometimes, these wicks are ignored.
This is made for “easier” visualization, but you can get yourself to the situation when you are stopped down from the trade on the wick, which won’t display in the final Renko brick.
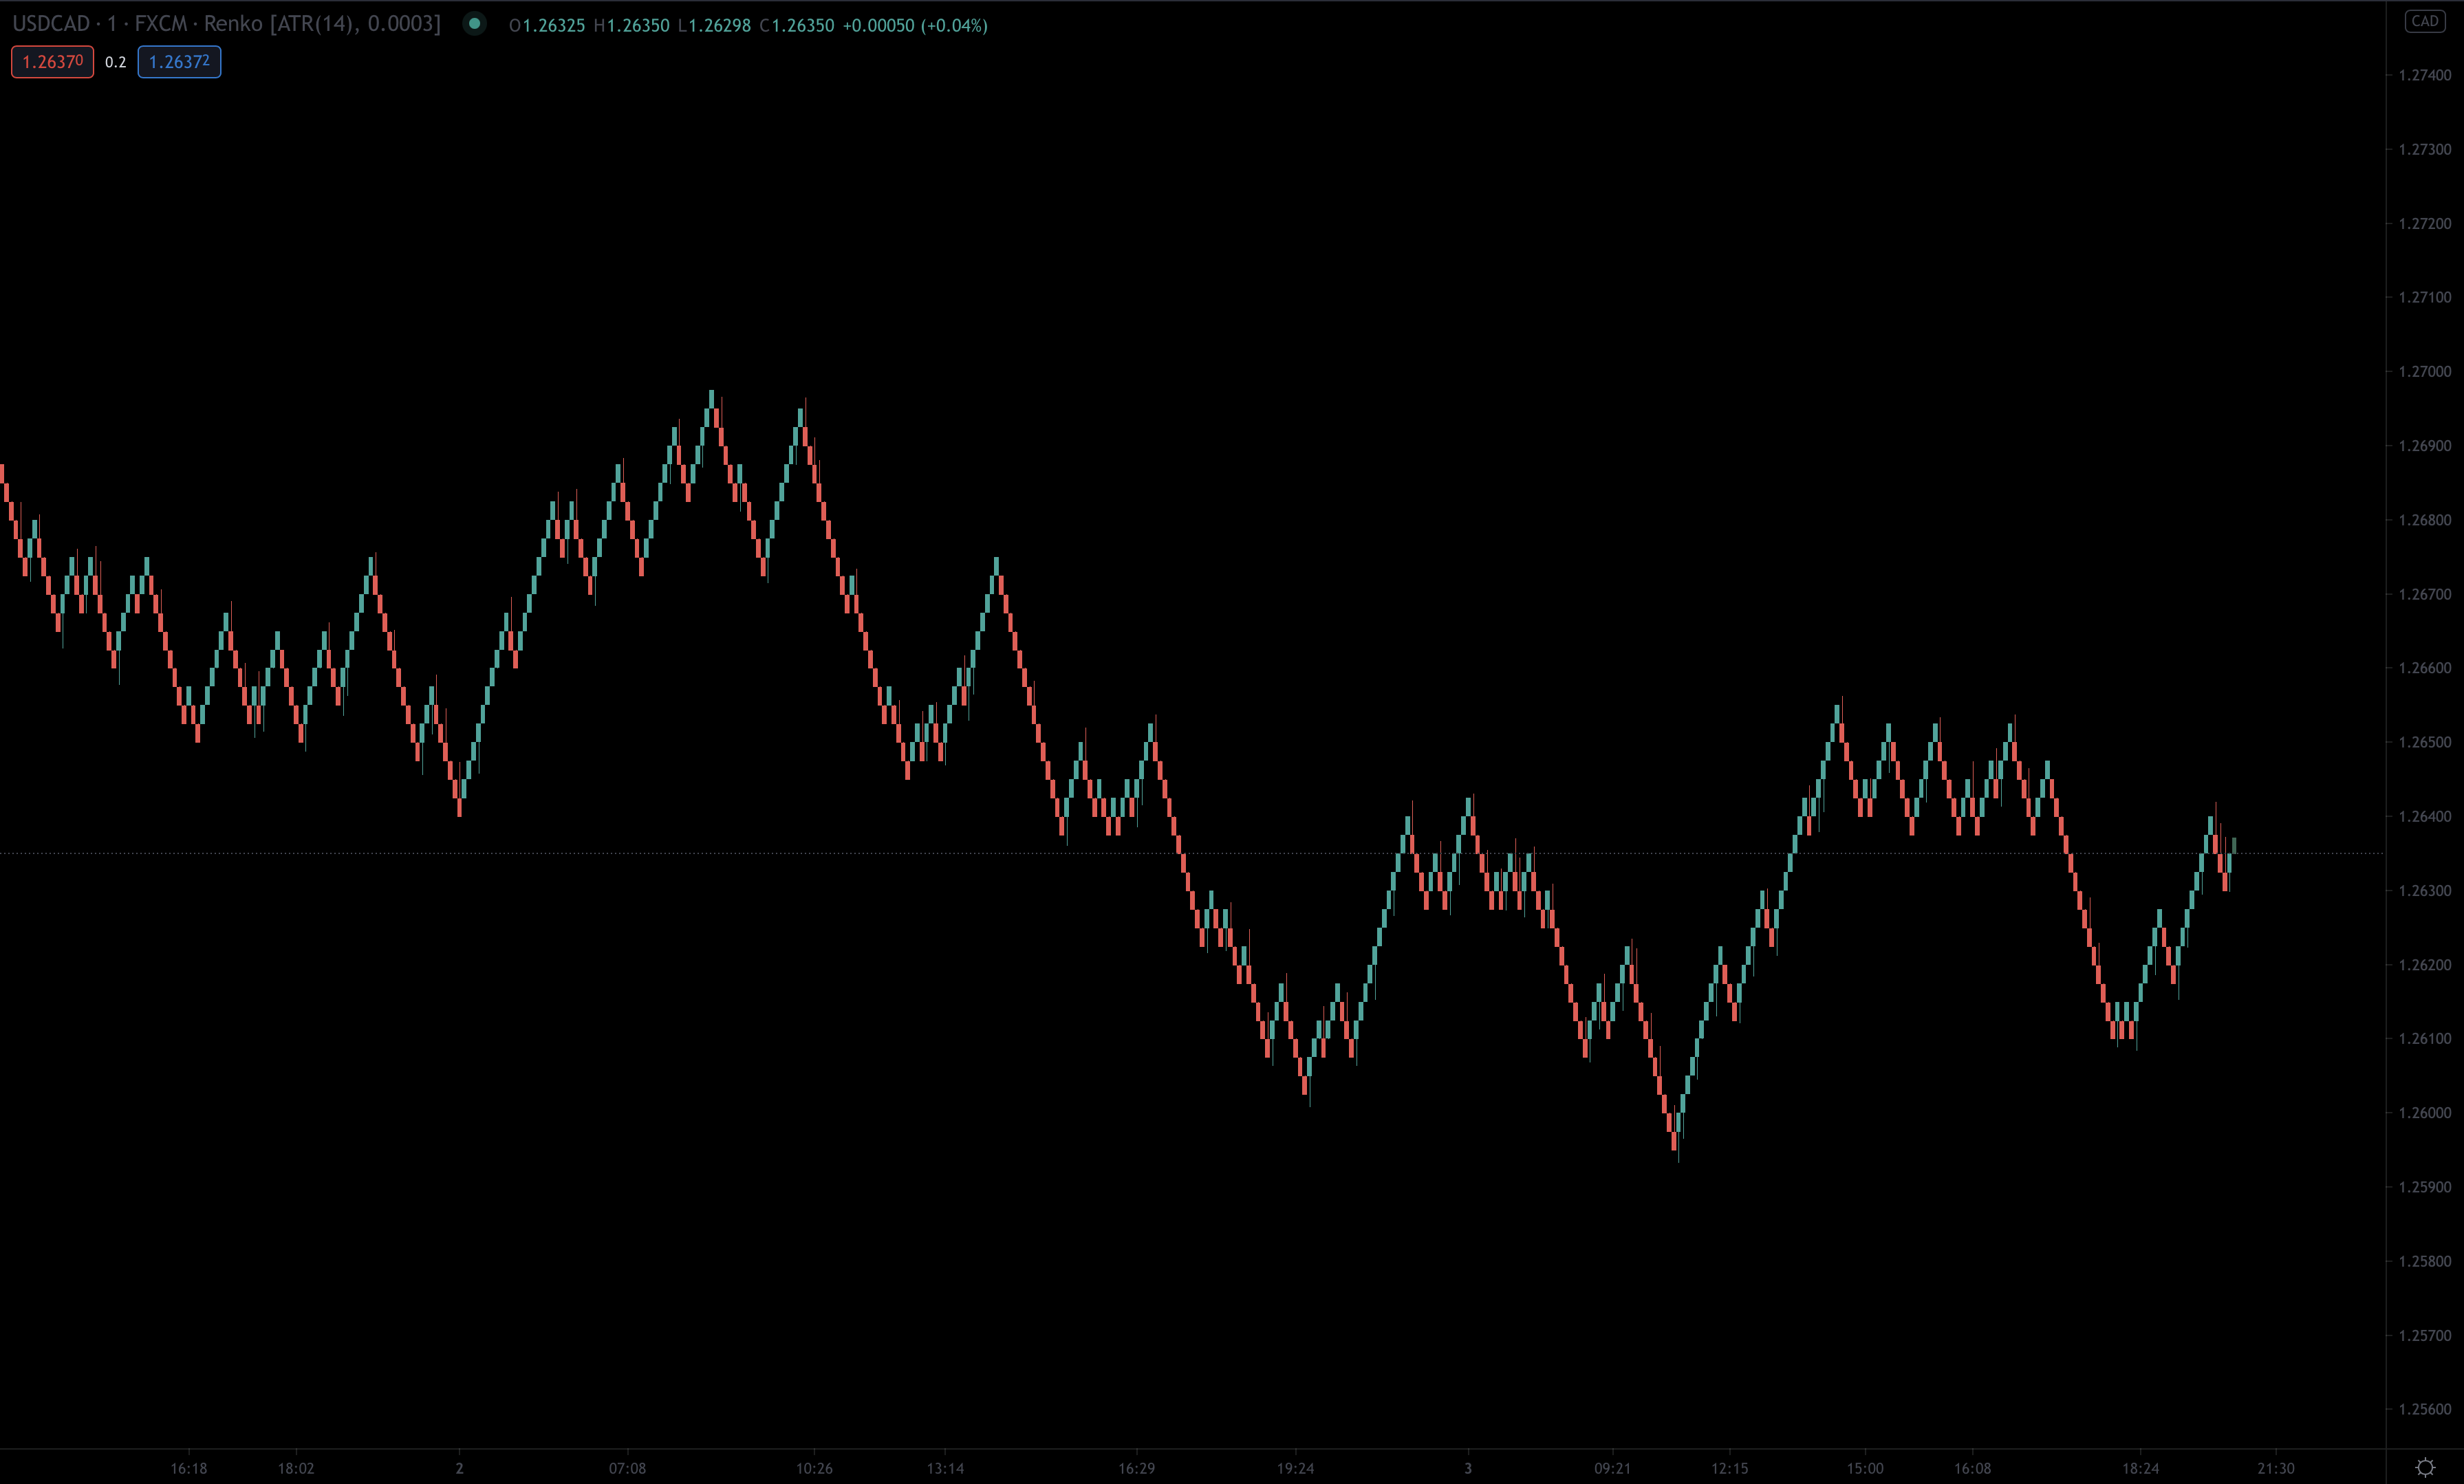
Nonetheless, Renko charts are very popular for smooth trending moves, and they can be used in any market of your choice.
The chart shows Renko on USD/CAD, which is calculated based on 5-minute ATR.
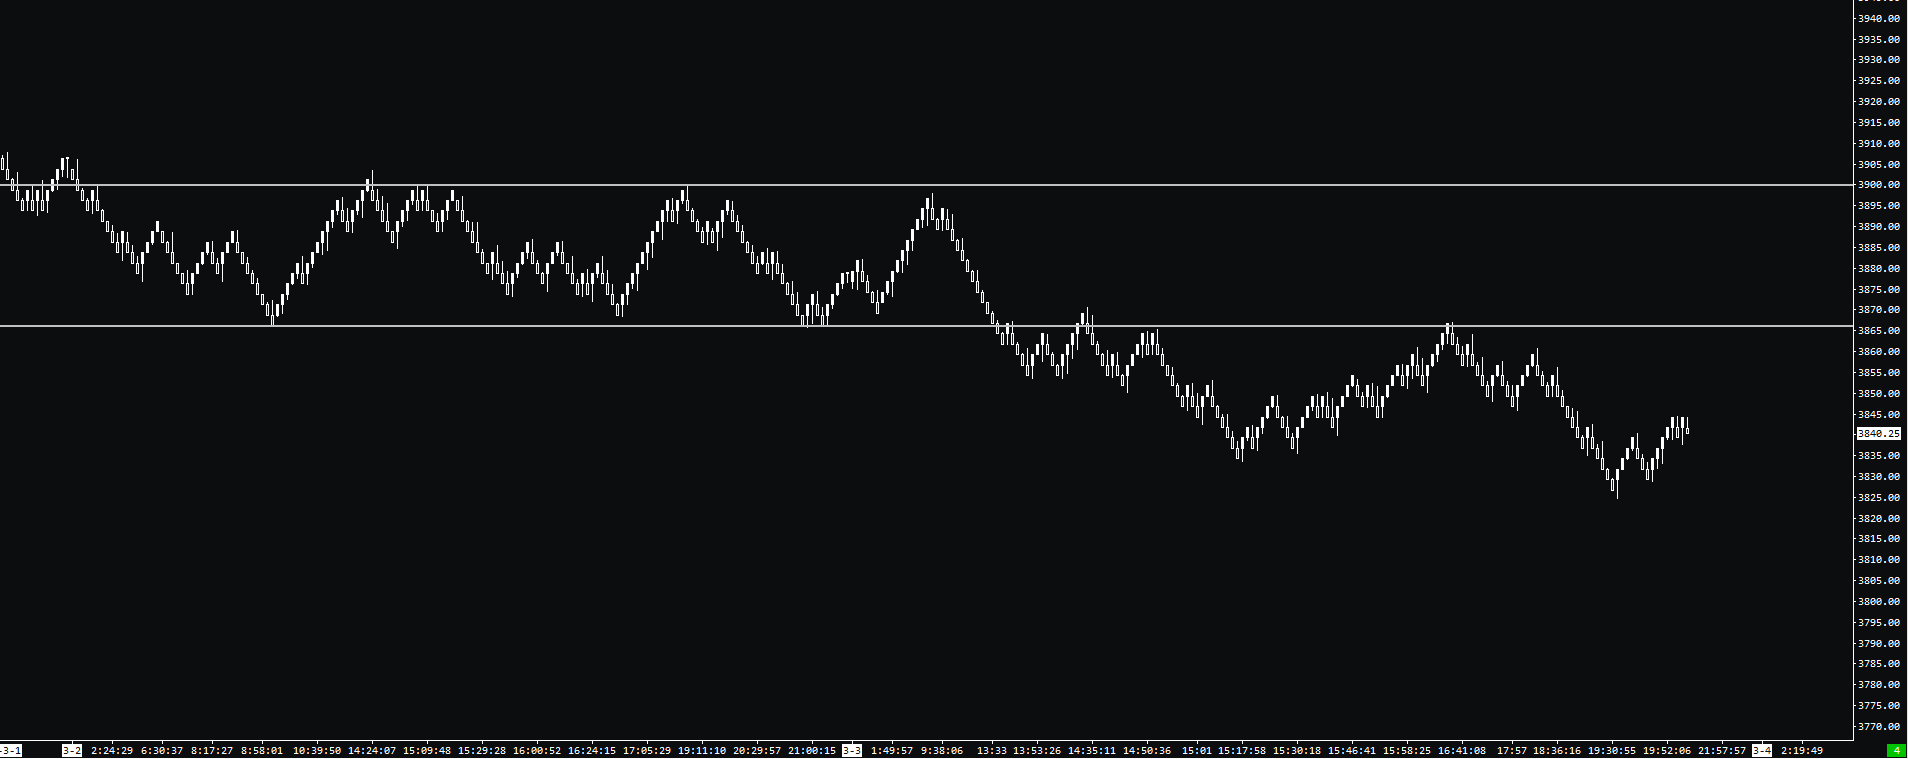
Point and Figure
Point and figure have a long history dating all the way back to 1898, where an anonymous trader named “Hoyle” wrote The Game in Wall Street and How to Successfully Play It.
In the early days, point and figure charts were used by drawing numbers, so they were referenced as “figure charts”.
Point and figure chart consist of X and O columns that are filtering price movement.
X-column represents rising prices, and O-column represents falling prices.
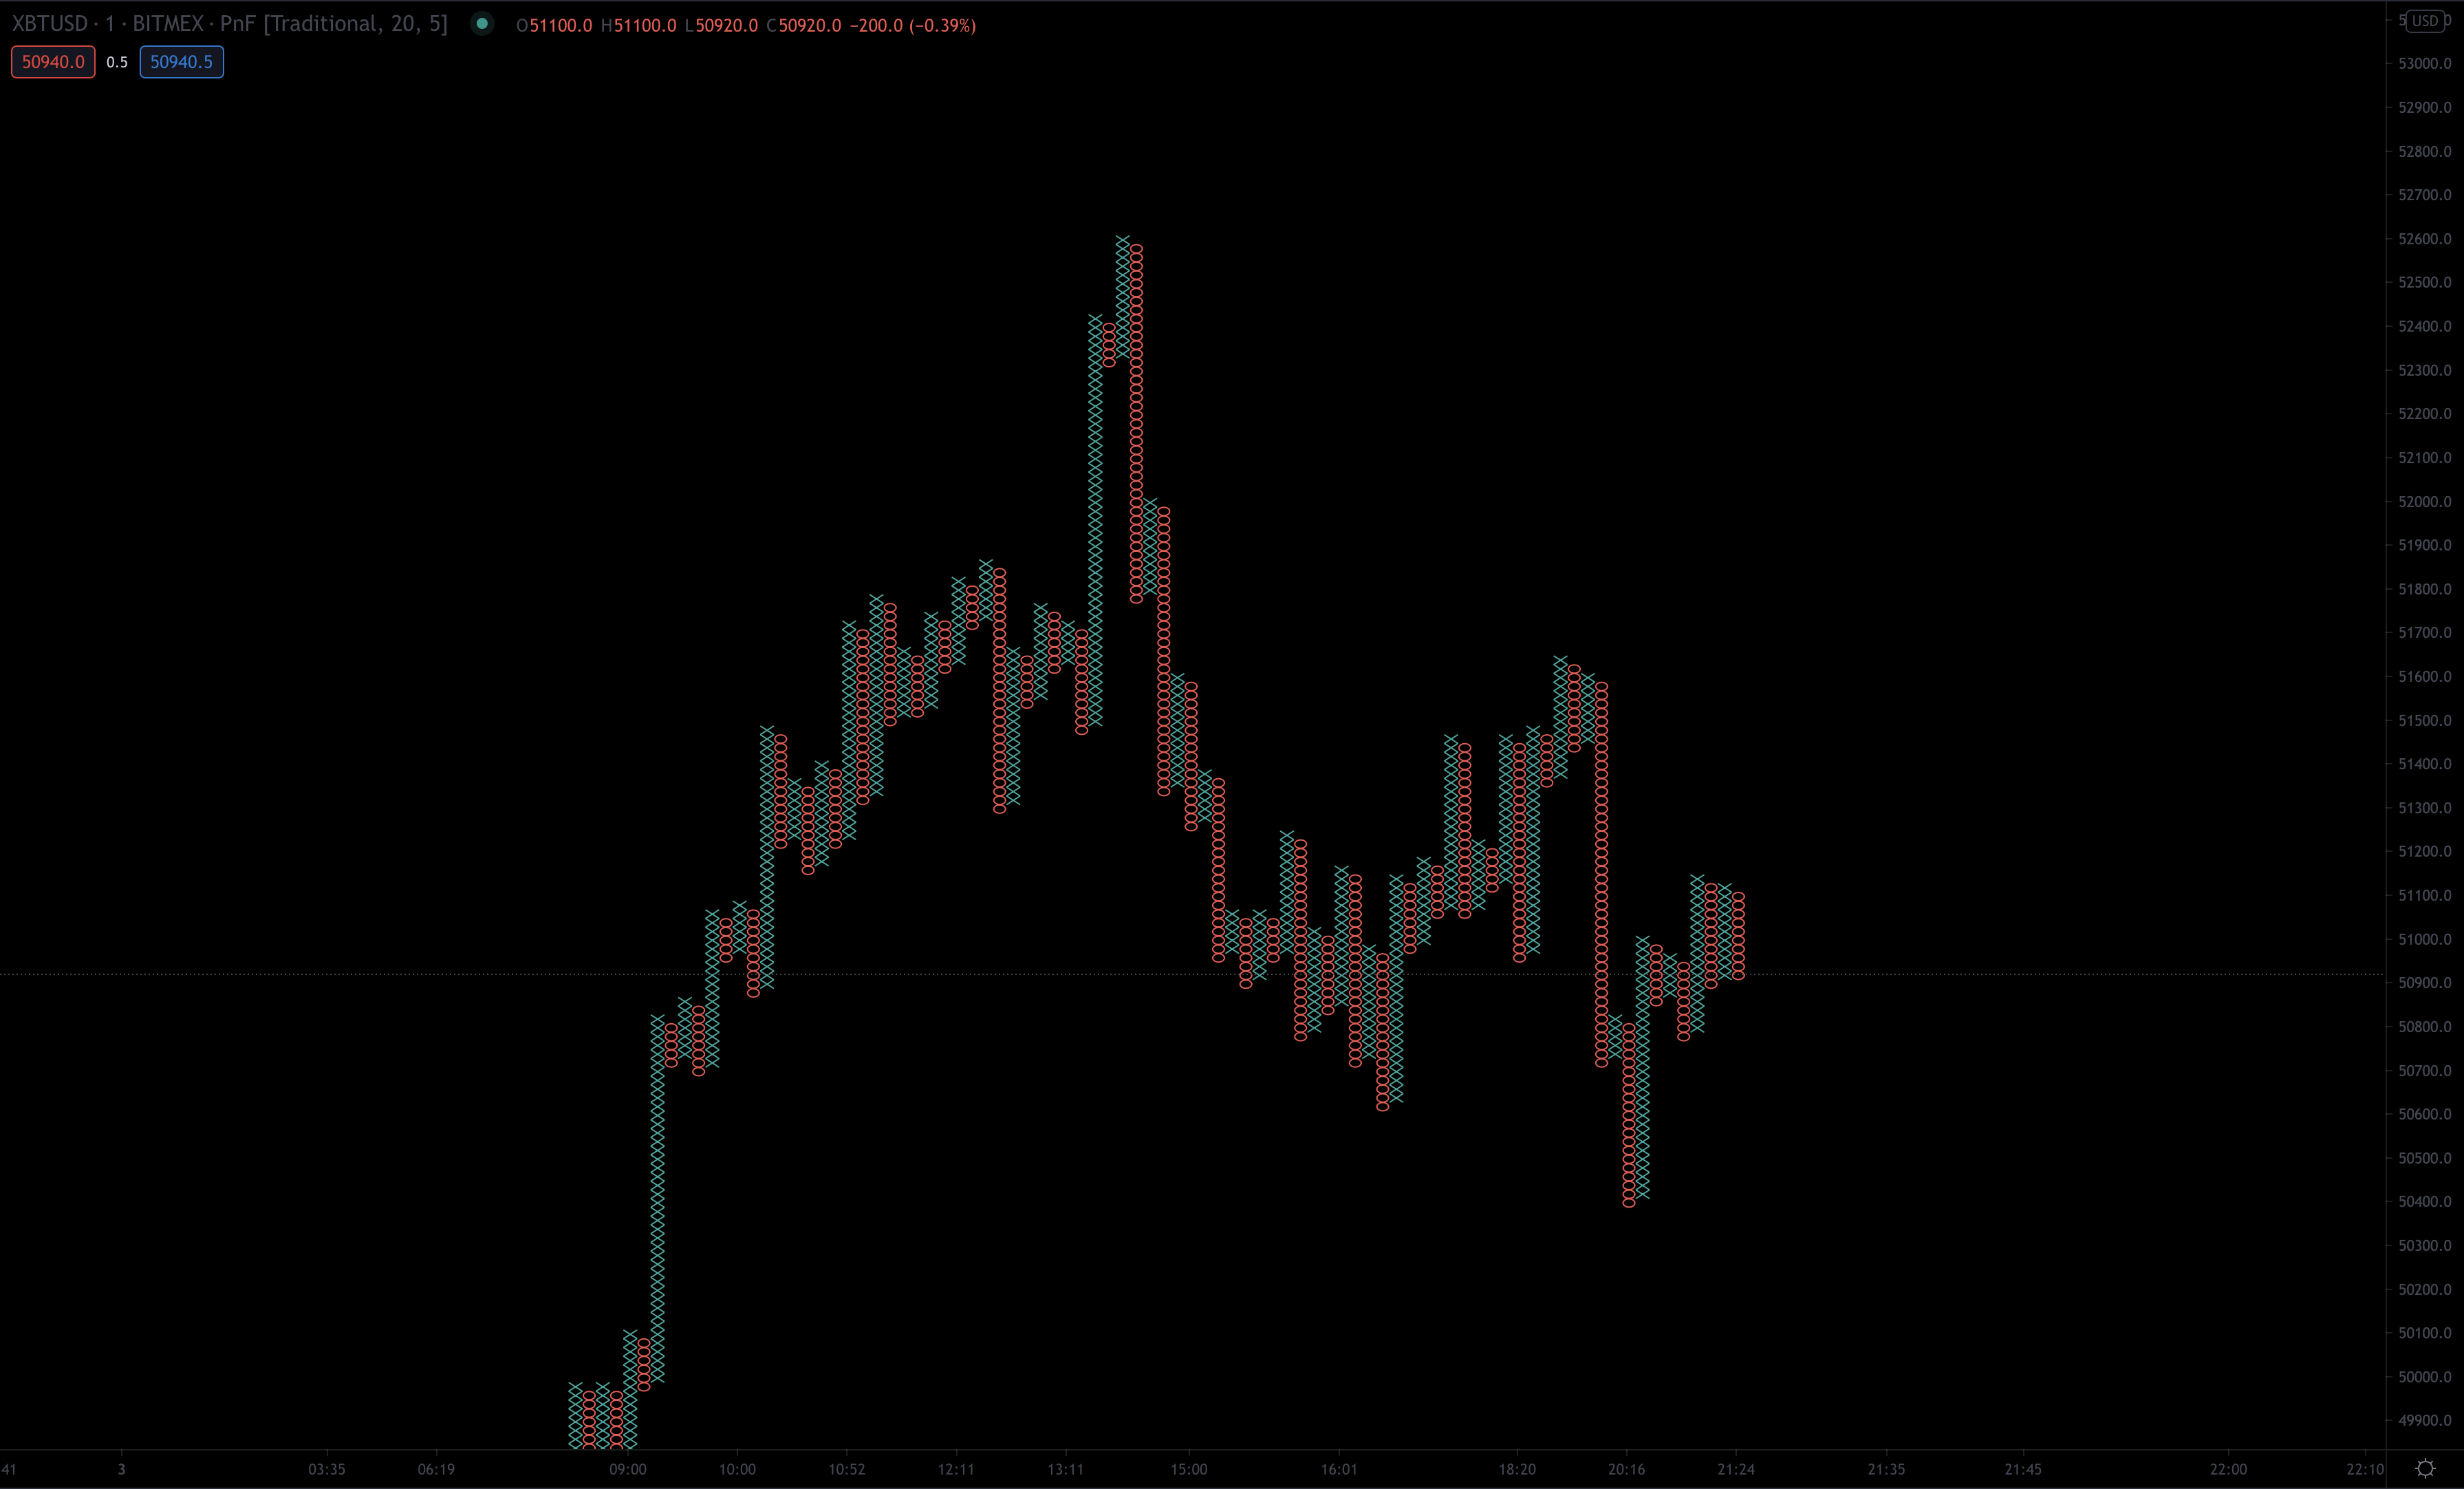
The setting of the Point and Figure chart consists of two numbers, Box size and reversal amount.
The 3-box reversal method is the most popular for Point and Figure settings, but you can play around with any numbers you want.
For the market to reverse and form a new column, the price must reverse by the reversal amount.
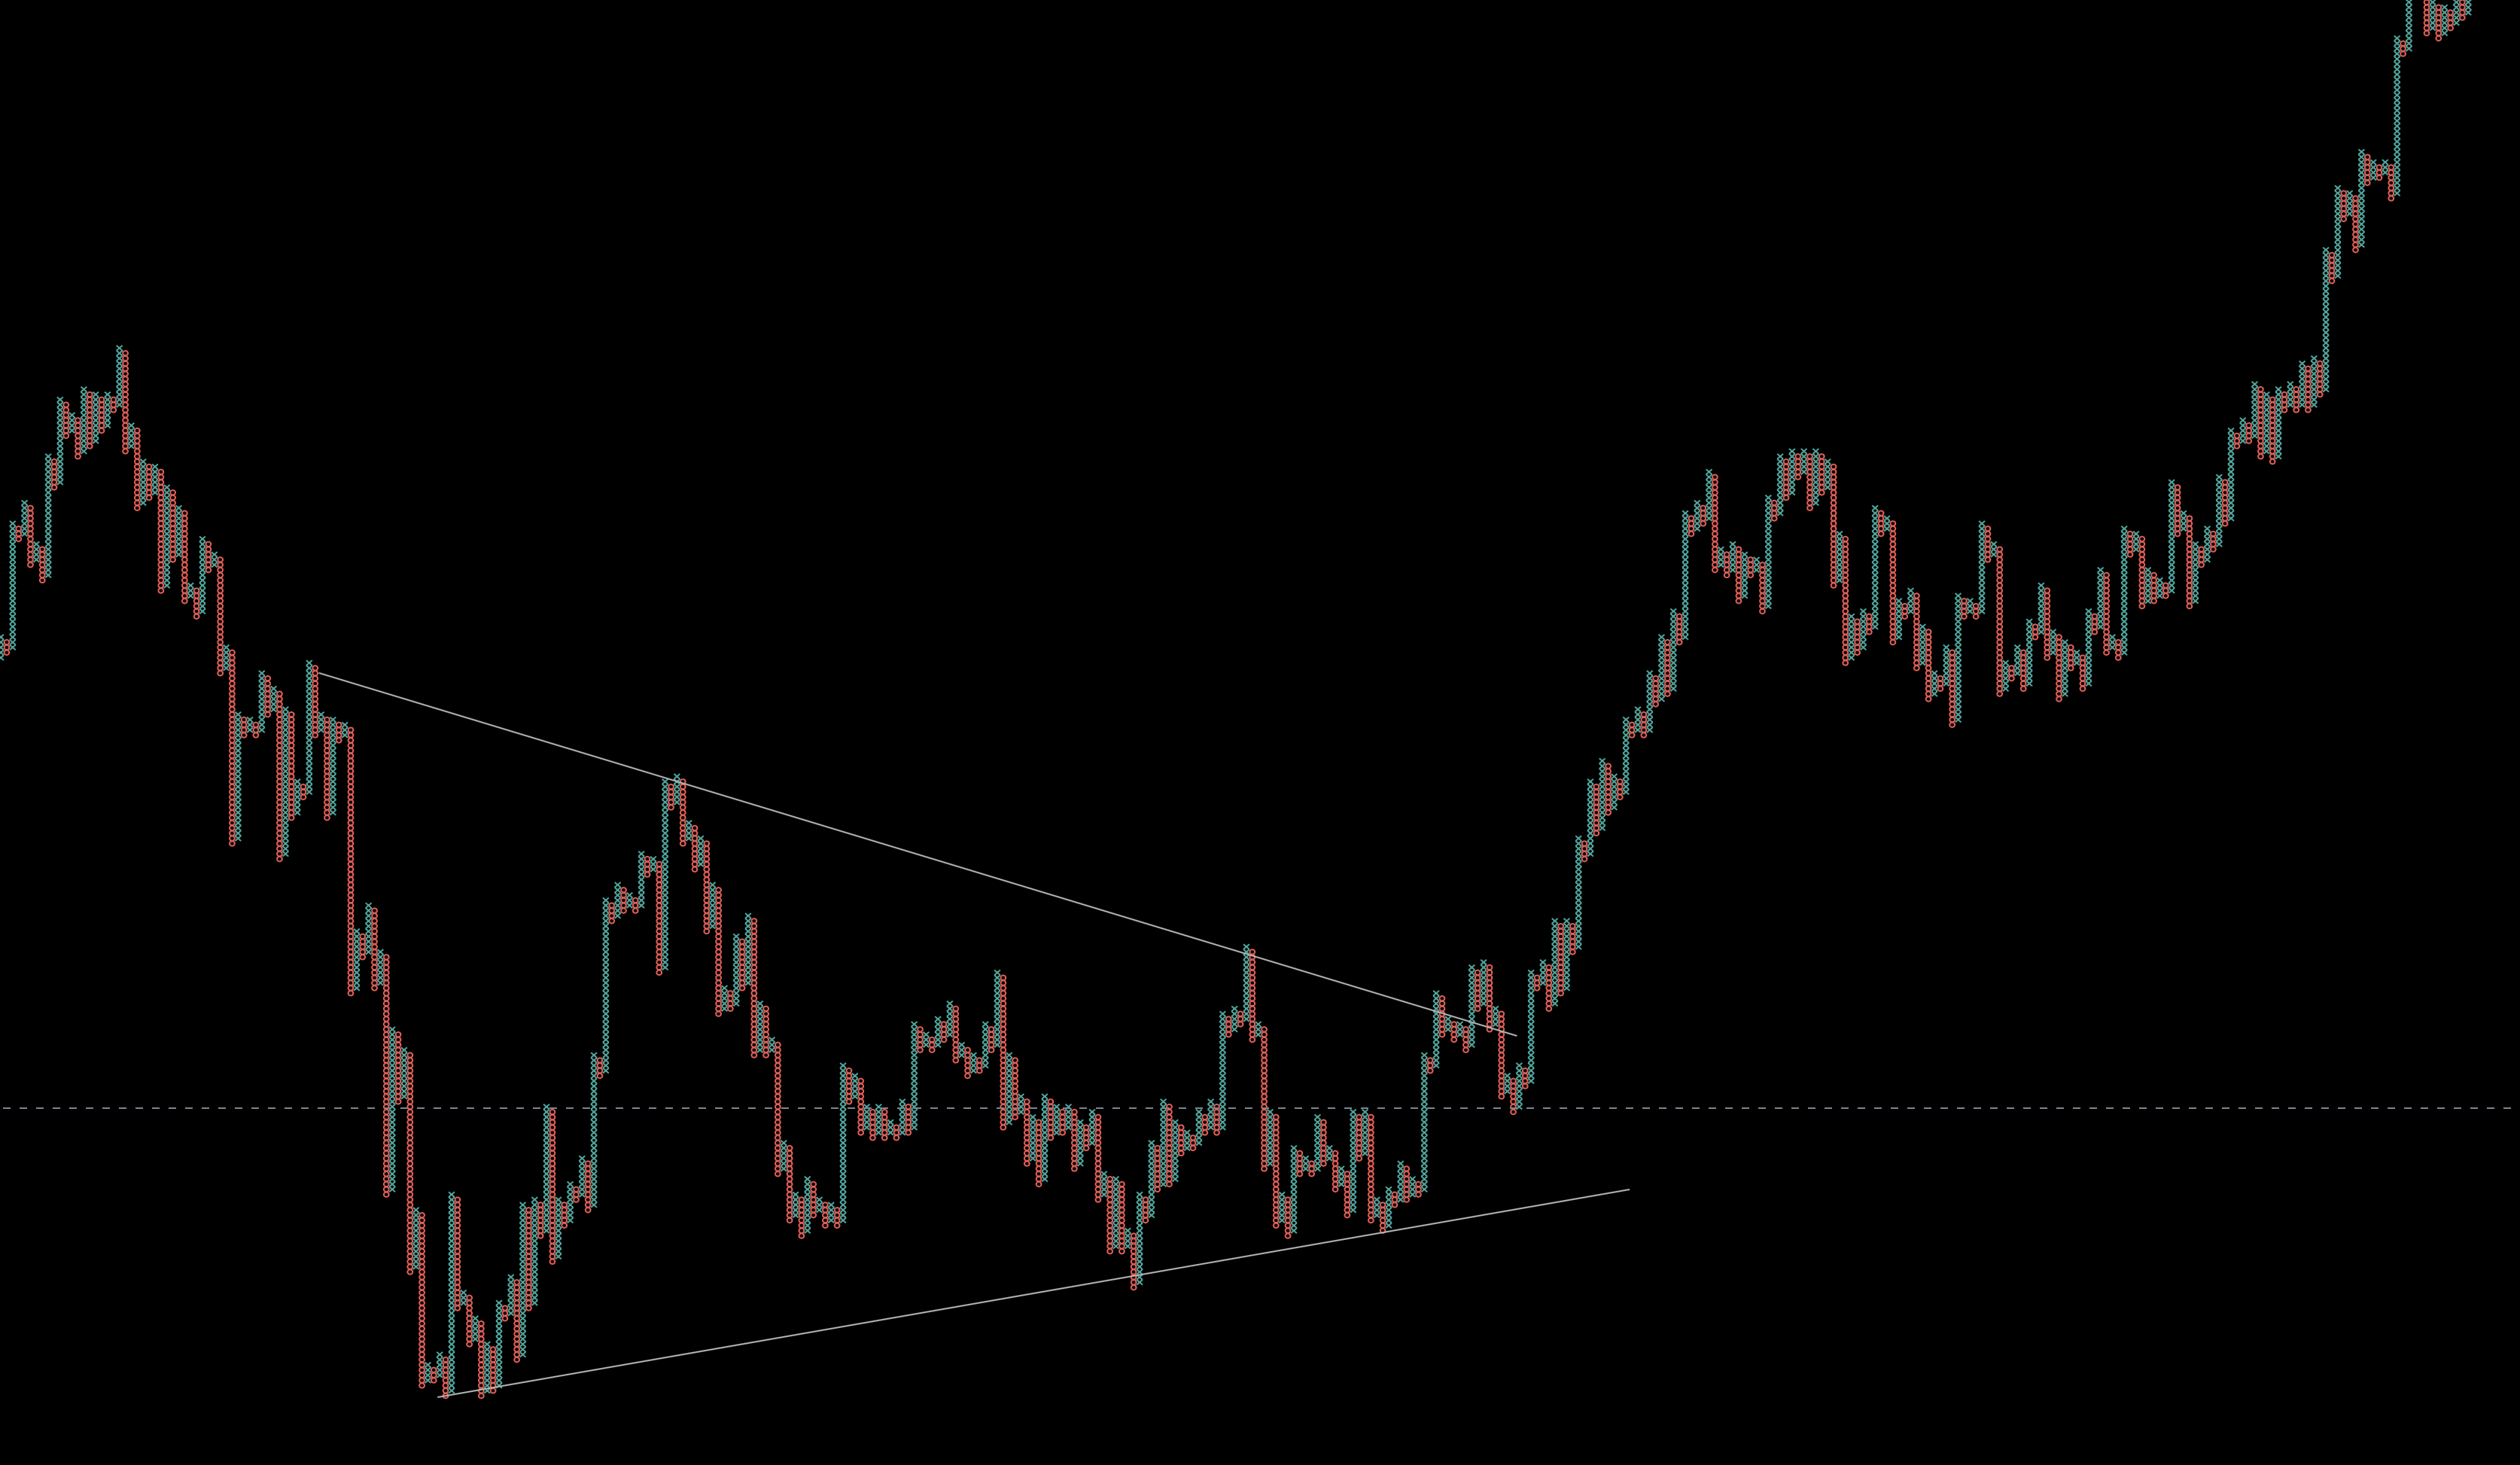
Point and figure chart can be useful in a higher timeframe analysis, and they smooth out a lot of noise you would see on a candlestick chart.
Thanks to that, you can easily mark out chart patterns or support and resistance levels.
Some more advanced platforms offer Point and figure chart calculations without X and O graphical representation.
This way, you will be able to benefit from the interesting calculation of P&F charts without feeling like you are watching some sort of weird artwork.
Volume Bars
Volume and Delta bars are the last on our list.
You won’t find these in that many trading platforms, but they can provide some interesting information for those interested.
To fully understand volume bars, we have to compare them to the tick charts as for less-experienced traders; they can seem to be the same.
Tick charts print a new bar for X number of trades. If someone executes one contract, it counts as one tick.
If someone executes ten contracts in one transaction, it still counts as one tick.
For volume bars, when someone executes ten contracts in one transaction, it would count as ten ticks on the volume bar.
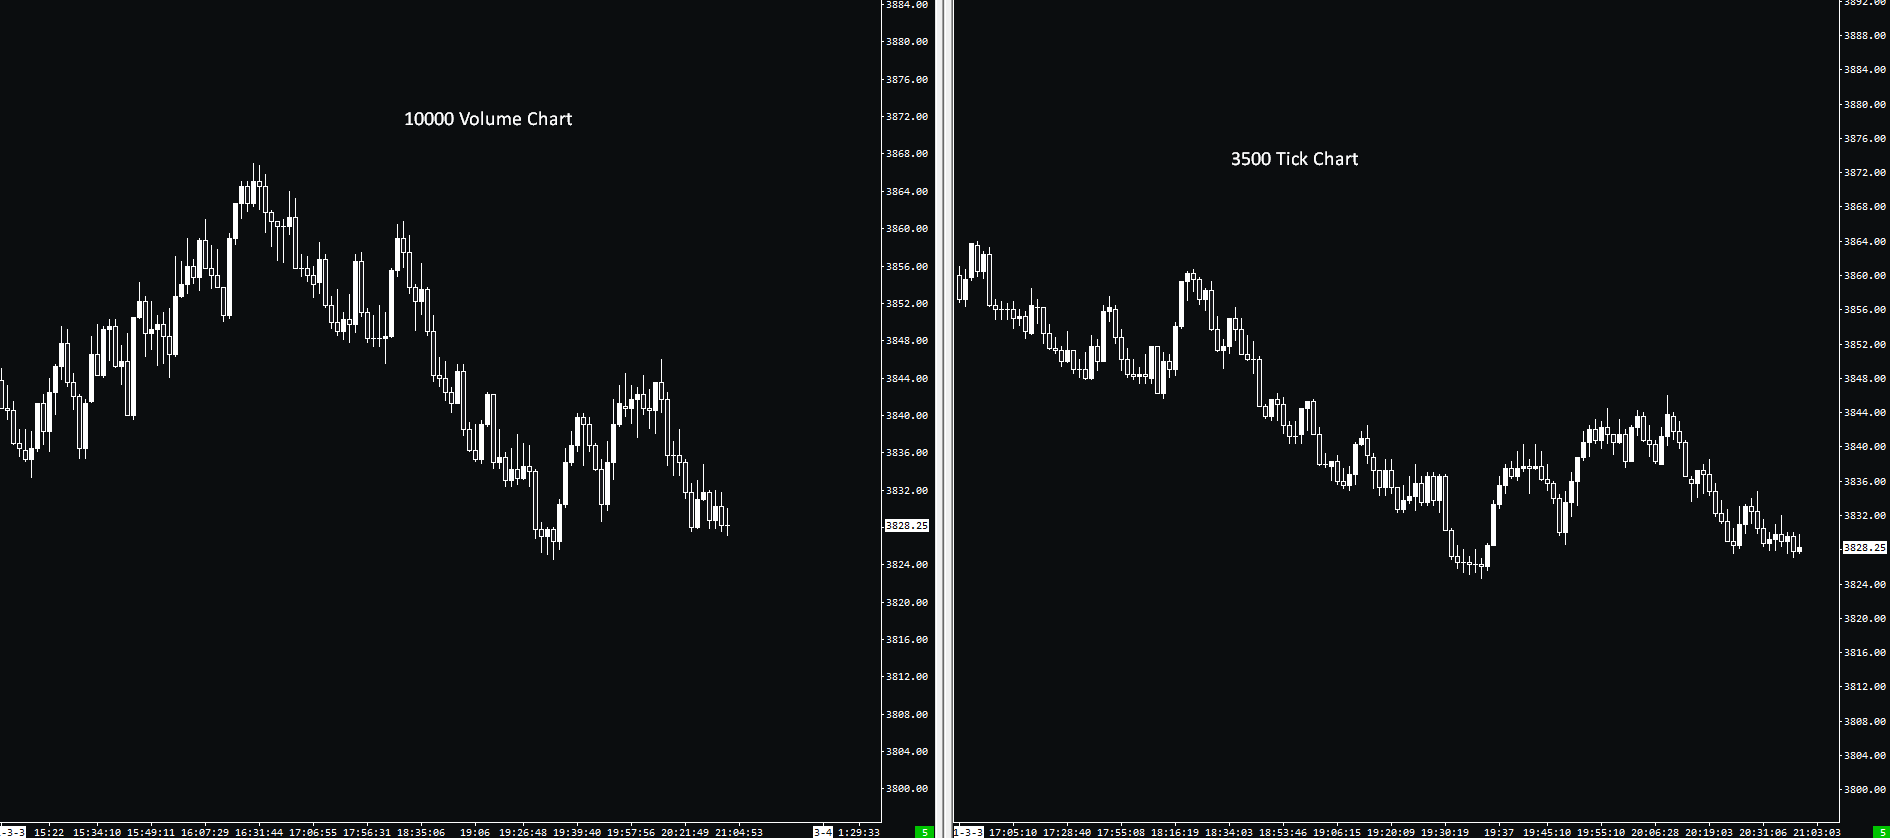
Because of this, volume bars can actually show us when any significant players are stepping in.
If you are wondering which one is better, it is once again up to your personal preference.
Tick charts are more popular and available simply because they are around for longer.
Mastering volume is a complex subject in trading, I have mentioned it in several articles, and there is one article dedicated to Volume profiles, which is the most popular use of volume in trading.
Delta Bars
This is quite a niche chart setting but can be utilized by many orderflow traders.
The topic of delta and orderflow was heavily covered in this blog, and if this is the first time you hear the words “delta” or “orderflow”, make sure to read an article about orderflow trading.
So what is Delta?
Delta represents the difference between finalized orders at the bid and ask, in other words, the market orders.
In Sierra Chart, which offers Delta bar setting, the new bar is created once the difference between the Ask Volume and Bid Volume exceeds a certain threshold.

This 1000 delta chart of E-Mini S&P500 tells us that every bar was created once Ask and Bid Volume exceeded 1000 contracts.
Conclusion
There are quite a few options once you decide to leave classic time-based charts.
From my experience, tick and Renko charts are the easiest ones to grasp and can provide us with clean trading signals when it really matters.
Once you find a data-based chart that suits your trading style, you will be able to easily mark out support and resistance areas, filter out noise during low volatility periods and stay in trends longer.
On the hand, don’t think that classical time-based charts are useless, they are still used by most traders, and you won’t have to constantly adjust them during periods of high or low volatility.
Testovito
Thx for article.
martin heather
Hi Adam…
I purchased your trading blue print it really is excellent without doubt the best course I have ever paid for. I have purchased courses that are 10 times the price and learned nothing. On your tick chart you have the delta profile indicator I would like to add this to my 30 minute chart I really like it but I cannot find it in the studies section on Sierra and when I try and copy it over I lose all the other studies I have in the chart. Can you help me please. where can I add the study from? Many thanks in advance.
Adam
Hi, it is for download in the Templates at Blueprint page 🙂